#100daysofdata search results

I Officially began my data analytics journey. But not today. I choose to show up daily, even when Excel crashes or on days I feel like giving in to my lazy self. May Allah make it easy and keep my focus strong 🤲 #100DaysOfData #NewbieAnalyst


DAY 20 of #100daysofdata Finally hosted my portfolio on GitHub pages after some minor challenges. Thankfully, my perfectionist side didn't take over so yeah, I don't think it's good enough yet. Will work on brushing it up in the coming weeks, months and years.


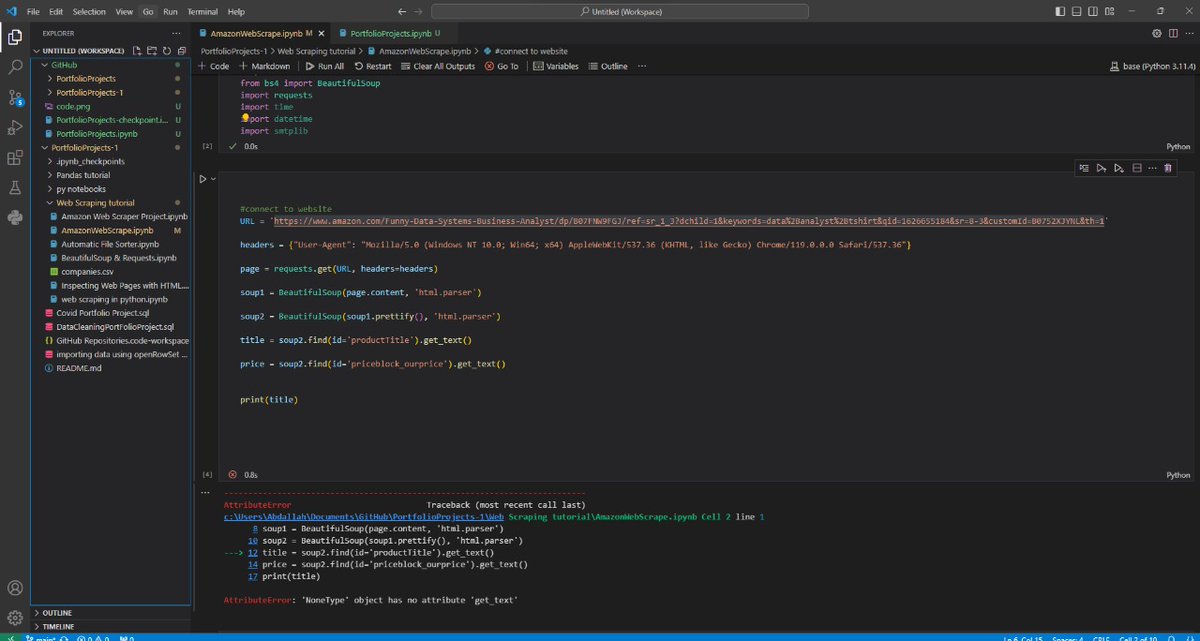
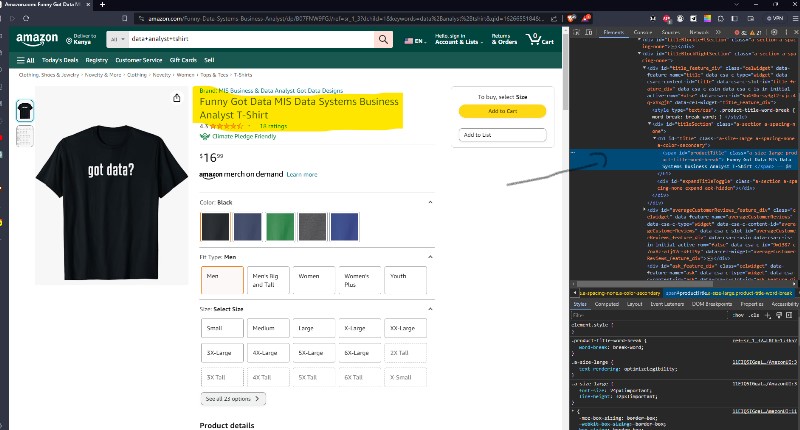
Day #73 of #100daysofdata #100DaysOfCode but Im having a bit of a challenge in a scraping project. its quite simple but maybe Im a bit tired. Im getting this attributeError when I run this, It should being the highlighted part. What im I missing? Wazito @HarunMbaabu et al.

Day 39 of 100: Excel Quiz Mode I just finished a knowledge check on Excel today From functions and formulas to sorting and conditional formatting, and it all came together I feel so great to see how far I’ve come On to the next! #100DaysOfData #BuiltbyAmiee


Día 100 del reto #100DaysOfData: Hoy terminé la ruta de SQL Fundamentals, aprendiendo sobre RPAD, LPAD, TSVECTOR, TS_QUERY, User Defined Functions, SUBSTR, POSITIONS, ARRAY y Custom Data Types. ¡Gracias a todos por ser parte de este emocionante viaje! 🙏🏻💙#DataJourney

Day 19 of #100daysofdata Took a break to work on my portfolio. Currently creating a portfolio using GitHub pages and visual studio code. I'm hoping the perfectionist in me doesn't spend too much time trying to put out a perfect portfolio. #100daysofcode #100daysofdata

Día 95 del reto #100DaysOfData: Ayer terminé de estudiar muy tarde, ¡por eso no tuiteé! 😅 Pero valió la pena, porque estudie sobre suavización exponencial simple para pronósticos de demanda. 📈 Además, descubrí el gráfico de bala 🎯 para comparar medidas con objetivos.


Day 11: 100 Days of Data Analytics Recommended Book for DAX. #100DaysOfCode #100DaysOfData #DataFam #Techtwitter #Tech

Day 37 of 100 — Still in SQL Join Today, I explored: - Subqueries - EXISTS checks - Self-joins SQL Views for reusable queries Each concept feels like unlocking a new capability. Onward, we move #100DaysOfData #SQL #datafam #BuiltbyAmiee #LearningInPublic
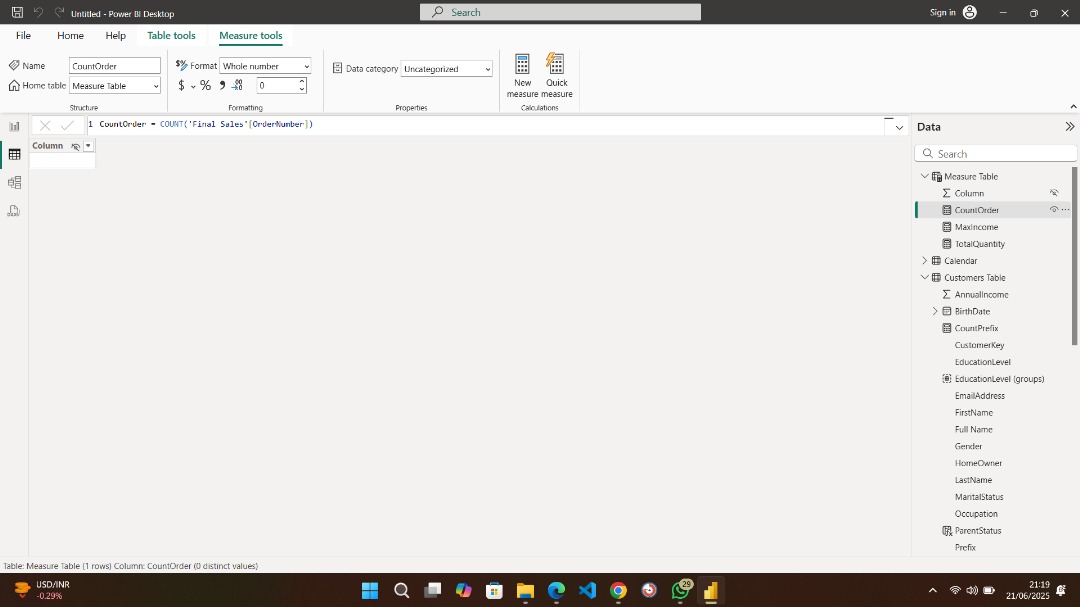
Day 16 of 100 — Math meets DAX Today was all about exploring mathematical functions in Power BI: - SUM, DIVIDE, AVERAGE, MIN, MAX - Simple tools, but powerful insights Now I see how clean formulas = clean dashboards. I love it #PowerBI #BuiltByAmiee #100DaysOfData #datafam


Challenge accepted. #100daysofdata challenge continue.....

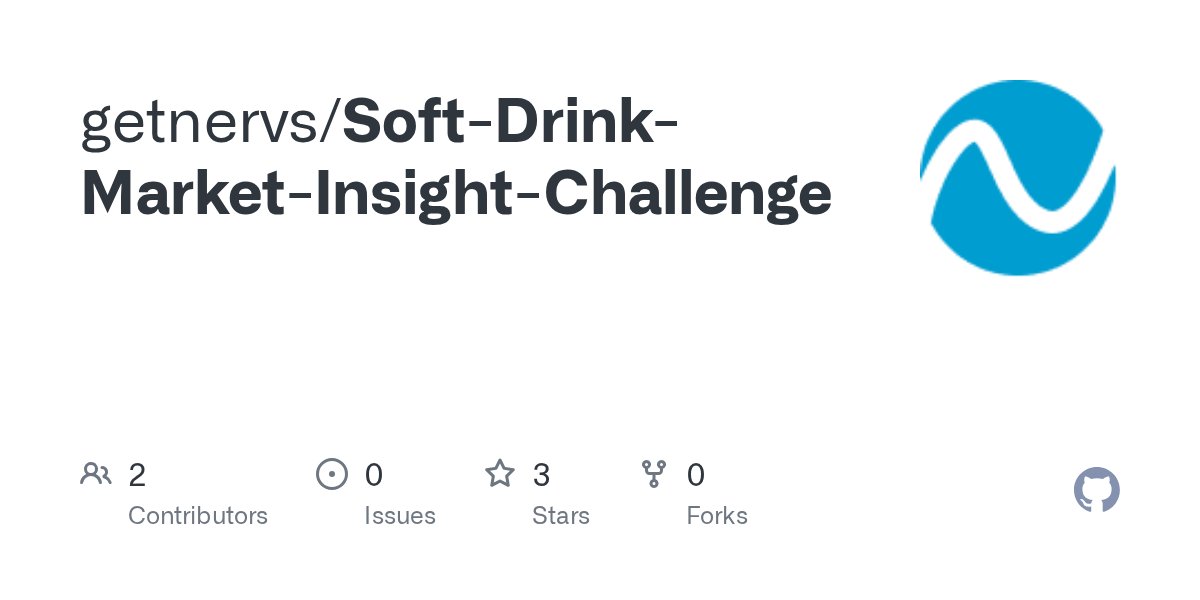
November Data Analysis Challenge🎉 Open to everyone😇 1st prize 100,000 2nd 70,000 3rd 30,000 Here is the dataset: github.com/getnervs/Soft-… Check here for submission guidelines: github.com/getnervs/Soft-… Deadline: 30th November Make sure you follow the guidelines

Day 5 of #100DaysOfData: Making ChatGPT your assistant Today, I worked on prompting @OpenAI's ChatGPT. I need a fresh dataset and a problem case to implement #MachineLearning models. Here are the prompts and the results generated 1 . . .

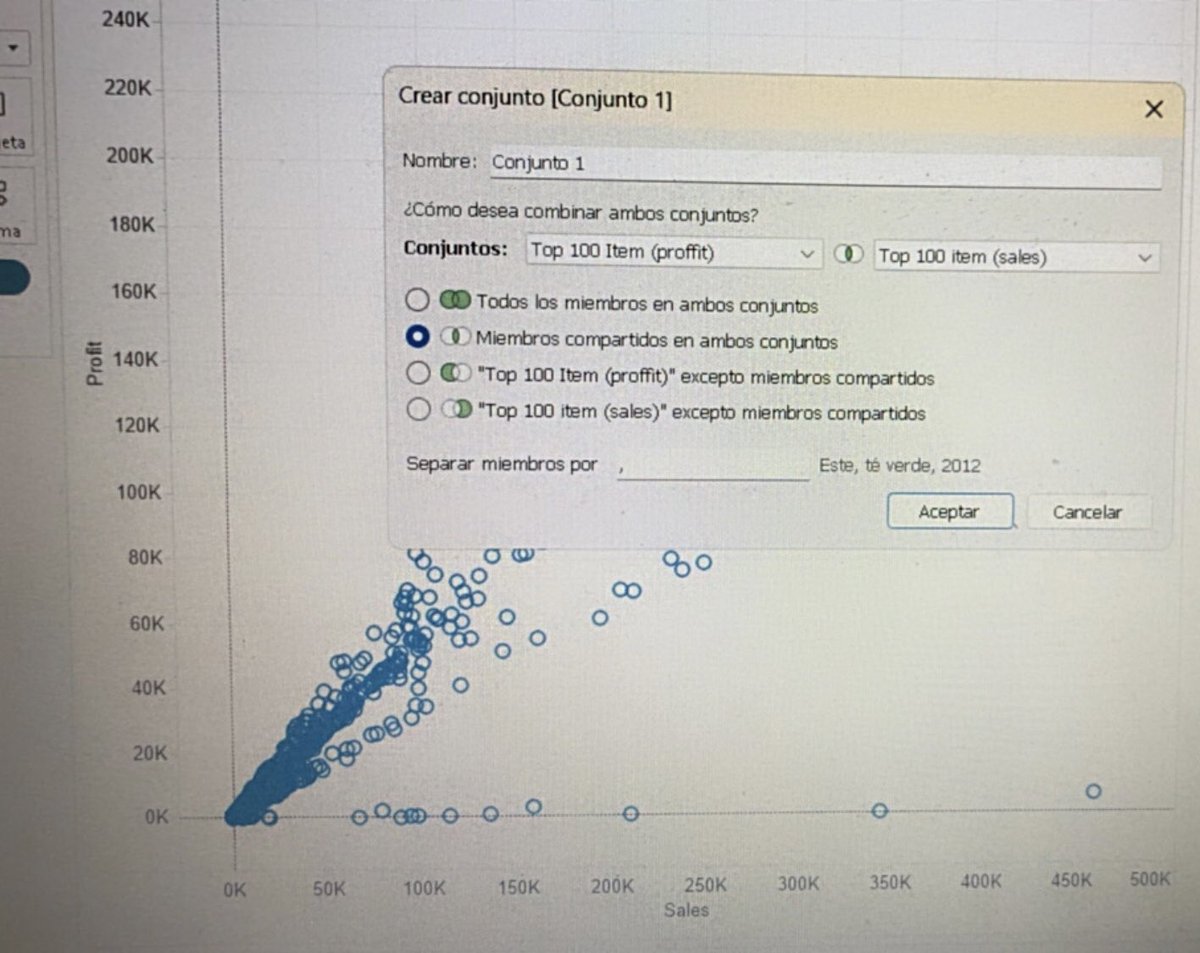
¡Día 92 del reto #100DaysOfData completado! Hoy me dediqué a aprender sobre sets, columnas combinadas y agregación de atributos en #Tableau 💙💪🏻 #DataScience

Day 49 of #100DaysOfData I completed a case study: Analyzing Marketing Campaigns with Pandas Here's what i did; 1. Feature engineering & Exploratory analysis 2. Customer segmentation 3. Built functions to automate analysis 4. A/B testing


Day 1 of #100DaysOfData 🚀📊 Started my journey with Dataquest! Today, I learned about defining data, how to use it, and the data analysis process in Excel.

#100daysofdata Variables and Loops in Ms SQL server

I did this capstone project which is a requirement for the Data engineering track, I have only one course remaining to complete data engineering😂😂 wild, ik app.datacamp.com/workspace/w/76… here is the link to the workspace. this was really fun #100DaysOfData


Day 28/#100DaysofData Still on #Google #DataAnalytics Understanding or defining the problem is very important before you will be able to solve it. " If I were given one hour to save the planet, I would spend 59 minutes defining the problem and one minute resolving it." -Einstein

I Officially began my data analytics journey. But not today. I choose to show up daily, even when Excel crashes or on days I feel like giving in to my lazy self. May Allah make it easy and keep my focus strong 🤲 #100DaysOfData #NewbieAnalyst
Challenge accepted. #100daysofdata challenge continue.....
November Data Analysis Challenge🎉 Open to everyone😇 1st prize 100,000 2nd 70,000 3rd 30,000 Here is the dataset: github.com/getnervs/Soft-… Check here for submission guidelines: github.com/getnervs/Soft-… Deadline: 30th November Make sure you follow the guidelines
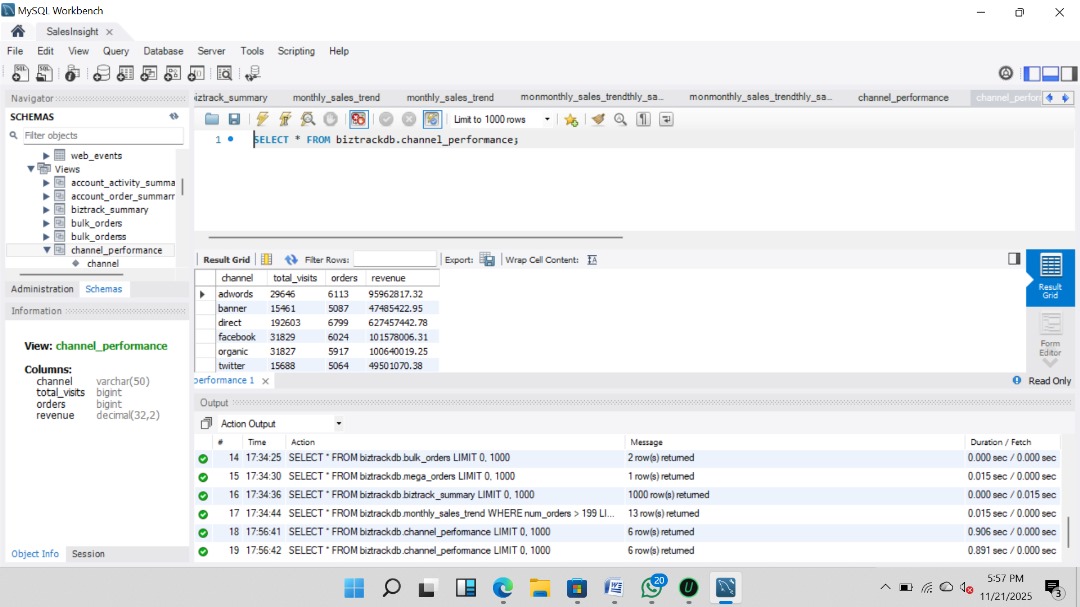
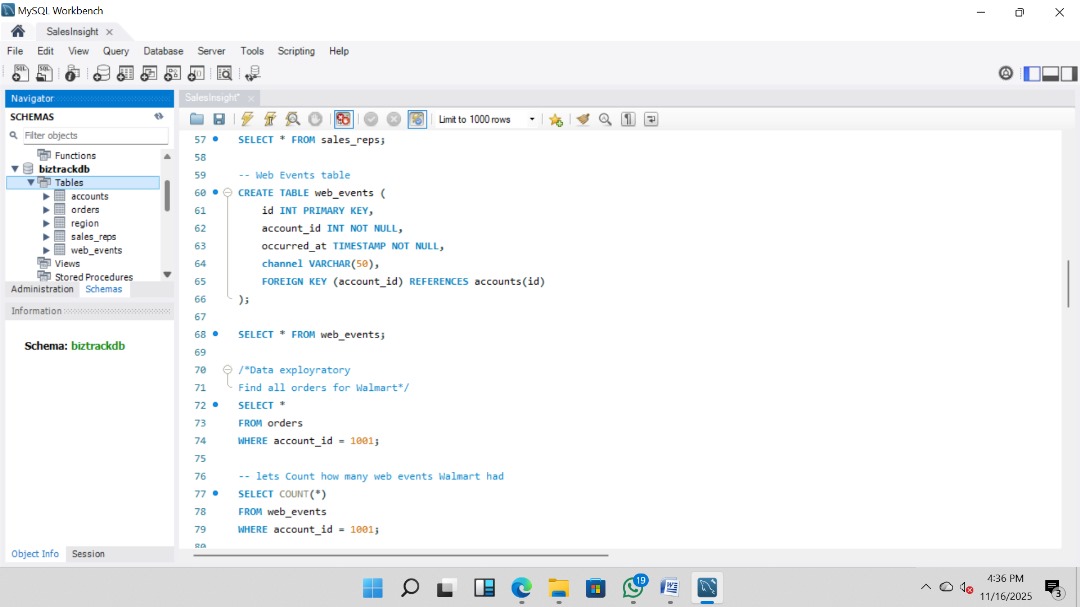
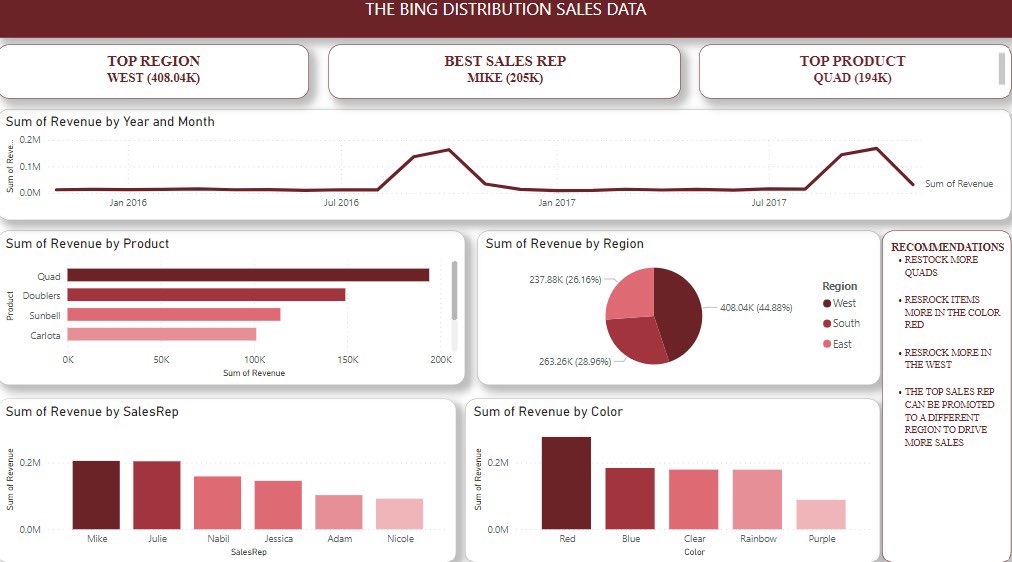
Mega Orders View, captured big‑ticket sales while Customer Engagement View connect web visits & orders. Monthly Sales Trend View monitor growth over time #DataAnalyst #SQL #100DaysOfData #DataScience #Udacity

Overall, it was an amazing learning experience. See you tomorrow! #100DaysOfData #Day2of100 #DataAnalysisJourney #PythonLearning #LearningInPublic #RoadToDataAnalyst
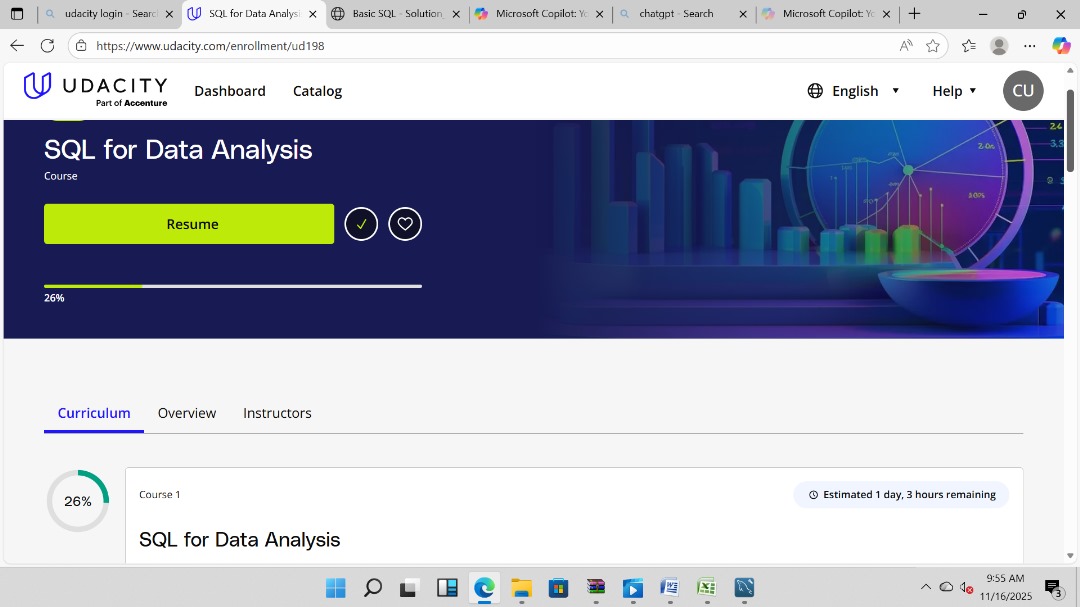
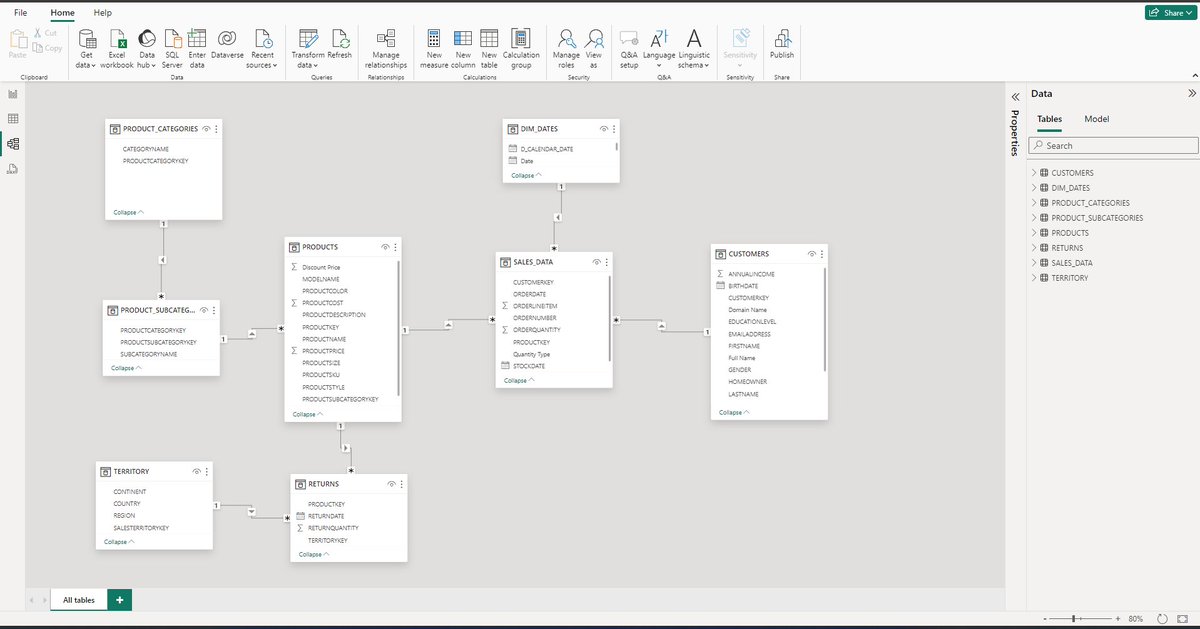
#Day1 of #100DaysOfData I just started a new SQL for Data Analytics course with Udacity. Using the dataset provided, I built my own database with 5 tables. Excited to dive into queries, dashboards etc over the next 100 days. #100DaysOfData #SQL #DataAnalyst #DataScience #Udacity
#100DaysOfData Challenge Starting this evening, I’ll share daily DA → DS progress live on X. From Excel dashboards to Python models, SQL mastery etc. Just enrolled in Udacity’s SQL for Data Analysis. Follow @InsightAnalyst4 #DataAnalyst #DataScience #100DaysOfData

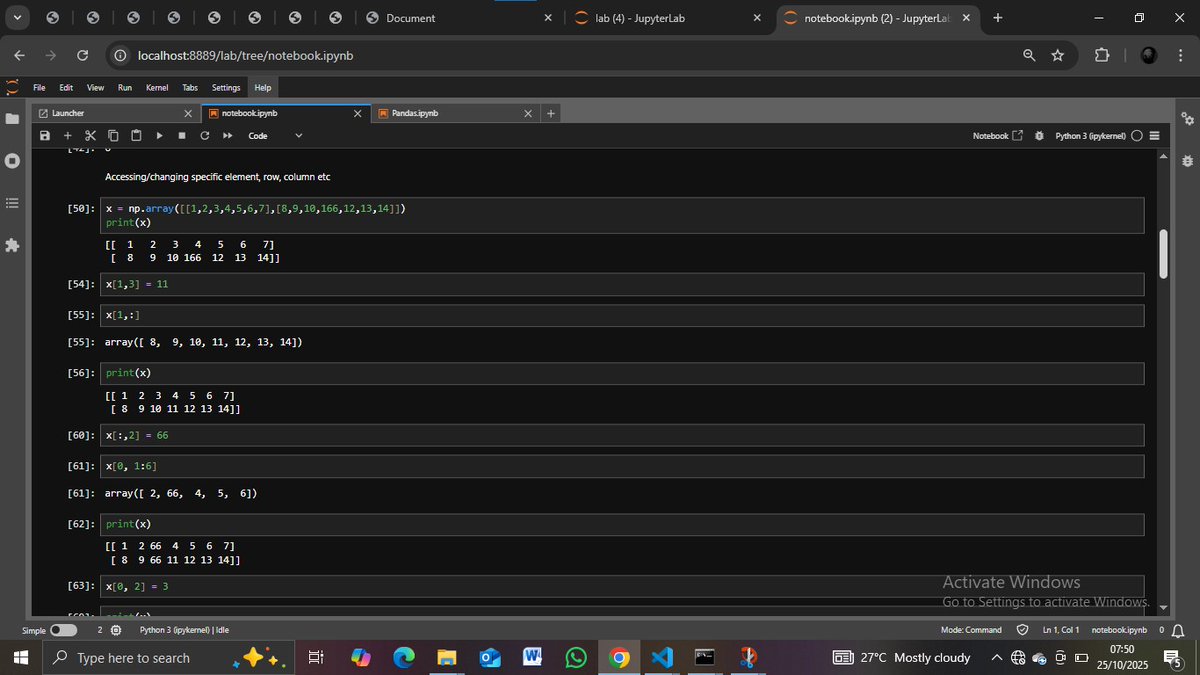
Day 18 of #100DaysofData 📊 Today, I continued learning NumPy and focused on three key concepts: 1. Basic Statistical Operations NumPy allows quick summaries of numerical data without writing long loops. Some common operations include: 1/5
Day 17 of #100DaysOfData 📊 Today I explored basic NumPy operations. I performed math directly on arrays, slicing parts of arrays, reshaping them, and understanding how indexing works. 1/2
I'm back guysss✨ I was away for about 2 weeks because life was lifeing 🥲 Lectures became intense, I had a faculty workshop, I fell sick, and to top it all, my phone got bad but now I'm back 🌸✨ #100DaysofData 📊

Hey @X algo I’m building my network around: 📊 Data Engineering 🗄️ Big Data & ETL Pipelines 🐍 Python, SQL ☁️ Cloud & Data Warehousing If you’re learning or working in any of these let’s connect and grow together #bigdata #DataEngineer #100daysofdata #TechCommunity

Week 1 of my Financial BI journey 🎯 This week: ✅ Finish DataCamp Excel track ✅ Start Aqskill Financial Excel ✅ Complete SQL Joins ✅ Build first Excel project 90 days to job-ready. Let's go 💪 #DataAnalytics #100DaysOfData

Day 2 of #100DaysOfData 📊 Explored more Seaborn plots today: -barplot, boxplot, countplot -histplot, stripplot, swarmplot, violinplot 🎨 Each reveals data in a unique way — from distributions to category insights. #Python #Seaborn #DataScience
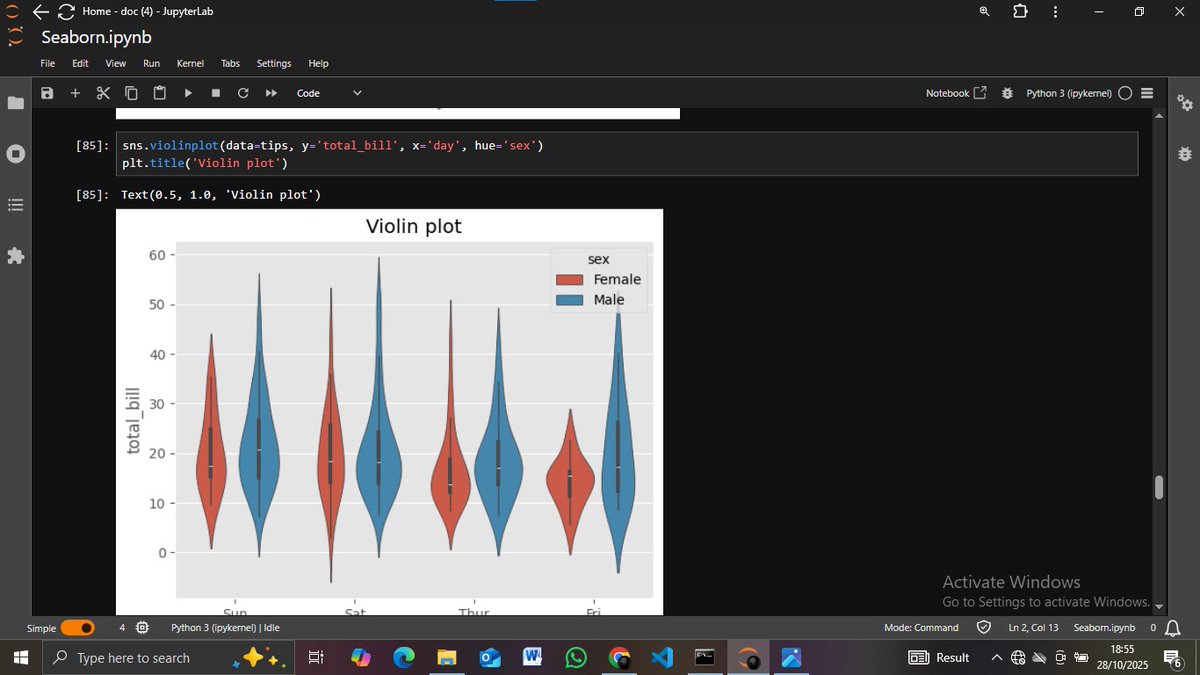


Day 2 of #100DaysOfData 📈 Practiced data visualization with a new dataset today Focus: barplot → category comparison boxplot → distribution & outliers countplot → frequency of categories Visualization is truly where data starts to make sense. #DataScience #Python #Seaborn


Day 2 of #100DaysOfData 📈 Practiced data visualization with a new dataset today Focus: barplot → category comparison boxplot → distribution & outliers countplot → frequency of categories Visualization is truly where data starts to make sense. #DataScience #Python #Seaborn
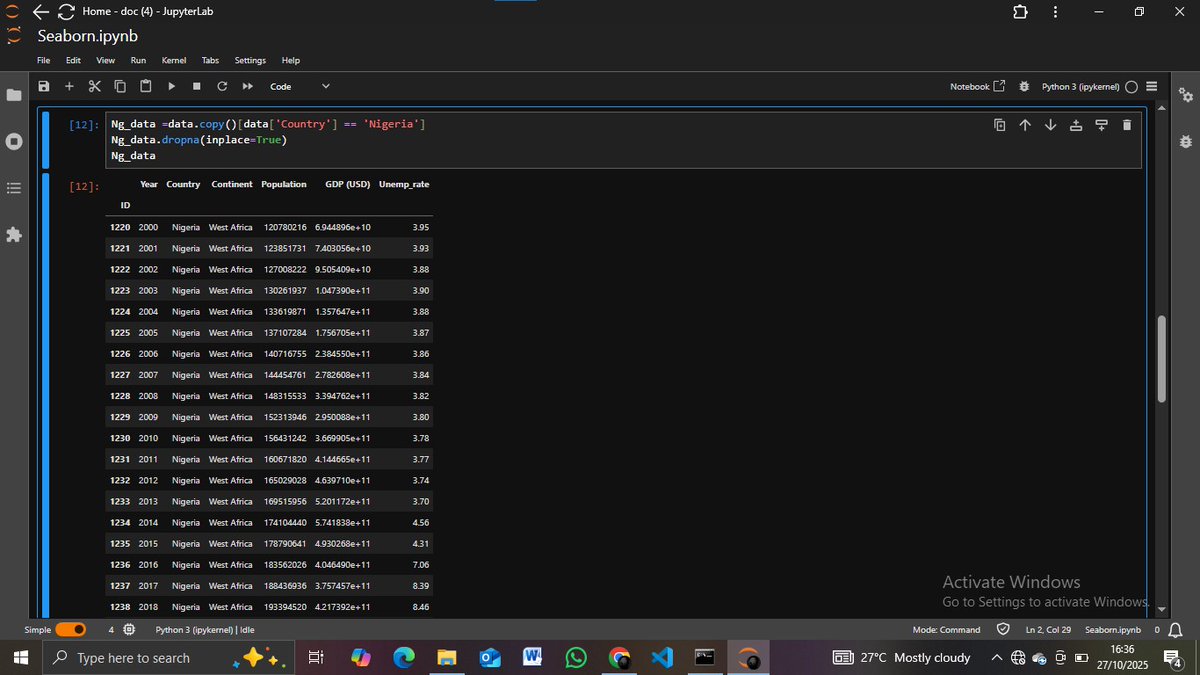
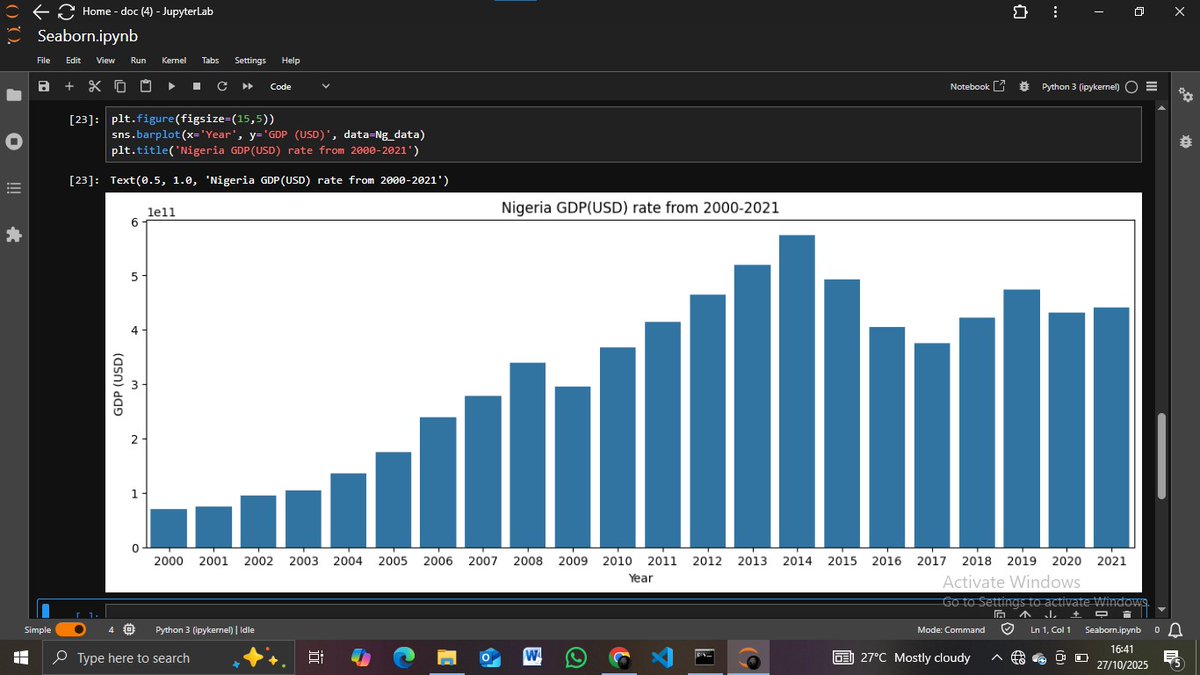
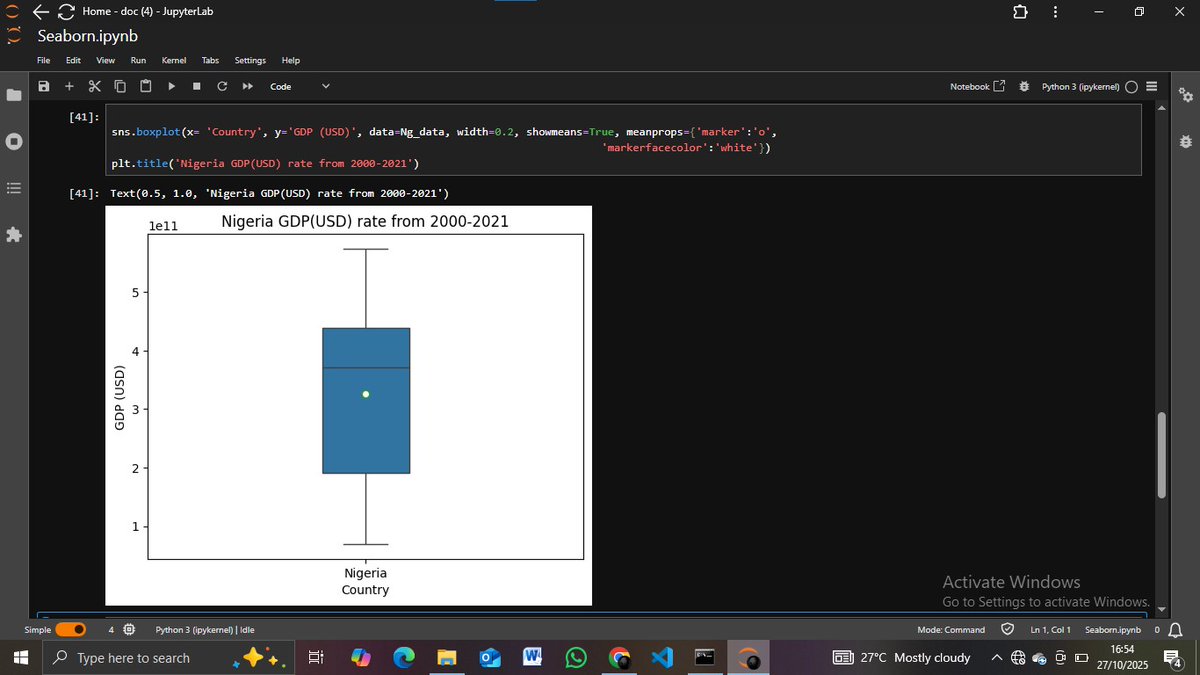
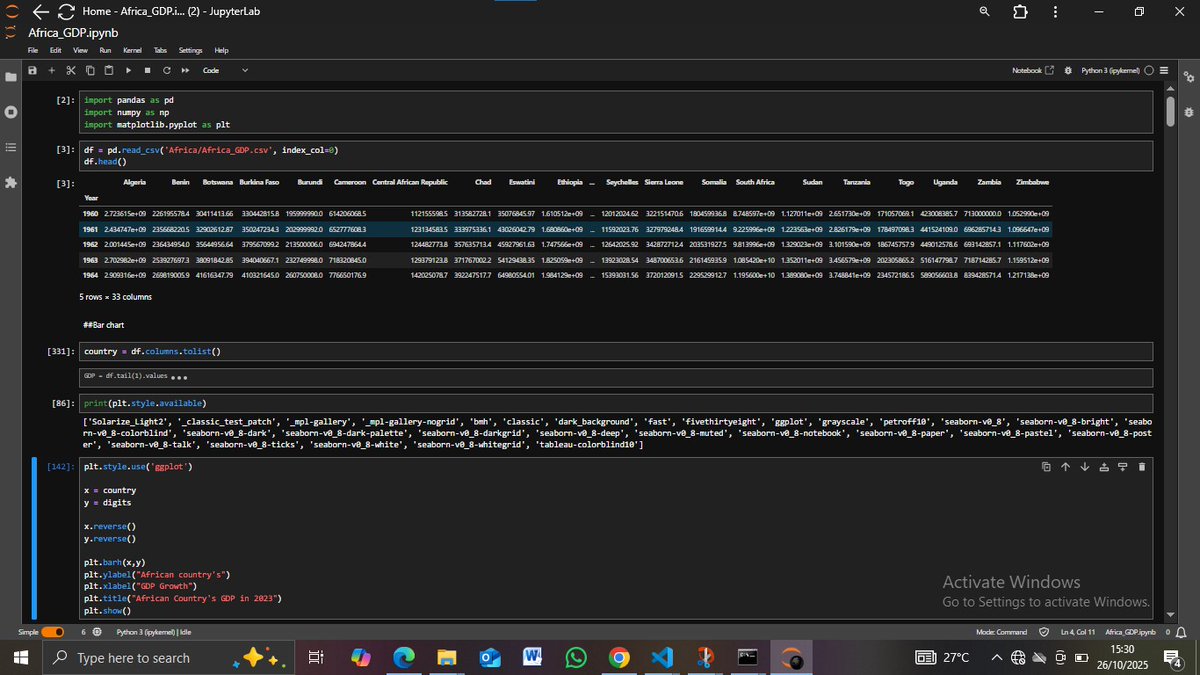
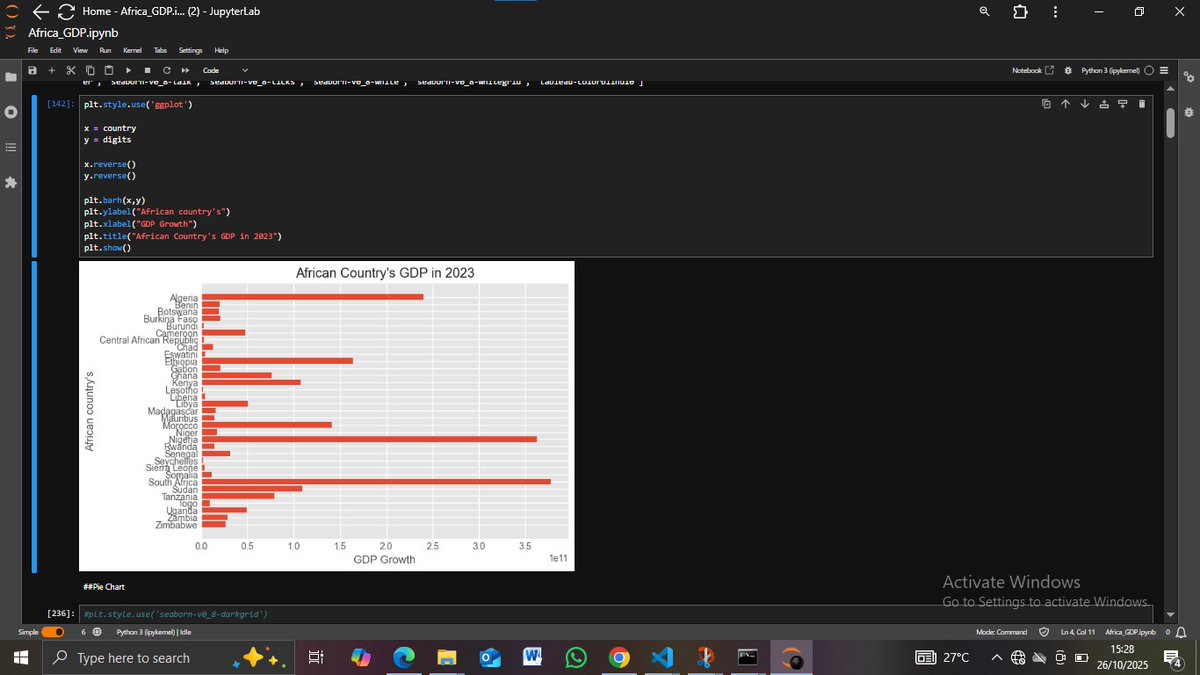
Today I explored Seaborn for data visualization Used barplot and boxplot to visualize Nigeria’s GDP growth (2000–2021) Amazing how these plots reveal both trends and value distribution. 📊 barplot -shows GDP changes over the years 📦 boxplot -reveals the overall distribution
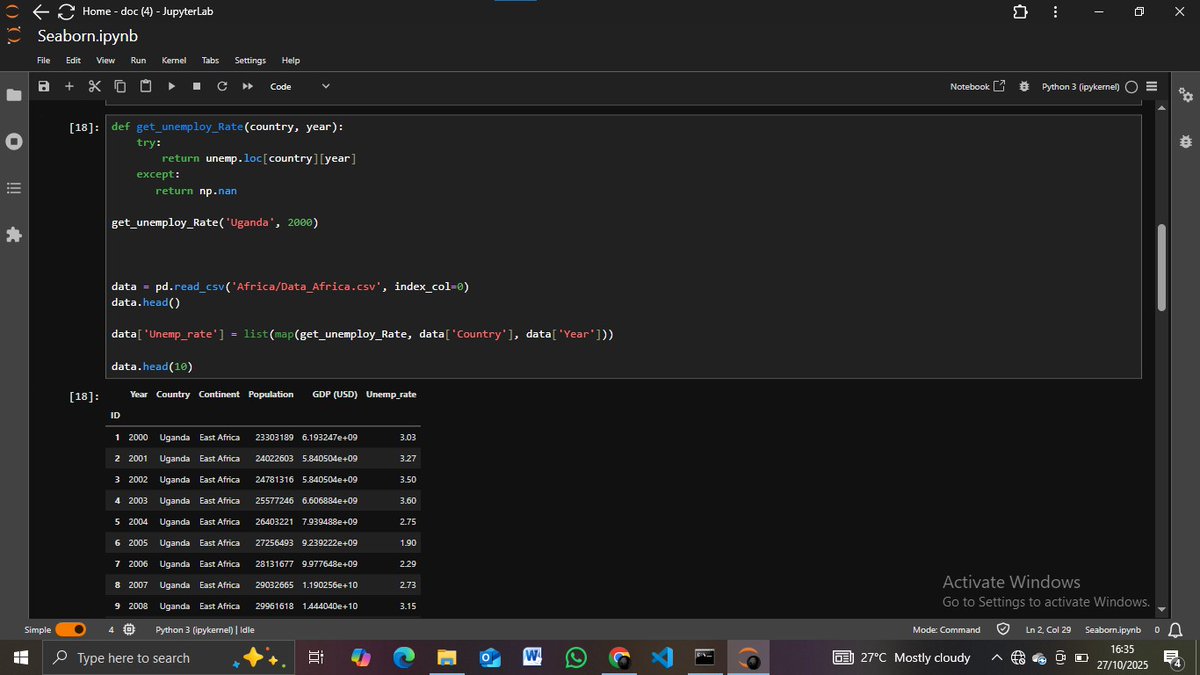
I’ve been learning AI & ML quietly for a while now I’m starting to document my journey publicly Here’s what I’ve covered so far 👇 🐍 Python fundamentals 🔢 NumPy 🐼 Pandas 📊 Matplotlib 🎨 Seaborn (current phase) Next -> ML🤖 #100DaysOfData #AIJourney #DataScience #Python

Spent the week setting up my first ETL project Python + pandas for transformation, Postgres in Docker, all running on a GCP VM Felt so good seeing the data flow end to end! #DataEngineering #100DaysOfData


Day 17: 100 days of Data Analytics POWERBI DASHBOARD This is an interactive dashboard created on POWERBI with SQL Queries #100daysofData #DataAnalytics

DAY 20 of #100daysofdata Finally hosted my portfolio on GitHub pages after some minor challenges. Thankfully, my perfectionist side didn't take over so yeah, I don't think it's good enough yet. Will work on brushing it up in the coming weeks, months and years.
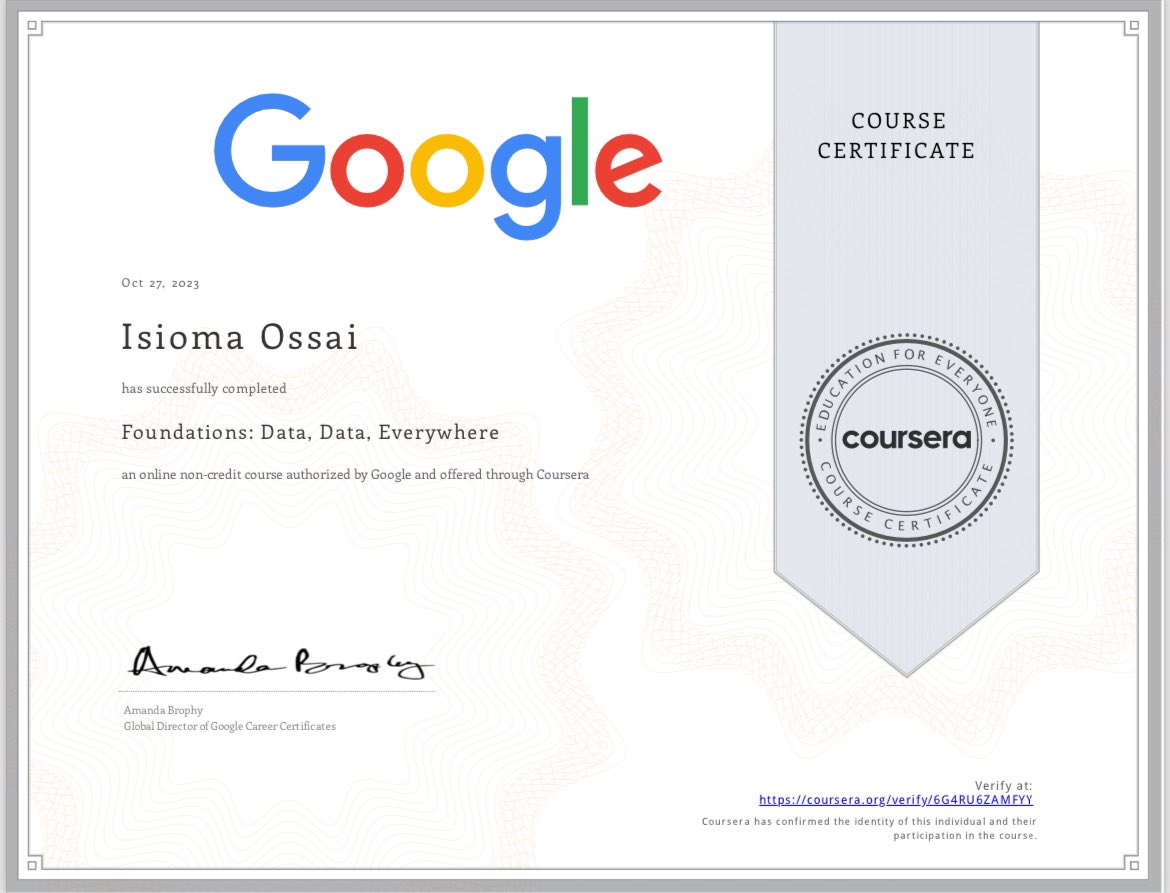
Day 12: 100 days of Data Analytics I completed Google’s Foundations: Data, Data, Everywhere! Course on Coursera #100daysofdata #DataAnalytics 1/8
Día 100 del reto #100DaysOfData: Hoy terminé la ruta de SQL Fundamentals, aprendiendo sobre RPAD, LPAD, TSVECTOR, TS_QUERY, User Defined Functions, SUBSTR, POSITIONS, ARRAY y Custom Data Types. ¡Gracias a todos por ser parte de este emocionante viaje! 🙏🏻💙#DataJourney
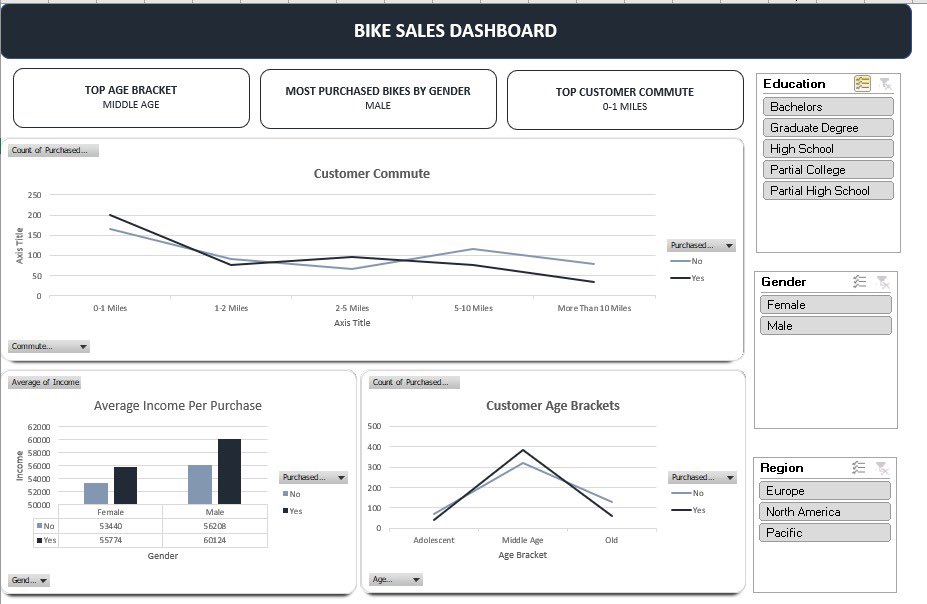
Day 15: 100 days of Data Analytics Dashboard | Excel Process: Data Cleaning, Pivot Table/ Charts, Dashboard creation #100daysofData #DataAnalytics
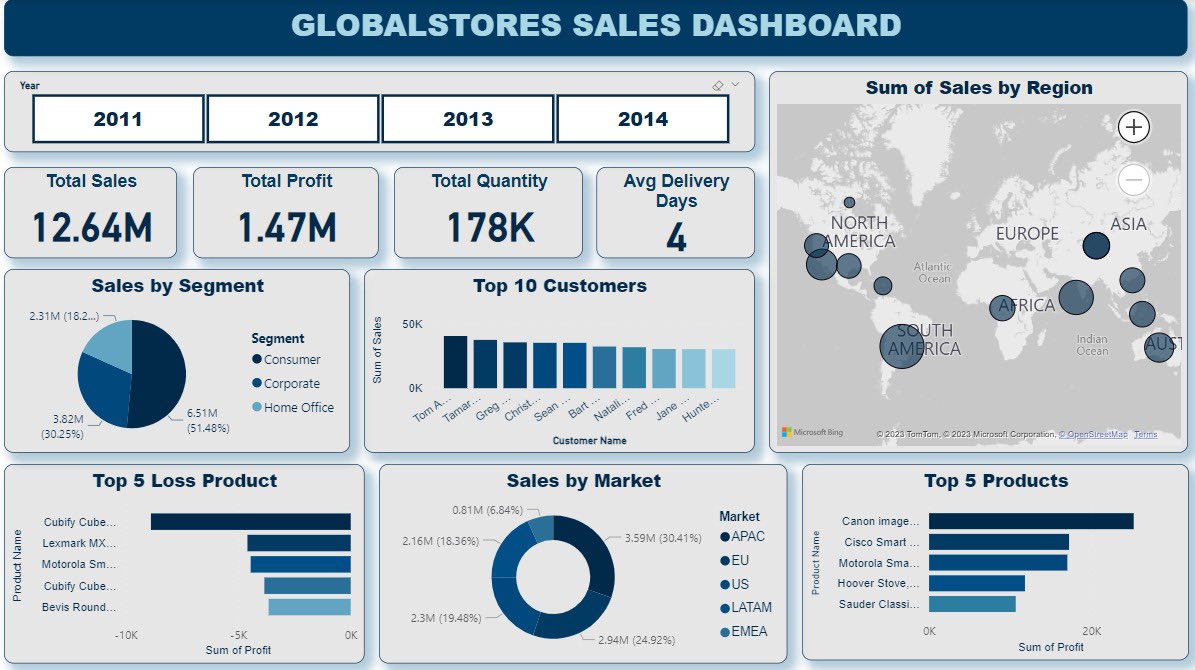
Day 21: 100 days of Data Analytics PowerBI I used PowerQuery tool on Microsoft PowerBI to clean data and I created an interactive dashboard with PowerBI #100daysofdata #dataanalytics
🚀Day 6 of #100daysofdata I learned how to do the following on Tableau: 1. Import files 2. Use the result from querying the server for visualization 2. Carry out predictive analysis 3. Create dashboards (my dashboard needs extra work though😀 ) #100daysofcode #100daysofdata


#Day54 of #100DaysofData I hated frontend because of UI and my color blind ass but seems there's no safer place so we got to love visualization for now
Day 19 of #100daysofdata Took a break to work on my portfolio. Currently creating a portfolio using GitHub pages and visual studio code. I'm hoping the perfectionist in me doesn't spend too much time trying to put out a perfect portfolio. #100daysofcode #100daysofdata
Día 95 del reto #100DaysOfData: Ayer terminé de estudiar muy tarde, ¡por eso no tuiteé! 😅 Pero valió la pena, porque estudie sobre suavización exponencial simple para pronósticos de demanda. 📈 Además, descubrí el gráfico de bala 🎯 para comparar medidas con objetivos.
¡Día 92 del reto #100DaysOfData completado! Hoy me dediqué a aprender sobre sets, columnas combinadas y agregación de atributos en #Tableau 💙💪🏻 #DataScience

Something went wrong.
Something went wrong.
United States Trends
- 1. TOP CALL 3,627 posts
- 2. #BaddiesUSA 64.8K posts
- 3. #centralwOrldXmasXFreenBecky 483K posts
- 4. SAROCHA REBECCA DISNEY AT CTW 502K posts
- 5. AI Alert 1,296 posts
- 6. #LingOrmDiorAmbassador 258K posts
- 7. Good Monday 24.6K posts
- 8. Rams 29.9K posts
- 9. Market Focus 2,450 posts
- 10. #LAShortnSweet 23.7K posts
- 11. Check Analyze N/A
- 12. Token Signal 1,729 posts
- 13. Vin Diesel 1,540 posts
- 14. #MondayMotivation 6,784 posts
- 15. Scotty 10.3K posts
- 16. Chip Kelly 9,080 posts
- 17. Ahna 7,800 posts
- 18. Raiders 68K posts
- 19. DOGE 177K posts
- 20. sabrina 64.6K posts