#100daysofdataanalysis ผลการค้นหา

Day 15 of Data Analysis Challenge. Learning doesn't stop because there isn't laptop to practice. Keep the momentum high #kehindeadekola #100daysofdataanalysis


I’ll be starting 100 days of consistency challenge for Data Analytics, and I’d like to create a circle of 10 people who is interested in learning Data Analysis.If you’re struggling to learn alone or don’t know where to start - we can create a WhatsApp community to learn together.

It’s been two quiet days since my last #100DaysOfDataAnalysis update. I wasn’t feeling well and had to take a short break to rest and recover I’m feeling much better now and ready to get back into my learning today😝

Day 4✅ — just showing up and learning Data Analysis #100daysofdataanalysis Today’s assessment was about creating a Decision Maker to choose a job based on pay, job market, enjoyment, talent, and schooling. I enjoyed it because it felt personal


Day 5✅ — just showing up and learning Data Analysis #100daysofdataanalysis Today, I worked on a SALES REPORT and learnt Text to Columns, IF and SUMIF formulas, sorting, filtering, Pivot Tables, and pie charts. I spent more time learning than usual, but it was worth it


Day 2✅ — just showing up and learning Data Analysis #100daysofdataanalysis Continued from where I stopped in Excel~ yesterday’s payroll assignment. I learnt how and when to use the IF formula, and also explored relative vs. absolute cell referencing, which I applied in my work


Hi Hi #datafam Day2/100 of #100DaysOfDataAnalysis Learnt the difference between Data science and Data Analytics Key takeaway: Consistency matters
Day 8/100 – #100DaysOfDataAnalysis Today’s focus was on Excel auditing & printing essentials ✅Traced precedents & dependents to find formula links ✅Used error checking tools ✅Practiced page setup, margins & orientation ✅ Set print areas & explored page breaks

What is data cleaning? Encoding Categorical Variables: Convert categorical data into numerical format using techniques like one-hot encoding or label encoding is also in alignment with data cleaning. #100daysofdataanalysis #datacleaning2025 #pythonlearning #PYTHON


23days ago I started #100DaysOfDataAnalysis and I intended to publicly journal my learning journey here daily but while I've being doing the learning I've not been sharing my journey. So, I've decided to start this journey again!
Hi Hi #datafam Starting my #100DaysOfDataAnalysis today and will be completing my 100th day on my birthday🥰So cheers to 99days of consistency ahead. #datafam #DataAnalytics
Been busy with formulas and functions of data analysis, combine with work the stress no be here but hey who's counting. #100daysofdataanalysis #datacleaning2025 #pythonlearning #PYTHON

JOYEUSE SAINT-VALENTIN Chances of getting a task solved today is high, very high. #100daysofdataanalysis #datacleaning2025 #pythonlearning #PYTHON

A spreadsheet isn’t just rows and columns. It’s a storybook of: Sales trends Spending habits Growth signals Good analysts don’t just see numbers. They uncover stories in the data. #100DaysOfDataAnalysis #DataDriven


📅 Day 26 of #100DaysOfDataAnalysis Today, I worked with the ORDER BY clause in SQL It helps arrange query results based on one or more columns, either in ascending or descending order. It makes data easier to read and analyze #LearnSQL #DataAnalysis #100DaysChallenge #OrderBy

📅 Day 28 of #100DaysOfDataAnalysis ✨ Practiced the DISTINCT keyword in SQL to remove duplicates. 📊 Extracted the list of unique departments, got results as Dept 1, 2, 3. 🔑 Super handy for cleaning and simplifying data views. #SQL #DataAnalysis #DISTINCT #100DaysChallenge

Hi Hi #datafam Starting my #100DaysOfDataAnalysis today and will be completing my 100th day on my birthday🥰So cheers to 99days of consistency ahead. #datafam #DataAnalytics
Day 1✅ — just showing up and learning Data Analysis #100daysofdataanalysis Today I started off with the foundations: what Data Analysis is and the types. I’ll be focusing mostly on Descriptive and Diagnostic Analysis for now. Then, I moved on to an Excel tutorial on YouTube
DATA CLEANING Today, I received business files to clean. As a business analyst aiming to a business, option is elicitation. However, my data analysis mindset tells me to simply analyze, clean, and them back. #100daysofdataanalysis #datacleaning2025 #pythonlearning #PYTHON

— Understanding and selecting cell ranges. — Creating and using named ranges for easier navigation and formula management. — Writing and applying formulas effectively to perform calculations and automate tasks. #100daysofDataAnalysis #100daysofConsistency
unclean data is dangerous and could often cause misleading conclusions. 3. Last step process which is the ANALYZING/VISUALIZING OF DATA. After analyzing your data, you need to visualize the data to communicate with your stakeholders. #100daysofDataAnalysis #100datsofconsistency
Day 13/100 – #100DaysOfDataAnalysis Very busy day, but I still made time to practice some essential Excel functions I hadn’t used in a while like: • SUMIF • SUMIFS • COUNT • COUNTIF Slowly getting more comfortable applying these in real datasets.
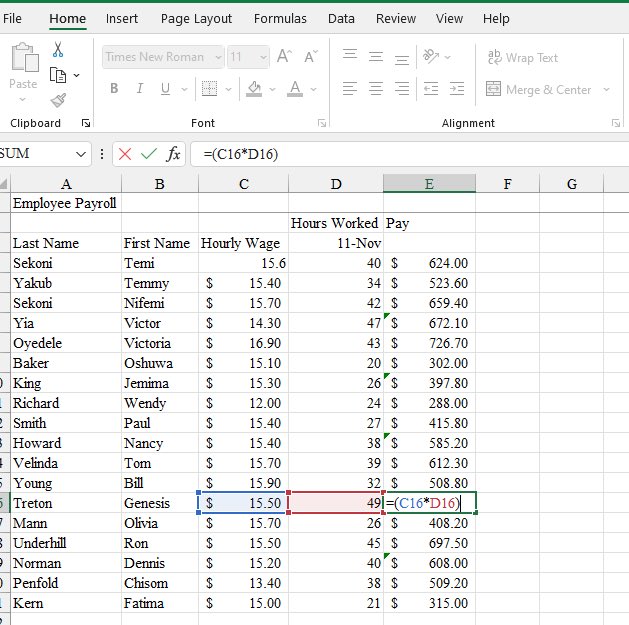
Finally, I learned how to calculate total pay and used the IF function to handle overtime pay. Everything came together nicely! Feeling proud of the progress I’m making on this journey If you have any tips on excel I would appreciate it 🙏🏾🫶🏽 #100DaysOfDataAnalysis #DataAnalysis
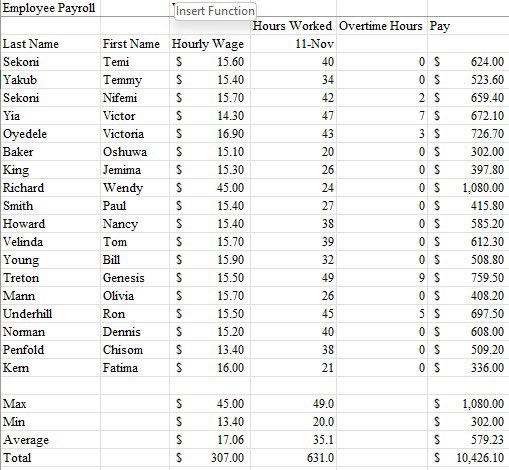
Day 12/100 - #100DaysOfDataAnalysis Today, I continued with my data analysis journey using Excel and followed a FreeCodeCamp tutorial. I worked on an employee payroll dataset, where I created and organized columns for First Name, Last Name, Hourly Wage, and Hours Worked. #Excel
It’s been two quiet days since my last #100DaysOfDataAnalysis update. I wasn’t feeling well and had to take a short break to rest and recover I’m feeling much better now and ready to get back into my learning today😝
I’ll be starting 100 days of consistency challenge for Data Analytics, and I’d like to create a circle of 10 people who is interested in learning Data Analysis.If you’re struggling to learn alone or don’t know where to start - we can create a WhatsApp community to learn together.
Day 9/100 – #100DaysOfDataAnalysis Didn’t do much today, but progress is progress! Watched a few YouTube tutorials & started the FreeCodeCamp course while staying consistent with my Coursera lessons. Balancing both to learn as much as I can
Day 8/100 – #100DaysOfDataAnalysis Today’s focus was on Excel auditing & printing essentials ✅Traced precedents & dependents to find formula links ✅Used error checking tools ✅Practiced page setup, margins & orientation ✅ Set print areas & explored page breaks

Day 21 #100DaysofDataAnalysis What if you have already collected the data? It could be in any format but what matters is data. Once the data is collected the next step is Data Preparation, that is - converting the data like unstructured data to structured data.
Day 20 #100DaysofDataAnalysis Data collection is the part where we try to understand what type of data to collect and from where to collect. Data Analysts directly go to teams to ask for access to databases; if not, they ask for a dump of data.
Day 19 #100DaysofDataAnalysis Once you are clear with business understanding, the next step is to try understanding the data. You are hired to add business value as a data analyst. Understanding data is very important because you need to know the various touchpoints in context.
Day 7/100 – #100DaysOfDataAnalysis Another productive Excel day Learned how to: Create custom filters Add comments & notes to worksheets Use the Watch Window to monitor cells Audit formulas with trace precedents & dependents Feeling more confident navigating data every day ☺️
Day 5/100 – #100DaysOfDataAnalysis Today was such a tiring day, but I still picked up my laptop to learn a little Focused on creating and customizing charts in Excel: creating charts easily Changing chart types, colors, and layouts Editing chart titles and formatting styles

Day 4/100 – #100DaysOfDataAnalysis Another free day = more Excel practice! Learned to work across multiple sheets, link workbooks, summarize data, group info, and even import data from other sources. Can’t wait to start small projects soon 👀 Any tips, Excel tricks? I’m all ears
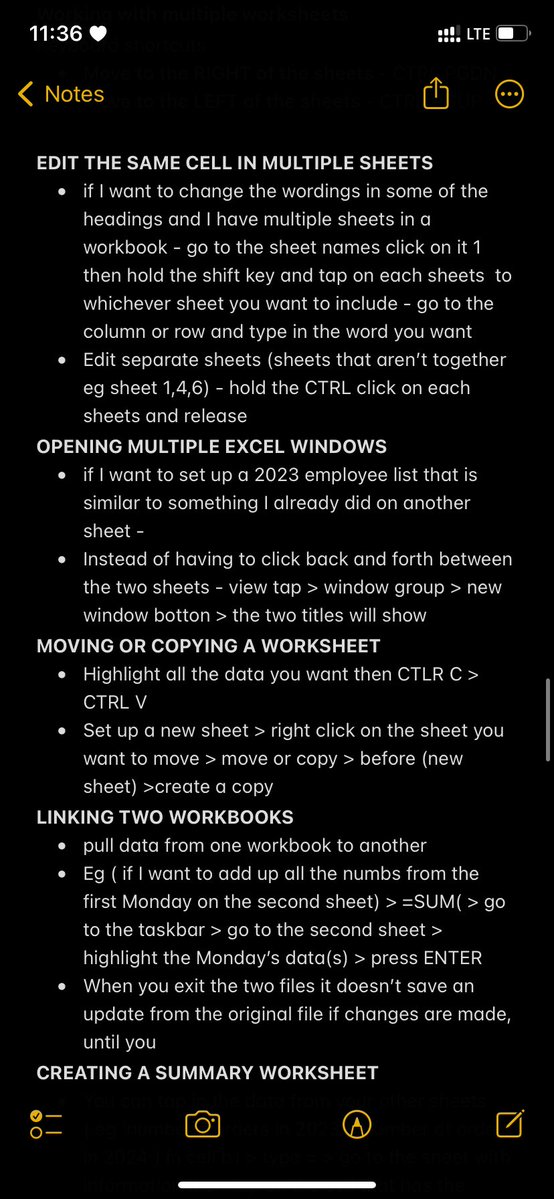

Day 3/100 – #100DaysOfDataAnalysis Had a free day, so I went deeper into Excel! Learned about: - Freezing rows & columns - Name & reordering worksheets - Linking workbooks - Working across multiple sheets - Handy keyboard shortcuts & time/date tricks - Feeling really fulfilled😊
Day 2/100 – #100DaysOfDataAnalysis Practiced some of Excel formulas & functions( SUM, AVERAGE, MAX, MIN, COUNT ) today and learned how to filter, format, sort, and create basic charts.
DAY 1/100 - #100DaysOfDataAnalysis Started with excel basics using coursera & YouTube tutorials. Learned about 1. Difference between workbook & worksheet 2. Rows, columns, & references 3. Name box, formula box, ribbons & groups 4. Entering, copying, and saving data
I’m officially starting my #100DaysOfDataAnalysis journey! I’ve been learning data analysis for a while, but I haven’t been consistent. So I’m setting this 100-day challenge to stay focused, learn every day, and track my progress here. This will be a thread 🧵👇
Day 7✅ — just showing up and learning Data Analysis #100daysofdataanalysis Just like I mentioned yesterday, I’m working on a car database where I had to download a car inventory text file online. That part actually took me a while, but I eventually found a good one.

Day 15 of Data Analysis Challenge. Learning doesn't stop because there isn't laptop to practice. Keep the momentum high #kehindeadekola #100daysofdataanalysis
Day 4/100 – #100DaysOfDataAnalysis Another free day = more Excel practice! Learned to work across multiple sheets, link workbooks, summarize data, group info, and even import data from other sources. Can’t wait to start small projects soon 👀 Any tips, Excel tricks? I’m all ears
Day 5/100 – #100DaysOfDataAnalysis Today was such a tiring day, but I still picked up my laptop to learn a little Focused on creating and customizing charts in Excel: creating charts easily Changing chart types, colors, and layouts Editing chart titles and formatting styles


#100DaysOfDataAnalysis SPSS done today. laptop nearly shame me but Mercy said No. Learnt Frequency distribution.

Finally, I learned how to calculate total pay and used the IF function to handle overtime pay. Everything came together nicely! Feeling proud of the progress I’m making on this journey If you have any tips on excel I would appreciate it 🙏🏾🫶🏽 #100DaysOfDataAnalysis #DataAnalysis

Day 15: Finesse SQL capstone project and an Excel project in pivot tables and charts. The dashboard for the excel file is the attached picture. #100DaysofDataAnalysis #100DaysOfCode #DataAnalytics #Excelsior #DataManagement #tecktwitter #WomeninTech #WomenInSTEM #WomenWhoCode


#100DaysOfDataAnalysis.. Started like Joke, But now everywhere Don choke!

If you see chance to learn SPSS, SQL and power BI to begin your data analysis journey for free.. Shey You go learn?


Day 4✅ — just showing up and learning Data Analysis #100daysofdataanalysis Today’s assessment was about creating a Decision Maker to choose a job based on pay, job market, enjoyment, talent, and schooling. I enjoyed it because it felt personal


Something went wrong.
Something went wrong.
United States Trends
- 1. #TT_Telegram_sam11adel N/A
- 2. #hazbinhotelseason2 40.9K posts
- 3. LeBron 83.6K posts
- 4. #DWTS 53.8K posts
- 5. #LakeShow 3,969 posts
- 6. Peggy 19.1K posts
- 7. Whitney 16.1K posts
- 8. Keyonte George 1,923 posts
- 9. Reaves 8,637 posts
- 10. Kwara 156K posts
- 11. Macklin Celebrini 2,603 posts
- 12. Grayson 7,088 posts
- 13. Jazz 27.6K posts
- 14. #TheFutureIsTeal 1,576 posts
- 15. Orioles 7,125 posts
- 16. Bedard 7,201 posts
- 17. DUSD N/A
- 18. Tatum 16.8K posts
- 19. Taylor Ward 3,620 posts
- 20. Rantanen 2,112 posts