#animateddata search results

📌 Day 5/90 – #90DaysOfEditMastery Animated bar graphs, circle charts & dot plots in After Effects 📊✨ Turning data into motion— not just numbers, but visual stories. Let’s connect if you love motion & design! #MotionDesign #AnimatedData #CreativeJourney

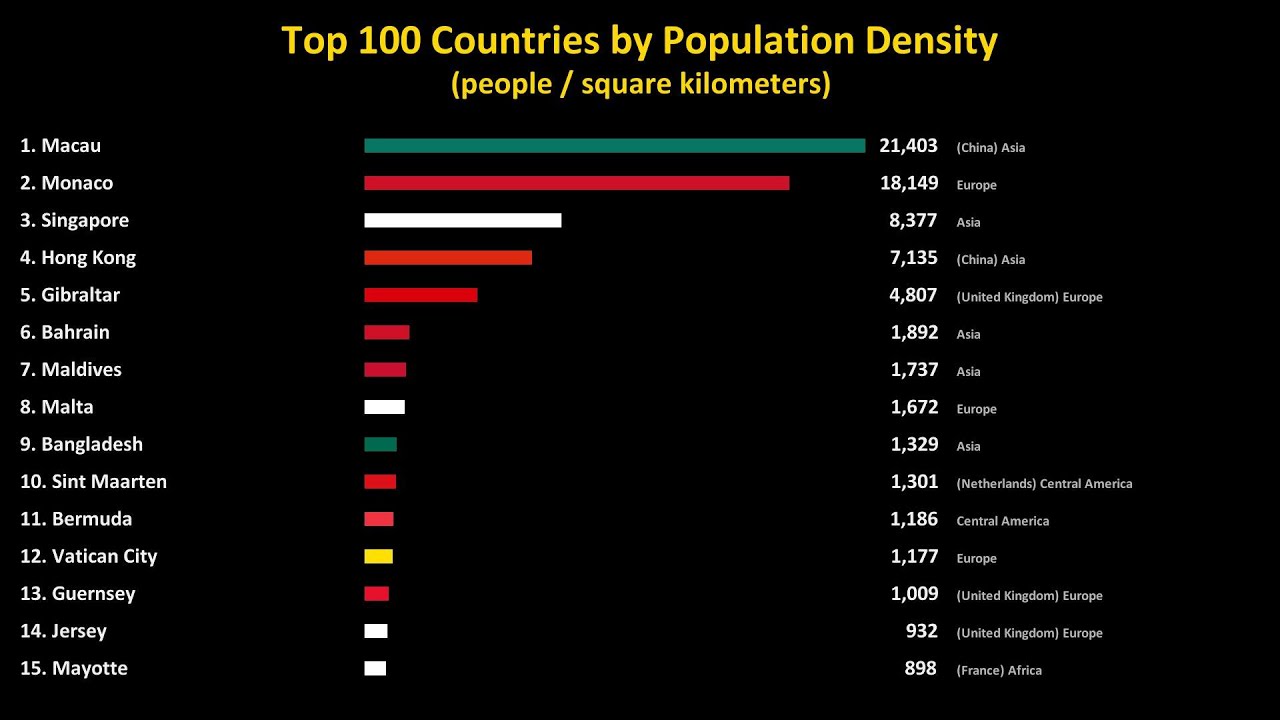
Top 100 Countries by Population Density youtu.be/B1QAg3EZ940?si… via @YouTube #CountryRankings #Demographics #AnimatedData #Top100Countries #DataVisualization #StatisticalAnimation #GlobalStats #WorldStatistics
youtube.com
YouTube
Top 100 Countries by Population Density

Very impressive #animateddata #infographic: utrend.tv/v/9-out-of-10-…

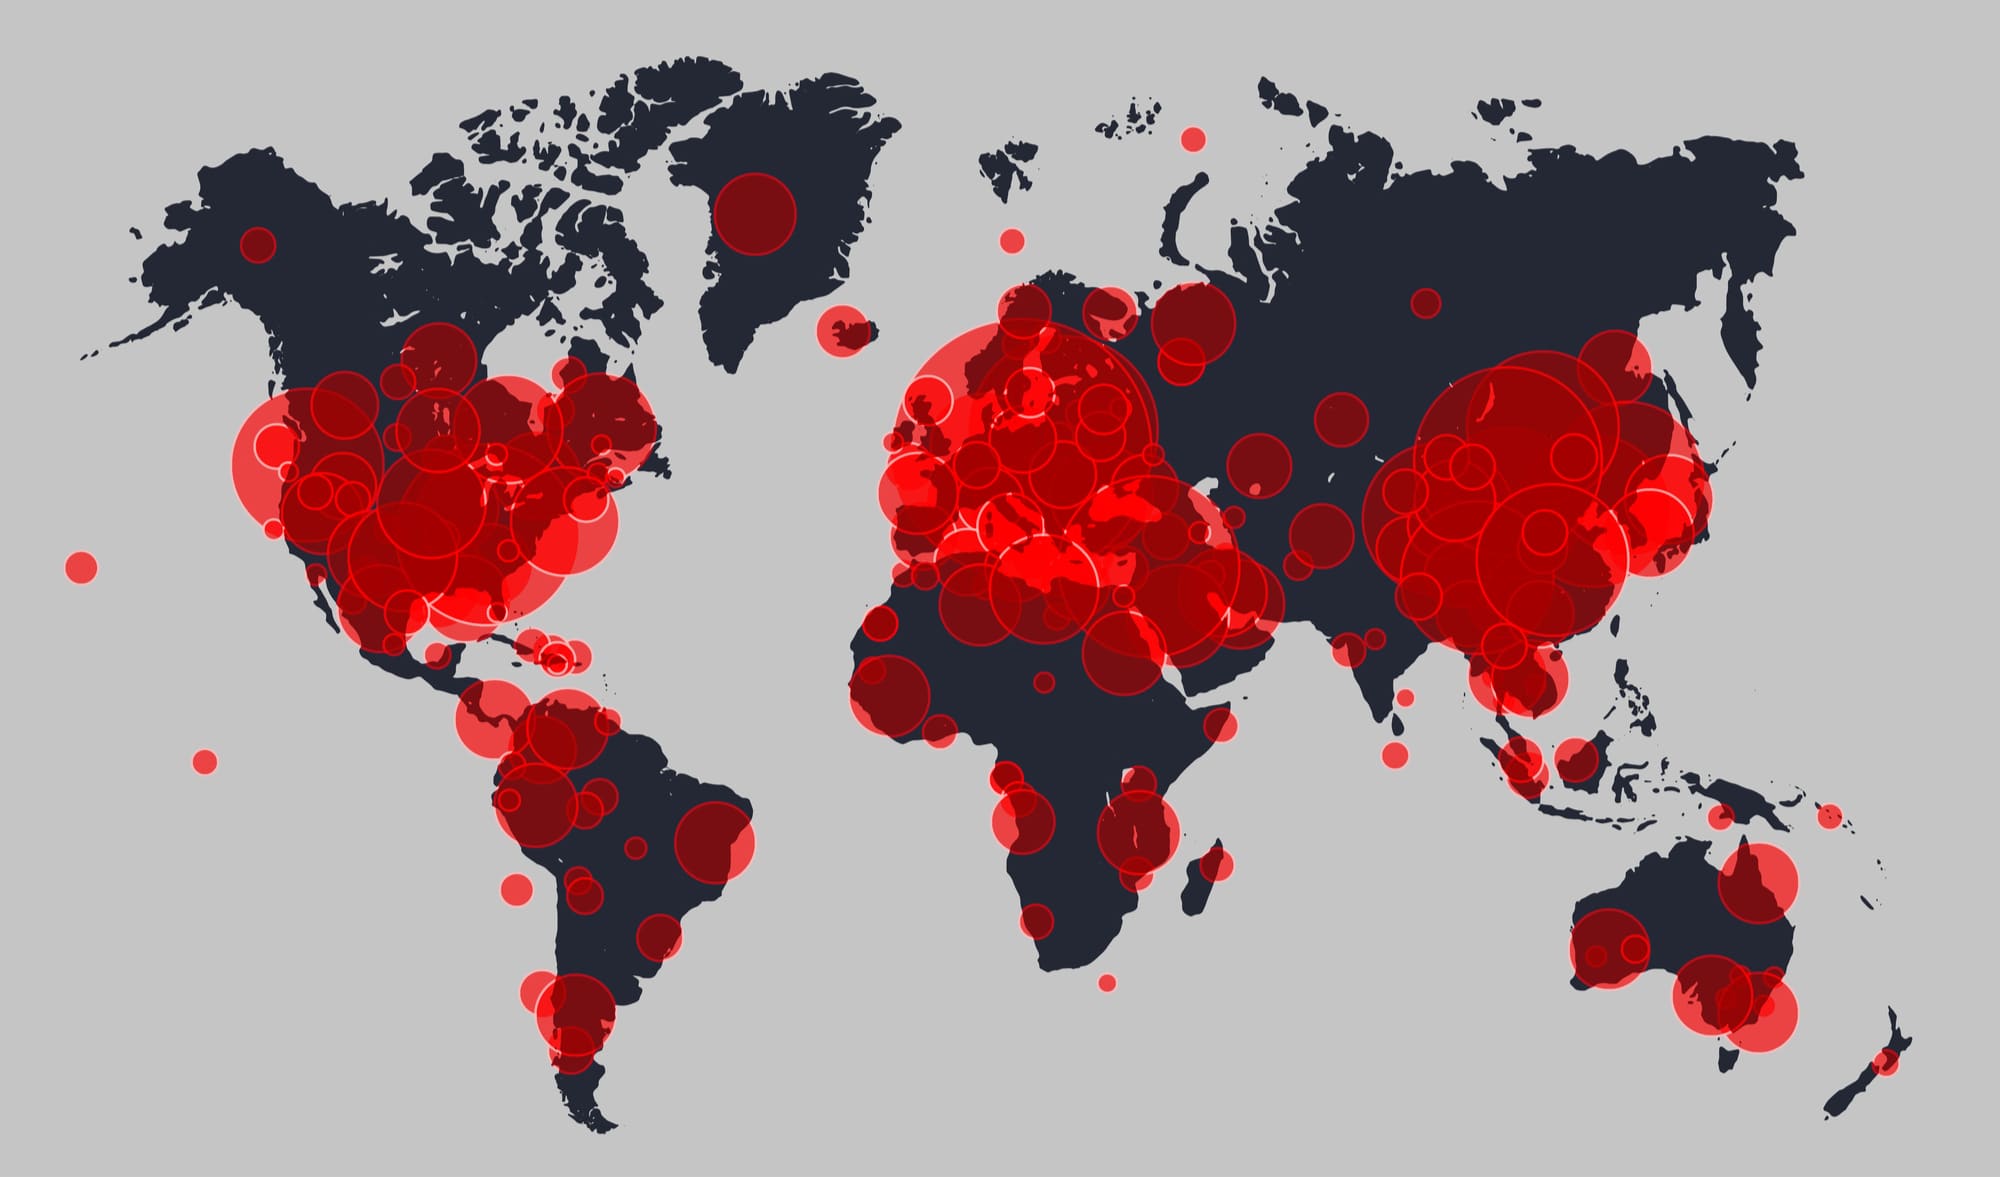
@gooddata - Data is no longer static. A "living" intel panel is powerful vessel for action in today's world. #AnimatedData #LiveMaps #action

For all you DataVis peeps, #animatedDATA comp.nus.edu.sg/~stevenha/visu…

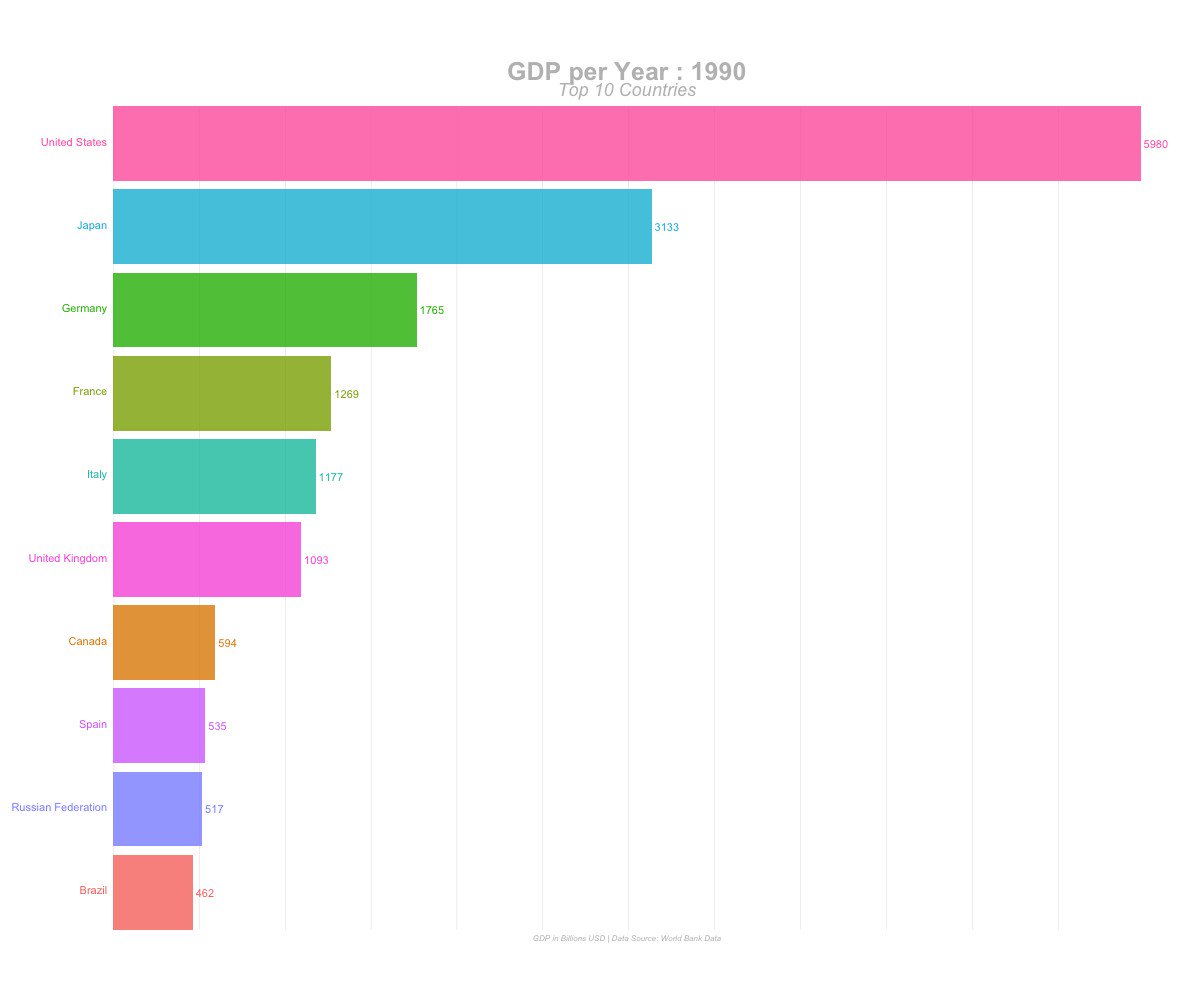
Data is king— but it can also be hard to figure out and visualize. Here's how to animate bar graphs to help bring life (and understanding) to your data: towardsdatascience.com/create-animate… #Data #AnimatedData #BarCharts #BarGraphs

This Animated Data Visualization Of World War II Fatalities Is Shocking bit.ly/1FKWkdw #animateddata
This puts war in a different perspective. Amazing to see this visually. WOW #AnimatedData fb.me/7qI71Yu2Q

Artículo super visual y con datos muy interesantes sobre la #pandemia Por favor miren la evolución de sus países!😔 #graficosanimados #animateddata blogs.iadb.org/ideas-que-cuen…

This Animated Data Visualization Of World War II Fatalities Is Shocking bit.ly/1FKWjWP #animateddata

A Visual Introduction to #MachineLearning ow.ly/WeOH305vH8D #DataVisualization #AnimatedData
This Animated Data Visualization Of World War II Fatalities Is Shocking bit.ly/1FKWiCu #animateddata

Infogram Introduces Enhanced Interactivity and Animated Data Storytelling sco.lt/8DqQSH #storytelling #animateddata #interactivity

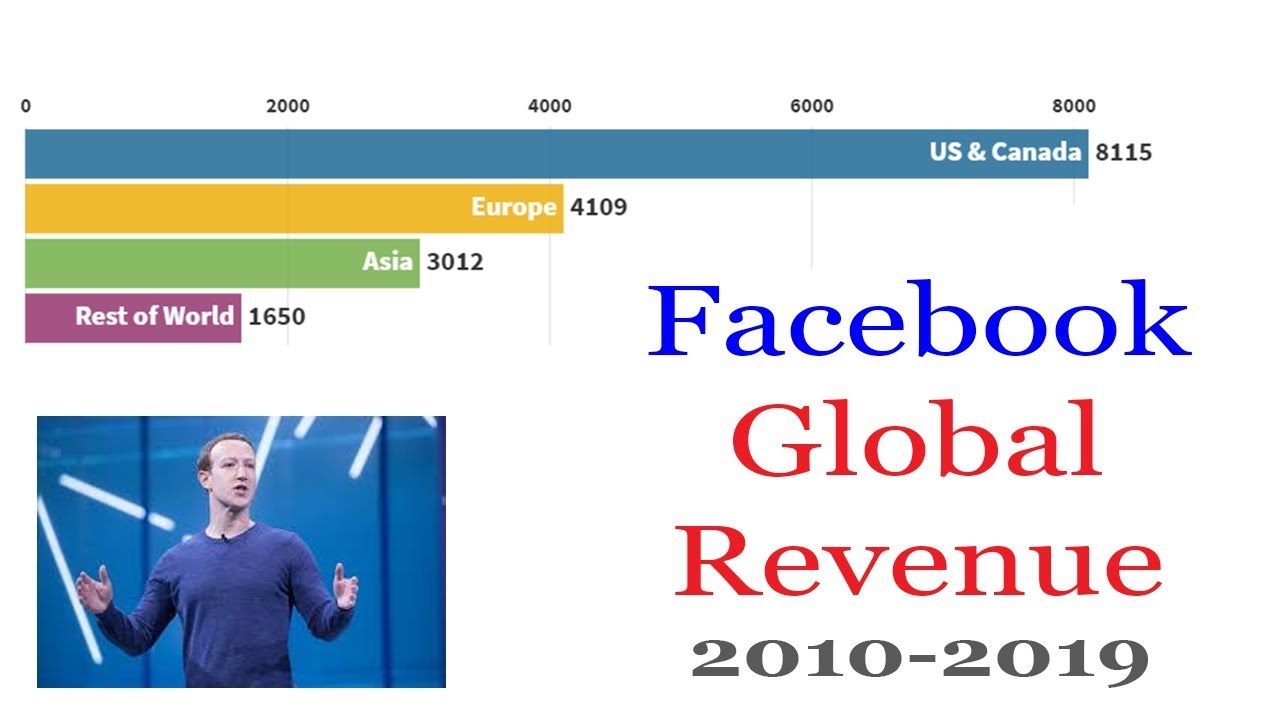
Facebook Global Revenue (2010-2019) | MUST WATCH!! youtu.be/u6E-_6XfN8A via @YouTube #Facebook #FacebookRevenue #AnimatedData
youtube.com
YouTube
Facebook Global Revenue (2010-2019) | MUST WATCH!!

This Animated Data Visualization Of World War II Fatalities Is Shocking bit.ly/1FKWmlD #animateddata

Changes in Africa's forest area over the past 30 years (Total & 15 anti-leader countries) youtube.com/watch?v=grexvY… #data #animateddata #statistics #nature #forest #conservenature #helptheplanet #naturelover #naturelovers #safeplanet #animatedstatistics
youtube.com
YouTube
Changes in Africa's forest area over the past 30 years (Total & 15...


Data is king— but it can also be hard to figure out and visualize. Here's how to animate bar graphs to help bring life (and understanding) to your data: towardsdatascience.com/create-animate… #Data #AnimatedData #BarCharts #BarGraphs
Something went wrong.
Something went wrong.
United States Trends
- 1. Chris Paul 15.5K posts
- 2. Clippers 24.5K posts
- 3. #SpotifyWrapped 13.7K posts
- 4. Good Wednesday 28.1K posts
- 5. #NSD26 4,553 posts
- 6. #WednesdayMotivation 3,258 posts
- 7. Happy Hump 6,193 posts
- 8. Hump Day 9,419 posts
- 9. FELIX LV VISIONARY SEOUL 25.7K posts
- 10. #FELIXxLouisVuitton 28.9K posts
- 11. National Signing Day 2,886 posts
- 12. TOP CALL 10.4K posts
- 13. Nashville 32.8K posts
- 14. Pat Spencer 2,878 posts
- 15. #PutThatInYourPipe N/A
- 16. The BIGGЕST 330K posts
- 17. jungkook 273K posts
- 18. Somalians 87.6K posts
- 19. Elden Campbell N/A
- 20. Somalis 103K posts