#controlcharts search results

20+ years of free SPC knowledge — always available when you need it. This article shows you how to quickly find the SPC tools, tips, and resources that matter most. spcforexcel.com/knowledge/misc… #SPC #ControlCharts #SixSigma #ProcessImprovement #QualityTools #SPCKnowledgeBase

Specs, averages, last year’s numbers—easy ways to cherry-pick data. But they don’t tell us what’s really happening in the process. 📊 Control charts do. Check it out: spcforexcel.com/knowledge/cont… #ControlCharts #SPC

Two people. Same data. Two totally different stories. Control charts can reveal what’s really happening with messy data—like crime in Washington, D.C. Full article: spcforexcel.com/knowledge/cont… #SPCforExcelSoftware #ControlCharts


In today’s business environment, making informed decisions is more critical than ever. Control charts empower organizations to visualize processes, identify variations, and drive continuous improvement. Without them, you’re navigating blind! #SPCforExcel #ControlCharts

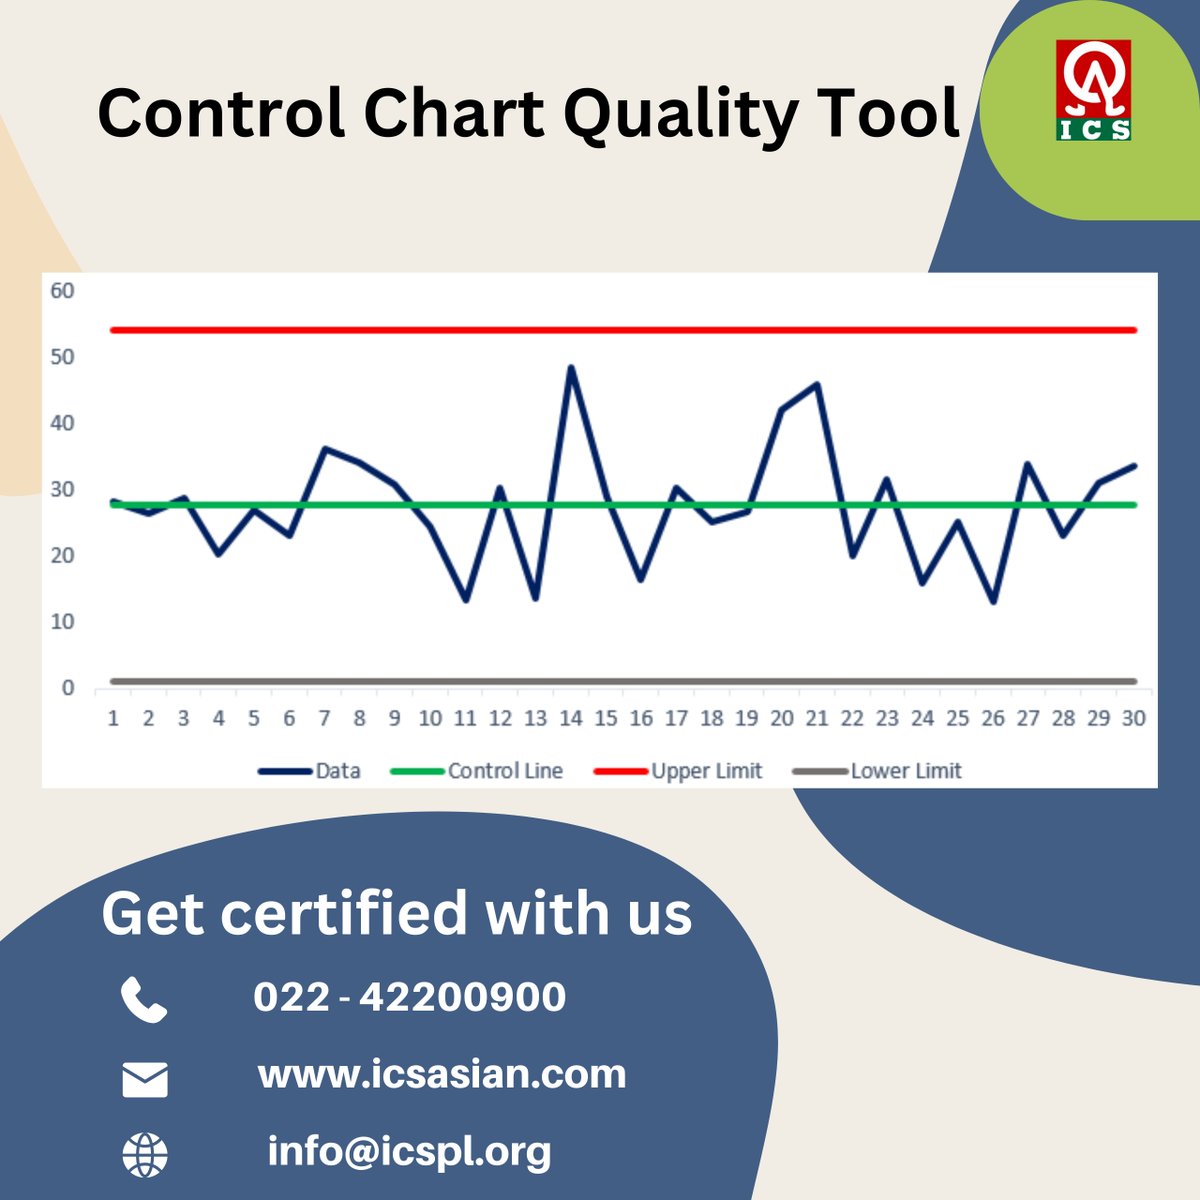
Control Charts can help with your quality control and improvement efforts. #ControlCharts #SPCforExcelSoftware #QualityControl #QualityImprovemnt
Take Control with easy-to-use Control Charts! See more: spcforexcel.com/spc-for-excel/… #ControlCharts
How much data do you really need to set control limits? 📊 Learn about sample size, degrees of freedom, and more in our new video here: youtu.be/09jyOGsiOfg #SPCforExcel #ControlCharts #QualityControl #SPC #DataAnalysis #StatisticalProcessControl #ControlLimits

Control charts are one of the pillars of SPC. Simple, yet such a powerful tool. Explore the power of Control Charts in SPC for Excel Software. Check out the video below: #ControlCharts #Lean #SixSigma #ProcessImprovement #SPCforExcel #Variation zurl.co/6FjQ


🔍 Selecting the right control chart for your transformed and normally distributed dataset is crucial! . . Feel free to share your experiences and thoughts on control charts below! Learn more about data analysis at anexas.net #ControlCharts #DataAnalysis #Quality
Your data collection is great! It records data every second into a database. How do you handle data when you have an abundance of it, and you want to use a control chart? Check it out here: spcforexcel.com/knowledge/cont… #DataOverload #ControlCharts

Control charts are key to keeping processes within limits, but how do control limits and specifications fit in? This article explains how they work and why they're essential for maintaining quality and consistency. See here: spcforexcel.com/knowledge/cont… #ControlCharts


This is a game-changer! Don’t miss out - register now: bit.ly/3x78MlV Friday 24th February at 15:00 #webinar #controlcharts #processperformance #free #registernow

Ready for a quick quiz? This one is from 7QC: Control Charts. How did you do? #quizshow #7QC #controlcharts thors.com/manufacturing-…
What do we have here? It's a What is it Wednesday! Take a look, can you name this? #whatisit #wednesday #controlcharts #7QC thors.com/manufacturing-…
Unlock the Power of Control Charts! Control charts are an essential tool for monitoring and improving processes in any industry. Using control charts effectively can lead to better decision-making and continuous improvement. Check it out: spcforexcel.com/control-chart-… #ControlCharts


Most quality issues aren’t random—they're predictable. Control Charts help you separate noise from real problems. Master this tool to cut defects, reduce costs, and boost consistency. Are you using Control Charts? kkbooks.com/mastering-proc… #kkbooks #controlcharts #twentytools

Individuals (X-mR) charts are powerful - when used right. Learn the 10 key things to know to avoid mistakes and sharpen your SPC skills. Look here: spcforexcel.com/knowledge/vari… #SPCforExcel #ControlCharts #SPC #QualityControl #SixSigma #ProcessImprovement

Was 2024 the hottest year since 1880? Find out what run charts and control charts tell us about the temperature changes over time. Read more: spcforexcel.com/knowledge/cont… #GlobalWarming #ControlCharts #TrendChart #GlobalTemperature #HottestYear

20+ years of free SPC knowledge — always available when you need it. This article shows you how to quickly find the SPC tools, tips, and resources that matter most. spcforexcel.com/knowledge/misc… #SPC #ControlCharts #SixSigma #ProcessImprovement #QualityTools #SPCKnowledgeBase
Specs, averages, last year’s numbers—easy ways to cherry-pick data. But they don’t tell us what’s really happening in the process. 📊 Control charts do. Check it out: spcforexcel.com/knowledge/cont… #ControlCharts #SPC
Two people. Same data. Two totally different stories. Control charts can reveal what’s really happening with messy data—like crime in Washington, D.C. Full article: spcforexcel.com/knowledge/cont… #SPCforExcelSoftware #ControlCharts
How much data do you really need to set control limits? 📊 Learn about sample size, degrees of freedom, and more in our new video here: youtu.be/09jyOGsiOfg #SPCforExcel #ControlCharts #QualityControl #SPC #DataAnalysis #StatisticalProcessControl #ControlLimits
Individuals (X-mR) charts are powerful - when used right. Learn the 10 key things to know to avoid mistakes and sharpen your SPC skills. Look here: spcforexcel.com/knowledge/vari… #SPCforExcel #ControlCharts #SPC #QualityControl #SixSigma #ProcessImprovement

New to improvement charts? Join our CoffeeTime QI #webinar this week! Learn more about the differences between #runcharts and #controlcharts, when you should use them and how to create them easily in Life QI. Register now! hubs.ly/Q03mcGf60 #QI #SPC

Most quality issues aren’t random—they're predictable. Control Charts help you separate noise from real problems. Master this tool to cut defects, reduce costs, and boost consistency. Are you using Control Charts? kkbooks.com/mastering-proc… #kkbooks #controlcharts #twentytools

Are you ignoring this critical SPC rule? 🛑 🎬 New video just dropped! youtu.be/nhz_eqOe89c Subscribe to our channel for more! #SPC #RuleofSeven #ControlCharts #QualityControl #SixSigma #LeanManufacturing #StatisticalProcessControl #ContinuousImprovement #Quality

youtube.com
YouTube
The Rule of Seven in Control Charts
Out of control points will occur on control charts. We are looking at how these outliers affect setting your baseline data. Do you include them in the calculations and chart the points? Check it out: spcforexcel.com/knowledge/cont… #DataAnalysis #ControlCharts #SPCforExcelSoftware
Was 2024 the hottest year since 1880? Find out what run charts and control charts tell us about the temperature changes over time. Read more: spcforexcel.com/knowledge/cont… #GlobalWarming #ControlCharts #TrendChart #GlobalTemperature #HottestYear
Control charts are key to keeping processes within limits, but how do control limits and specifications fit in? This article explains how they work and why they're essential for maintaining quality and consistency. See here: spcforexcel.com/knowledge/cont… #ControlCharts
Unlock the Power of Control Charts! Control charts are an essential tool for monitoring and improving processes in any industry. Using control charts effectively can lead to better decision-making and continuous improvement. Check it out: spcforexcel.com/control-chart-… #ControlCharts
In today’s business environment, making informed decisions is more critical than ever. Control charts empower organizations to visualize processes, identify variations, and drive continuous improvement. Without them, you’re navigating blind! #SPCforExcel #ControlCharts
Explore practical examples and make sure you know when and how to do hypothesis testing with the help of control charts. See more here: spcforexcel.com/knowledge/cont… #QualityManagement #ControlCharts #HypothesisTesting #ContinuousImprovement #DataDriven #SPC #ProcessExcellence

I have seen two comments recently attributed to Dr. Wheeler. I wondered if these were really so. So, I emailed Dr. Wheeler and asked him. This article contains his responses. Read more here! #ControlCharts #SPC #OutOfControlTests spcforexcel.com/knowledge/cont…

Monitoring Test Methods with Individuals Control Charts and Levey-Jennings Charts. Ensuring consistency and predictability of test methods are crucial. This popular publication dives in: spcforexcel.com/knowledge/meas… #LeveyJennings #ControlCharts #SPCforExcel #MeasurementSystem

Control Charts can help with your quality control and improvement efforts. #ControlCharts #SPCforExcelSoftware #QualityControl #QualityImprovemnt

Specs, averages, last year’s numbers—easy ways to cherry-pick data. But they don’t tell us what’s really happening in the process. 📊 Control charts do. Check it out: spcforexcel.com/knowledge/cont… #ControlCharts #SPC
Two people. Same data. Two totally different stories. Control charts can reveal what’s really happening with messy data—like crime in Washington, D.C. Full article: spcforexcel.com/knowledge/cont… #SPCforExcelSoftware #ControlCharts
In today’s business environment, making informed decisions is more critical than ever. Control charts empower organizations to visualize processes, identify variations, and drive continuous improvement. Without them, you’re navigating blind! #SPCforExcel #ControlCharts
20+ years of free SPC knowledge — always available when you need it. This article shows you how to quickly find the SPC tools, tips, and resources that matter most. spcforexcel.com/knowledge/misc… #SPC #ControlCharts #SixSigma #ProcessImprovement #QualityTools #SPCKnowledgeBase
Control Charts can help with your quality control and improvement efforts. #ControlCharts #SPCforExcelSoftware #QualityControl #QualityImprovemnt
Take Control with easy-to-use Control Charts! See more: spcforexcel.com/spc-for-excel/… #ControlCharts
Most quality issues aren’t random—they're predictable. Control Charts help you separate noise from real problems. Master this tool to cut defects, reduce costs, and boost consistency. Are you using Control Charts? kkbooks.com/mastering-proc… #kkbooks #controlcharts #twentytools
How can control charts be used even when there is data overload? Our latest publication examines how you best handle these situations, read along: spcforexcel.com/knowledge/cont… #DataOverload #ControlCharts

Your data collection is great! It records data every second into a database. How do you handle data when you have an abundance of it, and you want to use a control chart? Check it out here: spcforexcel.com/knowledge/cont… #DataOverload #ControlCharts
Control charts are one of the pillars of SPC. Simple, yet such a powerful tool. Explore the power of Control Charts in SPC for Excel Software. Check out the video below: #ControlCharts #Lean #SixSigma #ProcessImprovement #SPCforExcel #Variation zurl.co/6FjQ
How much data do you really need to set control limits? 📊 Learn about sample size, degrees of freedom, and more in our new video here: youtu.be/09jyOGsiOfg #SPCforExcel #ControlCharts #QualityControl #SPC #DataAnalysis #StatisticalProcessControl #ControlLimits
Control charts are key to keeping processes within limits, but how do control limits and specifications fit in? This article explains how they work and why they're essential for maintaining quality and consistency. See here: spcforexcel.com/knowledge/cont… #ControlCharts
Individuals (X-mR) charts are powerful - when used right. Learn the 10 key things to know to avoid mistakes and sharpen your SPC skills. Look here: spcforexcel.com/knowledge/vari… #SPCforExcel #ControlCharts #SPC #QualityControl #SixSigma #ProcessImprovement
Explore practical examples and make sure you know when and how to do hypothesis testing with the help of control charts. See more here: spcforexcel.com/knowledge/cont… #QualityManagement #ControlCharts #HypothesisTesting #ContinuousImprovement #DataDriven #SPC #ProcessExcellence
Was 2024 the hottest year since 1880? Find out what run charts and control charts tell us about the temperature changes over time. Read more: spcforexcel.com/knowledge/cont… #GlobalWarming #ControlCharts #TrendChart #GlobalTemperature #HottestYear
To understand when to adjust a process and when not to, you look for signals in the data. Control charts are at the heart of this approach. Learn more here: spcforexcel.com/knowledge/cont… #ControlCharts #StatisticalControl #AdjustingProcesses

I have seen two comments recently attributed to Dr. Wheeler. I wondered if these were really so. So, I emailed Dr. Wheeler and asked him. This article contains his responses. Read more here! #ControlCharts #SPC #OutOfControlTests spcforexcel.com/knowledge/cont…
Monitoring Test Methods with Individuals Control Charts and Levey-Jennings Charts. Ensuring consistency and predictability of test methods are crucial. This popular publication dives in: spcforexcel.com/knowledge/meas… #LeveyJennings #ControlCharts #SPCforExcel #MeasurementSystem
Out of control points will occur on control charts. We are looking at how these outliers affect setting your baseline data. Do you include them in the calculations and chart the points? Check it out: spcforexcel.com/knowledge/cont… #DataAnalysis #ControlCharts #SPCforExcelSoftware
Something went wrong.
Something went wrong.
United States Trends
- 1. Sunderland 130K posts
- 2. Penn State 9,835 posts
- 3. Gus Johnson N/A
- 4. Arsenal 223K posts
- 5. Mendoza 8,632 posts
- 6. Indiana 19.2K posts
- 7. Texas Tech 10.7K posts
- 8. St. John 7,176 posts
- 9. Jeremiah Smith 2,058 posts
- 10. #iufb 1,737 posts
- 11. #SUNARS 12.9K posts
- 12. Philon 1,675 posts
- 13. Julian Sayin 1,025 posts
- 14. Raya 25.6K posts
- 15. Happy Valley N/A
- 16. #GoDawgs 3,922 posts
- 17. Nick Singleton N/A
- 18. Trossard 19.9K posts
- 19. Carnell Tate N/A
- 20. Charlie Becker N/A