#spcforexcelsoftware search results

Two people. Same data. Two totally different stories. Control charts can reveal what’s really happening with messy data—like crime in Washington, D.C. Full article: spcforexcel.com/knowledge/cont… #SPCforExcelSoftware #ControlCharts

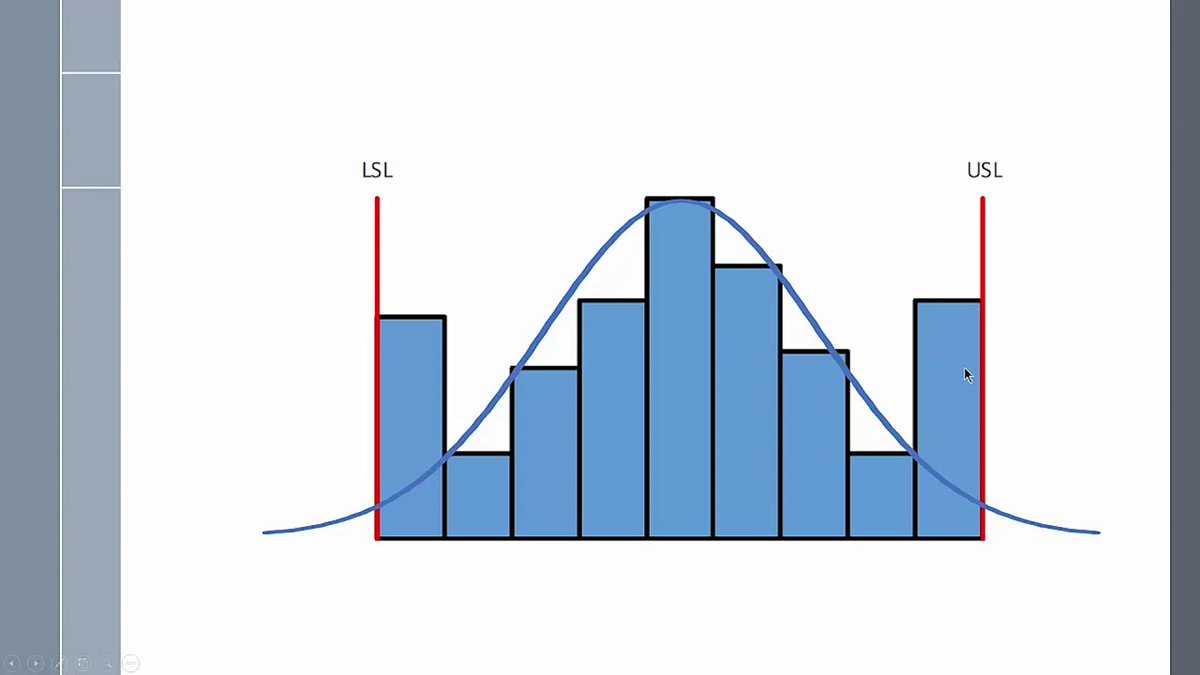
Histograms do more than display data—they reveal the story of a process. Watch this short intro + 5 supplier examples: youtu.be/XUeU4tvkXAo #SPCforExcelSoftware #Histograms
Old vs. new. Yours vs. supplier’s. How do you know if two measurement systems agree? The Bland-Altman plot shows both the average difference and the variation in one chart. 👉 spcforexcel.com/knowledge/meas… #SPCforExcelSoftware #GageRR #MeasurementSystems

ANOVA shows you which factors matter. A variability chart shows you how to use them. Curious? Check out this explainer on ANOVA & variability charts: spcforexcel.com/knowledge/root… #SPCforExcelSoftware #ANOVA #Quality

No doubt winter is here in the northern hemisphere —just like the need for accurate data and strong process control. As the temperatures drop, make sure your analysis doesn't freeze. With SPC for Excel, you can keep your processes and data analysis in check. #SPCforExcelSoftware

Data isn’t just a collection of numbers—it's what drives better decisions, more informed insights, and meaningful improvements. #SPCforExcel #SPCforExcelSoftware #Infomed Decisions #QualityImprovemnts #Statistical Analysis
A great reminder that every setback is an opportunity for growth. In quality control and beyond, learning from failure paves the way to success. Keep learning, keep improving! #QualityControl #ProcessImprovement #SPCForExcelSoftware

This powerful reminder underscores the real cost of defects. Quality control and continuous improvement are essential to reduce errors and ensure efficiency. A mindset that values defect prevention over correction. #QualityManagement #ProcessImprovement #SPCForExcelSoftware

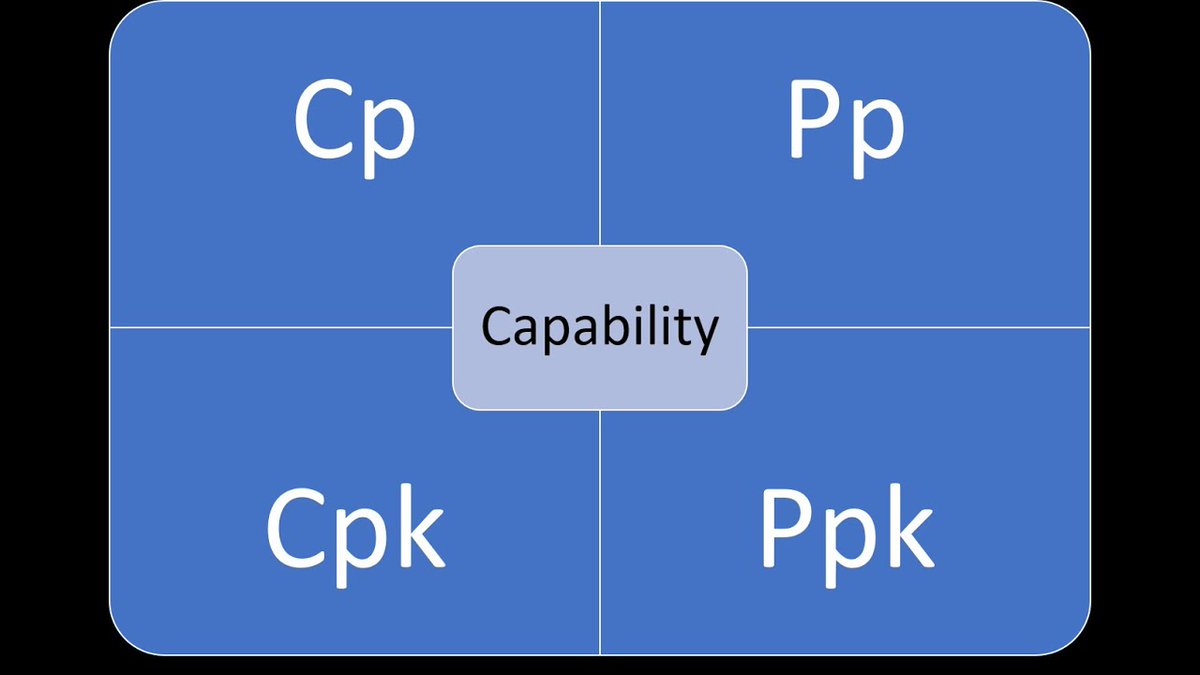
In this video, we break down how to calculate and understand Pp, Cp, Ppk, and Cpk. Check it out and gain deeper insights into improving your processes! youtu.be/CbGxyD0TlNc #ProcessCapability #PerformanceMetrics #SPCforExcelSoftware
Understand your processes on your journey to sustainable success with SPC for Excel software's powerful visual charting and analysis. See how you can get the latest SPC for Excel Version 7 here: spcforexcel.com/catalog/ #SPCforExcelSoftware #ProcessImprovement

🔢 Math Quiz Time! 🔢 Look at the sequence on the blocks: 4, 8, 10, 20, 22, 44, ?? 👉 What number comes next? Drop your answer in the comments ⬇️ — no calculators, just brainpower! #MathQuiz #ProblemSolving #SPCforExcelSoftware

How do you make sure you are set up for success? One way is to ensure that your processes are capable of meeting customer specifications! See how SPC for Excel Software can help you: spcforexcel.com/spc-for-excel/… #ProcessCapability #SPCforExcelSoftware #CustomerSpecifications

Control charts are vital for monitoring data and identifying special cause of variation. Understanding this supports informed decision-making and continuous improvement. See more here: spcforexcel.com/knowledge/cont… #DataAnalysis #ControlChartst #SPCforExcelSoftware #TrendingData

Out of control points will occur on control charts. We are looking at how these outliers affect setting your baseline data. Do you include them in the calculations and chart the points? Check it out: spcforexcel.com/knowledge/cont… #DataAnalysis #ControlCharts #SPCforExcelSoftware
Happy 4th of July to our U.S. friends — and a great weekend to all! Thanks for trusting SPC for Excel as your go-to for quality & SPC guidance. spcforexcel.com #SPCforExcelSoftware #4thofJuly #SPC #Quality #ProcessImprovement

Comparing the proportions in two populations – with binary outcome. This popular article shows you how to do it — and why it matters. Check it out: spcforexcel.com/knowledge/comp… #ComparingTwoProportions #SPCforExcelSoftware #SPCTips #DataAnalysis #SixSigma

Old vs. new. Yours vs. supplier’s. How do you know if two measurement systems agree? The Bland-Altman plot shows both the average difference and the variation in one chart. 👉 spcforexcel.com/knowledge/meas… #SPCforExcelSoftware #GageRR #MeasurementSystems
🔢 Math Quiz Time! 🔢 Look at the sequence on the blocks: 4, 8, 10, 20, 22, 44, ?? 👉 What number comes next? Drop your answer in the comments ⬇️ — no calculators, just brainpower! #MathQuiz #ProblemSolving #SPCforExcelSoftware
Histograms do more than display data—they reveal the story of a process. Watch this short intro + 5 supplier examples: youtu.be/XUeU4tvkXAo #SPCforExcelSoftware #Histograms
ANOVA shows you which factors matter. A variability chart shows you how to use them. Curious? Check out this explainer on ANOVA & variability charts: spcforexcel.com/knowledge/root… #SPCforExcelSoftware #ANOVA #Quality
Two people. Same data. Two totally different stories. Control charts can reveal what’s really happening with messy data—like crime in Washington, D.C. Full article: spcforexcel.com/knowledge/cont… #SPCforExcelSoftware #ControlCharts
Comparing the proportions in two populations – with binary outcome. This popular article shows you how to do it — and why it matters. Check it out: spcforexcel.com/knowledge/comp… #ComparingTwoProportions #SPCforExcelSoftware #SPCTips #DataAnalysis #SixSigma
Happy 4th of July to our U.S. friends — and a great weekend to all! Thanks for trusting SPC for Excel as your go-to for quality & SPC guidance. spcforexcel.com #SPCforExcelSoftware #4thofJuly #SPC #Quality #ProcessImprovement
This powerful reminder underscores the real cost of defects. Quality control and continuous improvement are essential to reduce errors and ensure efficiency. A mindset that values defect prevention over correction. #QualityManagement #ProcessImprovement #SPCForExcelSoftware
A great reminder that every setback is an opportunity for growth. In quality control and beyond, learning from failure paves the way to success. Keep learning, keep improving! #QualityControl #ProcessImprovement #SPCForExcelSoftware
In this video, we break down how to calculate and understand Pp, Cp, Ppk, and Cpk. Check it out and gain deeper insights into improving your processes! youtu.be/CbGxyD0TlNc #ProcessCapability #PerformanceMetrics #SPCforExcelSoftware
No doubt winter is here in the northern hemisphere —just like the need for accurate data and strong process control. As the temperatures drop, make sure your analysis doesn't freeze. With SPC for Excel, you can keep your processes and data analysis in check. #SPCforExcelSoftware
Out of control points will occur on control charts. We are looking at how these outliers affect setting your baseline data. Do you include them in the calculations and chart the points? Check it out: spcforexcel.com/knowledge/cont… #DataAnalysis #ControlCharts #SPCforExcelSoftware
Data isn’t just a collection of numbers—it's what drives better decisions, more informed insights, and meaningful improvements. #SPCforExcel #SPCforExcelSoftware #Infomed Decisions #QualityImprovemnts #Statistical Analysis
Control charts are vital for monitoring data and identifying special cause of variation. Understanding this supports informed decision-making and continuous improvement. See more here: spcforexcel.com/knowledge/cont… #DataAnalysis #ControlChartst #SPCforExcelSoftware #TrendingData
Understand your processes on your journey to sustainable success with SPC for Excel software's powerful visual charting and analysis. See how you can get the latest SPC for Excel Version 7 here: spcforexcel.com/catalog/ #SPCforExcelSoftware #ProcessImprovement
How do you make sure you are set up for success? One way is to ensure that your processes are capable of meeting customer specifications! See how SPC for Excel Software can help you: spcforexcel.com/spc-for-excel/… #ProcessCapability #SPCforExcelSoftware #CustomerSpecifications
Control Charts can help with your quality control and improvement efforts. #ControlCharts #SPCforExcelSoftware #QualityControl #QualityImprovemnt
Wishing all our friends and colleagues in the US a great 4th of July celebration! Thank you for your partnership in soon to be more than 30 years! spcforexcel.com #StatisticalAnalysis #ProcessImprovement #SPCforExcelSoftware

Running an organization based on numbers alone can be a dangerous route. Knowing however what to do with the numbers is where SPC for Excel can help! See here: spcforexcel.com/spc-software #SPCforExcelSoftware #DrDeming
Two people. Same data. Two totally different stories. Control charts can reveal what’s really happening with messy data—like crime in Washington, D.C. Full article: spcforexcel.com/knowledge/cont… #SPCforExcelSoftware #ControlCharts
Histograms do more than display data—they reveal the story of a process. Watch this short intro + 5 supplier examples: youtu.be/XUeU4tvkXAo #SPCforExcelSoftware #Histograms
Old vs. new. Yours vs. supplier’s. How do you know if two measurement systems agree? The Bland-Altman plot shows both the average difference and the variation in one chart. 👉 spcforexcel.com/knowledge/meas… #SPCforExcelSoftware #GageRR #MeasurementSystems
Control Charts can help with your quality control and improvement efforts. #ControlCharts #SPCforExcelSoftware #QualityControl #QualityImprovemnt
Data isn’t just a collection of numbers—it's what drives better decisions, more informed insights, and meaningful improvements. #SPCforExcel #SPCforExcelSoftware #Infomed Decisions #QualityImprovemnts #Statistical Analysis
A great reminder that every setback is an opportunity for growth. In quality control and beyond, learning from failure paves the way to success. Keep learning, keep improving! #QualityControl #ProcessImprovement #SPCForExcelSoftware
ANOVA shows you which factors matter. A variability chart shows you how to use them. Curious? Check out this explainer on ANOVA & variability charts: spcforexcel.com/knowledge/root… #SPCforExcelSoftware #ANOVA #Quality
This powerful reminder underscores the real cost of defects. Quality control and continuous improvement are essential to reduce errors and ensure efficiency. A mindset that values defect prevention over correction. #QualityManagement #ProcessImprovement #SPCForExcelSoftware
No doubt winter is here in the northern hemisphere —just like the need for accurate data and strong process control. As the temperatures drop, make sure your analysis doesn't freeze. With SPC for Excel, you can keep your processes and data analysis in check. #SPCforExcelSoftware
How do you make sure you are set up for success? One way is to ensure that your processes are capable of meeting customer specifications! See how SPC for Excel Software can help you: spcforexcel.com/spc-for-excel/… #ProcessCapability #SPCforExcelSoftware #CustomerSpecifications
Control charts are vital for monitoring data and identifying special cause of variation. Understanding this supports informed decision-making and continuous improvement. See more here: spcforexcel.com/knowledge/cont… #DataAnalysis #ControlChartst #SPCforExcelSoftware #TrendingData
Out of control points will occur on control charts. We are looking at how these outliers affect setting your baseline data. Do you include them in the calculations and chart the points? Check it out: spcforexcel.com/knowledge/cont… #DataAnalysis #ControlCharts #SPCforExcelSoftware
In this video, we break down how to calculate and understand Pp, Cp, Ppk, and Cpk. Check it out and gain deeper insights into improving your processes! youtu.be/CbGxyD0TlNc #ProcessCapability #PerformanceMetrics #SPCforExcelSoftware
Happy 4th of July to our U.S. friends — and a great weekend to all! Thanks for trusting SPC for Excel as your go-to for quality & SPC guidance. spcforexcel.com #SPCforExcelSoftware #4thofJuly #SPC #Quality #ProcessImprovement
Comparing the proportions in two populations – with binary outcome. This popular article shows you how to do it — and why it matters. Check it out: spcforexcel.com/knowledge/comp… #ComparingTwoProportions #SPCforExcelSoftware #SPCTips #DataAnalysis #SixSigma
Understand your processes on your journey to sustainable success with SPC for Excel software's powerful visual charting and analysis. See how you can get the latest SPC for Excel Version 7 here: spcforexcel.com/catalog/ #SPCforExcelSoftware #ProcessImprovement
🔢 Math Quiz Time! 🔢 Look at the sequence on the blocks: 4, 8, 10, 20, 22, 44, ?? 👉 What number comes next? Drop your answer in the comments ⬇️ — no calculators, just brainpower! #MathQuiz #ProblemSolving #SPCforExcelSoftware
Something went wrong.
Something went wrong.
United States Trends
- 1. Brian Kelly 16.3K posts
- 2. Yamamoto 73.8K posts
- 3. #VERZUZ 57.6K posts
- 4. Colorado 35.5K posts
- 5. Birdman 15.6K posts
- 6. No Limit 37.3K posts
- 7. Deion 2,278 posts
- 8. Mia X 590K posts
- 9. Salter 1,858 posts
- 10. Cash Money 30.8K posts
- 11. Texas A&M 15.2K posts
- 12. Coach Prime 1,518 posts
- 13. Wayne 37.9K posts
- 14. Mizkif 20.5K posts
- 15. Death Valley 6,042 posts
- 16. #breachla 3,979 posts
- 17. #pw_mg 6,460 posts
- 18. Michigan 39.6K posts
- 19. Turk 585K posts
- 20. Malaysia 111K posts