#decisionsthroughdata search results

The Wisconsin Tracking Program has sub-county data on various topics, like community design and childhood lead poisoning. Explore the data to learn how health is connected to the places we live, work, and play. Join the #DecisionsThroughData conversation on Facebook and Twitter


Work smarter, not harder! Maine CDC's Drinking Water Program and the Maine Tracking Network worked together to make a dashboard of the lead in water test results for schools. Explore today maine.gov/dhhs/mecdc/env… #DecisionsThroughData

It’s Tracking Awareness Week! Today’s topic is supporting Preparedness & Response. DYK Tracking Network data can be used to prepare for and respond to natural disasters or other #PublicHealth emergencies? Learn more: bit.ly/TrackingWeek20… @CDC_EPHTracking #DecisionsThroughData

Stay informed! The Maine Tracking Network in partnership with Maine CDC's Climate and Health Program developed a near real-time heat dashboard with daily updates to temperature and emergency department data Check it out data.mainepublichealth.gov/tracking #DecisionsThroughData


So much great information was shared on today's #TrackingChat! Keep following the Tracking Awareness Week conversation by using #DecisionsThroughData - and showcase how you use data to improve public health in your community!

🌊Planning a trip to the beach? Use RIDOH’s online Beach Viewer to check the water quality. RIDOH’s #BeachMonitoringProgram uses data to monitor the water quality and bacteria levels at licensed beaches. More: bit.ly/3acGu1C #DecisionsThroughData

@CDC_EPHTracking data can be used to assess environmental & health hazards & unusual trends to determine which communities may be at risk. Learn more & join the #DecisionsThroughData conversation: bit.ly/3z1Qnsx.


Colorado developed an interactive mapping tool to help identify disproportionate health risks from environmental exposures. #DecisionsThroughData cdphe.colorado.gov/enviroscreen


As the wildfire season ramps up, residents in the Central Valley face double pressure from extreme heat and smoke. In collaboration with @CCEJN, the FRESSCA Study is outfitting swamp coolers with filters to keep communities cool and safe from wildfire smoke. #DecisionsThroughData

#EnvironmentalJustice data tools like Tracking’s EJ Dashboard can help people determine communities at risk, make informed policy decisions, and learn more about how the environment affects their health. bit.ly/EJDashboard @CDC_EPHTracking #DecisionsThroughData

Everyone deserves the same degree of protection from environmental and health hazards. Use Tracking Network data to assess unusual trends and events to determine which communities may be at risk. #DecisionsThroughData

Tracking Network data can be used to prepare for and respond to natural disasters or other public health emergencies. Explore the types of data that can be used to identify threats or make informed decisions during an emergency or disaster response. #DecisionsThroughData


Need info on potential lead exposure to NJ kids from lead paint? NJ’s Potential Lead Exposure Mapping Tool provides housing age info for each NJ home, bit.ly/NJDEP-Potentia…, #DecisionsThroughData #TrackingAwarenessWeek


Meet the staff of the NH Tracking Program and learn about our #DecisionsThroughData at nh.gov/epht/.


During heat waves, DOH and partners use map layers created by the Washington Tracking Network (WTN) to help identify where cooling centers are needed and to promote the use of cooling centers. Find out more here! doh.wa.gov/data-and-stati… #DecisionsThroughData

A5: Population-based geographies are a new way to visualize #data trends for many environmental, community, and health data, especially in areas where there are high or low populations in counties. Learn more: bit.ly/CDCPopGeo #GIS #DecisionsThroughData #TrackingChat


The @HealthyLivingMo Environmental Public Health Tracking program developed a cooling centers map to help Missourians prepare for and stay safe in hot weather. This week is EPHT Awareness Week! Find a cooling center near you Health.Mo.Gov/coolingcenters! #DecisionsThroughData

Tracking Network data can be used to prepare for & respond to natural disasters or other public health emergencies. Explore the types of data that can be used to identify threats or make informed decisions: bit.ly/3nZWcjy, & join the #DecisionsThroughData conversation.

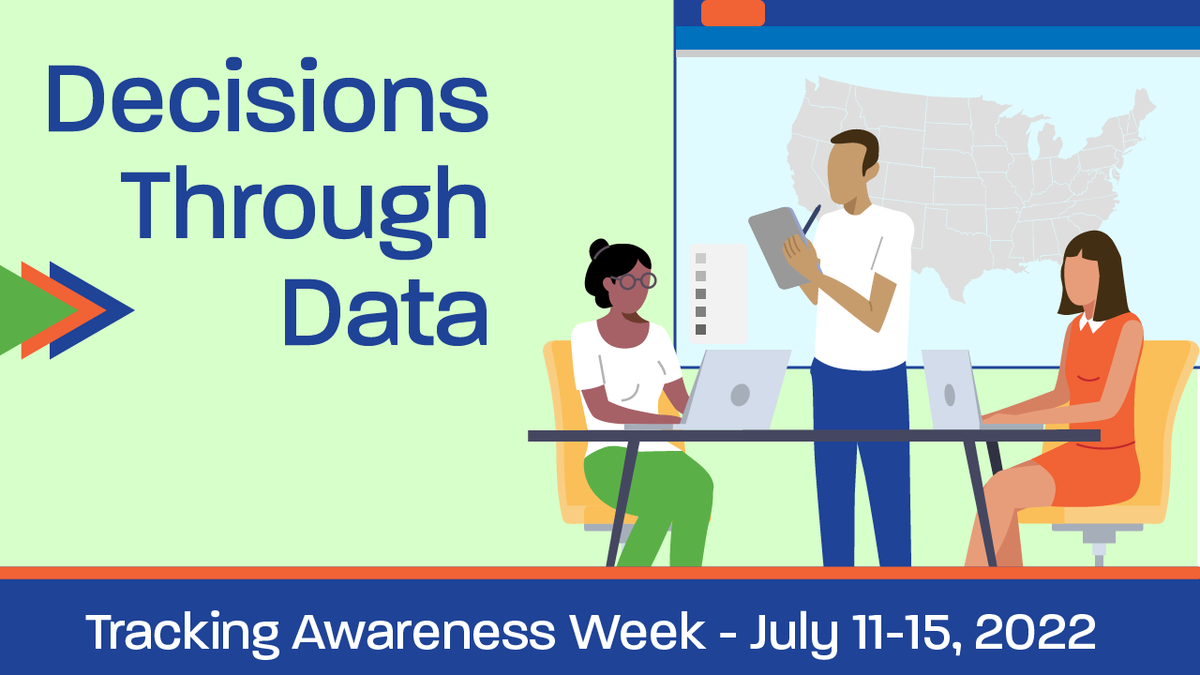
Today kicks off the 7th annual #TrackingAwarenessWeek! With a theme of #DecisionsThroughData, we're highlighting unique data and tools on the #Wisconsin Tracking Network that lead to public health action. Check out the data portal: dhs.wisconsin.gov/epht/index.htm


#decisionsthroughdata #thelongball #consistencyiskey #protips #tipoftheweek #realestateinvestors #portfoliobuilding #retirementplanning #businessowners #marketcycles #realestatepodcast #investmentadvice nicknicknick.com/link


Thank for sharing this great resource! #decisionsthroughdata #publichealh
Work smarter, not harder! Maine CDC's Drinking Water Program and the Maine Tracking Network worked together to make a dashboard of the lead in water test results for schools. Explore today maine.gov/dhhs/mecdc/env… #DecisionsThroughData

Even though Public Health Tracking week is over, learn how state & local programs are using enviro & health data to improve public health efficiencies & impact citizens and communities! bit.ly/3zkFXEm #DecisionsThroughData

Stay informed! The Maine Tracking Network in partnership with Maine CDC's Climate and Health Program developed a near real-time heat dashboard with daily updates to temperature and emergency department data Check it out data.mainepublichealth.gov/tracking #DecisionsThroughData
In Colorado, nearly one out of every two homes test too high for radon. Testing is the best way to know if you are being exposed to harmful levels of radon. If you are, you can install a system to remove the danger. #DecisionsThroughData cdphe.colorado.gov/radon
Explore RI's Environmental Public Health Tracking Dashboard! It’s an interactive online tool that visualizes data on a variety of environmental health topics and related health outcomes like air quality and asthma. Check it out: bit.ly/3tFxHvs #DecisionsThroughData

Environmental data can identify potential threats early. Our Environmental Public Health Tracking program strives to share the good things; like the health benefits of getting outdoors! Find ideas for a Healthy Summer and make your #DecisionsThroughData. ephtn.dhss.mo.gov/EPHTN_Data_Por…

Today's theme: Doing Good w/ Data 🤩 In our TAP study, we found levels of VOCs (volatile organic compounds) in drinking water that exceeded state limits. We alerted the water systems and Waterboards and shared results with participants and their communities. #DecisionsThroughData
Did you know? Emergency department visits and hospitalizations for COPD tend to increase during the winter months. Check out this trend on the NYS Tracking Portal and learn more about COPD trends in NYS. #DecisionsThroughData apps.health.ny.gov/statistics/env…

Read up on the success stories using Tracking Data to implement policy change and improve #publichealth. Join @CDC_EPHTracking’s #DecisionsThroughData conversation to learn more about the good data can do! ow.ly/ECXA50JCUg6

By making health and environmental data available through the RI Tracking Network, more people have access to info they need to make connections between conditions in the environment and their health. ⬇️Check out examples below to see how RIDOH makes #DecisionsThroughData⬇️ (1/3)

CDC-funded Tracking Programs across the country are making important, lasting contributions to the health of their communities. See how programs near you are doing good work with data: bit.ly/TrackingStories @CDC_EPHTracking #DecisionsThroughData

This team has many interactive tools to help you explore, visualize, and better understand environmental health #data. Let us help make #DecisionsThroughData for better health in your community. ephtn.dhss.mo.gov/EPHTN_Data_Por…

Our @HealthyLivingMo Environmental Public Health Tracking program has many interactive tools to help you explore, visualize, and better understand environmental health #data. #DecisionsThroughData

@CDC_EPHTracking members & partners use enviro & health data to improve public health efficiencies & impact citizens in state & local communities. Learn how Tracking programs across the country are doing good with data: bit.ly/3cmFkBm. #DecisionsThroughData


Make #DecisionsThroughData and take actions to protect against lead poisoning: health.ri.gov/lead DISCLAIMER: cdhh.ri.gov/documents/misc…

Our Tracking Program helps community leaders make informed decisions to plan & evaluate public health activities. The #LifeAndBreath Report analysis, developed with @MnPCA, helps direct pollution reduction resources: bit.ly/3yr5nP5 #MNData #DecisionsThroughData

In 2019, a VT law was passed requiring all schools and childcare providers to test their drinking and cooking water for lead. Learn more about the program at ow.ly/wbvU50JRUBr #DecisionsThroughData

🌊Planning a trip to the beach? Use RIDOH’s online Beach Viewer to check the water quality. RIDOH’s #BeachMonitoringProgram uses data to monitor the water quality and bacteria levels at licensed beaches. More: bit.ly/3acGu1C #DecisionsThroughData

Watch this @PublicHealth webinar to learn how to use data tools from @CDC_EPHTracking to address environmental injustices in your community: ow.ly/Oexo50JMGxa. #DecisionsThroughData

#EnvironmentalJustice data tools like Tracking’s EJ Dashboard can help people determine communities at risk, make informed policy decisions, and learn more about how the environment affects their health. bit.ly/EJDashboard @CDC_EPHTracking #DecisionsThroughData
A5: Population-based geographies are a new way to visualize #data trends for many environmental, community, and health data, especially in areas where there are high or low populations in counties. Learn more: bit.ly/CDCPopGeo #GIS #DecisionsThroughData #TrackingChat
It’s Tracking Awareness Week! Today’s topic is supporting Preparedness & Response. DYK Tracking Network data can be used to prepare for and respond to natural disasters or other #PublicHealth emergencies? Learn more: bit.ly/TrackingWeek20… @CDC_EPHTracking #DecisionsThroughData
A2: CDC's Heat & Health Tracker provides local heat and health information so communities can better prepare for and respond to #ExtremeHeat events. Check out this #PoweredByTracking dashboard: bit.ly/CDCHeatTracker #DecisionsThroughData

Work smarter, not harder! Maine CDC's Drinking Water Program and the Maine Tracking Network worked together to make a dashboard of the lead in water test results for schools. Explore today maine.gov/dhhs/mecdc/env… #DecisionsThroughData
@CDC_EPHTracking data can be used to assess environmental & health hazards & unusual trends to determine which communities may be at risk. Learn more & join the #DecisionsThroughData conversation: bit.ly/3z1Qnsx.
The Wisconsin Tracking Program has sub-county data on various topics, like community design and childhood lead poisoning. Explore the data to learn how health is connected to the places we live, work, and play. Join the #DecisionsThroughData conversation on Facebook and Twitter
Meet the staff of the NH Tracking Program and learn about our #DecisionsThroughData at nh.gov/epht/.
A1: Meet the staff of the NH Tracking Program and learn about our #DecisionsThroughData at nh.gov/epht/. #TrackingChat

As the wildfire season ramps up, residents in the Central Valley face double pressure from extreme heat and smoke. In collaboration with @CCEJN, the FRESSCA Study is outfitting swamp coolers with filters to keep communities cool and safe from wildfire smoke. #DecisionsThroughData
Stay informed! The Maine Tracking Network in partnership with Maine CDC's Climate and Health Program developed a near real-time heat dashboard with daily updates to temperature and emergency department data Check it out data.mainepublichealth.gov/tracking #DecisionsThroughData
Today kicks off the 7th annual #TrackingAwarenessWeek! With a theme of #DecisionsThroughData, we're highlighting unique data and tools on the #Wisconsin Tracking Network that lead to public health action. Check out the data portal: dhs.wisconsin.gov/epht/index.htm
Lack of trees and lots of pavement and buildings in cities can affect how hot it gets during the summer. ☀️🌇It's called the #UrbanHeatIsland effect. Explore how summer temperatures vary across RI's cities: bit.ly/3nDTtMz #DecisionsThroughData

Our @HealthyLivingMo Environmental Public Health Tracking program has many interactive tools to help you explore, visualize, and better understand environmental health #data. #DecisionsThroughData
Everyone deserves the same degree of protection from environmental and health hazards. Use Tracking Network data to assess unusual trends and events to determine which communities may be at risk. #DecisionsThroughData

.@CDC_EPHTracking: Next week is CDC's Environmental Public Health Tracking Awareness Week bit.ly/TrackingWeek20… #TAW2022 #DecisionsThroughData

During heat waves, DOH and partners use map layers created by the Washington Tracking Network (WTN) to help identify where cooling centers are needed and to promote the use of cooling centers. Find out more here! doh.wa.gov/data-and-stati… #DecisionsThroughData
Something went wrong.
Something went wrong.
United States Trends
- 1. Veterans Day 349K posts
- 2. Woody 10.9K posts
- 3. Toy Story 5 12.3K posts
- 4. Luka 82.4K posts
- 5. Nico 139K posts
- 6. Gambit 39K posts
- 7. Travis Hunter 3,278 posts
- 8. Mavs 32K posts
- 9. Payne 11.4K posts
- 10. Sabonis 3,557 posts
- 11. Vets 31K posts
- 12. Battlenet 3,230 posts
- 13. #JonatanVendeHumo 3,048 posts
- 14. Wike 109K posts
- 15. Pat McAfee 4,794 posts
- 16. Jonatan Palacios 1,991 posts
- 17. Kyrie 7,616 posts
- 18. Bond 72.1K posts
- 19. Antifa 183K posts
- 20. Jay Rock 3,615 posts