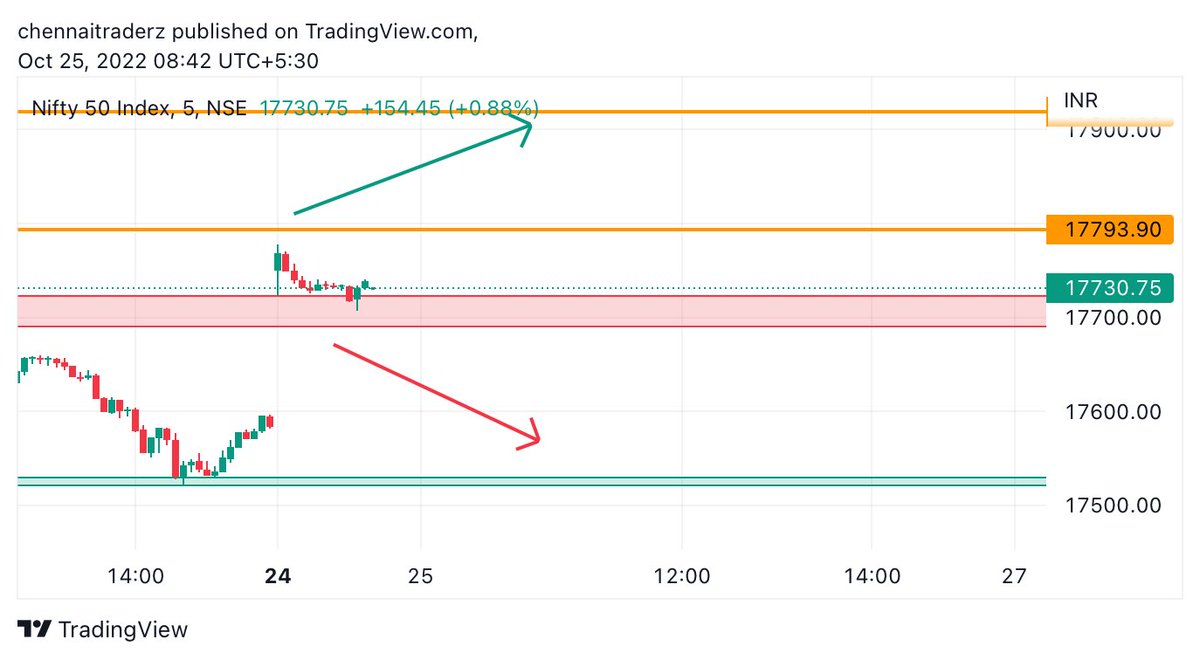
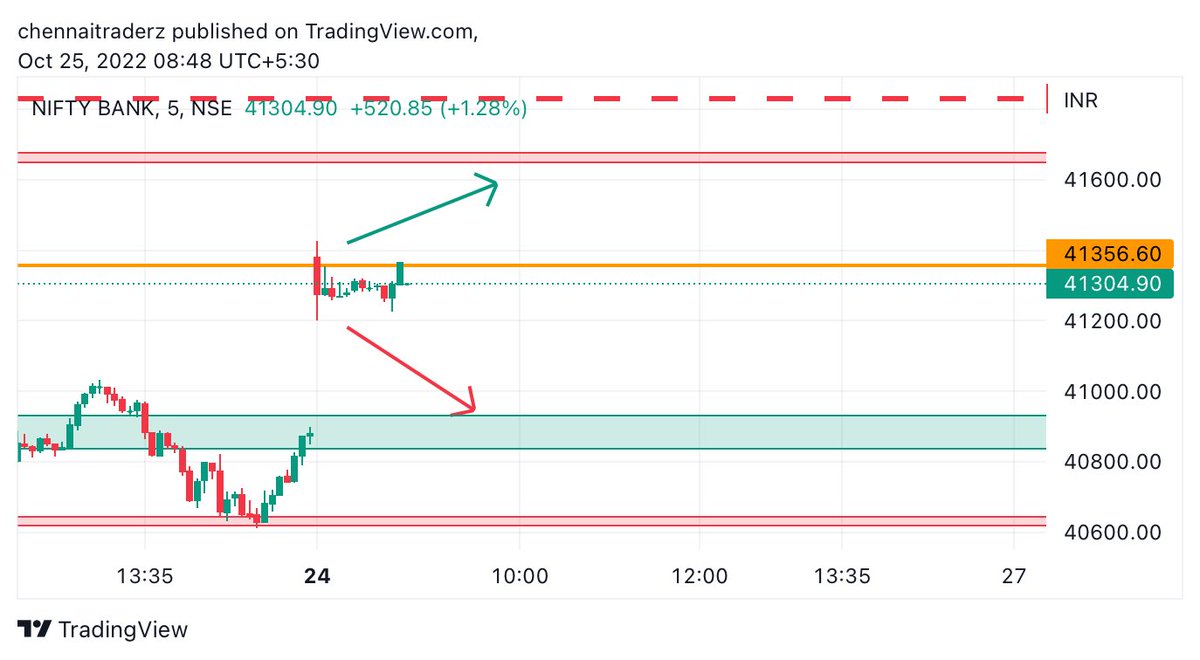
#intradayanalysis نتائج البحث
Nifty Oil & Gas hovering at 11,387 🔹 Bounce or break? Upside target: 11,506–11,603 Support: 11,151 Share your view 👇 #Nifty #OilGas #IntradayAnalysis

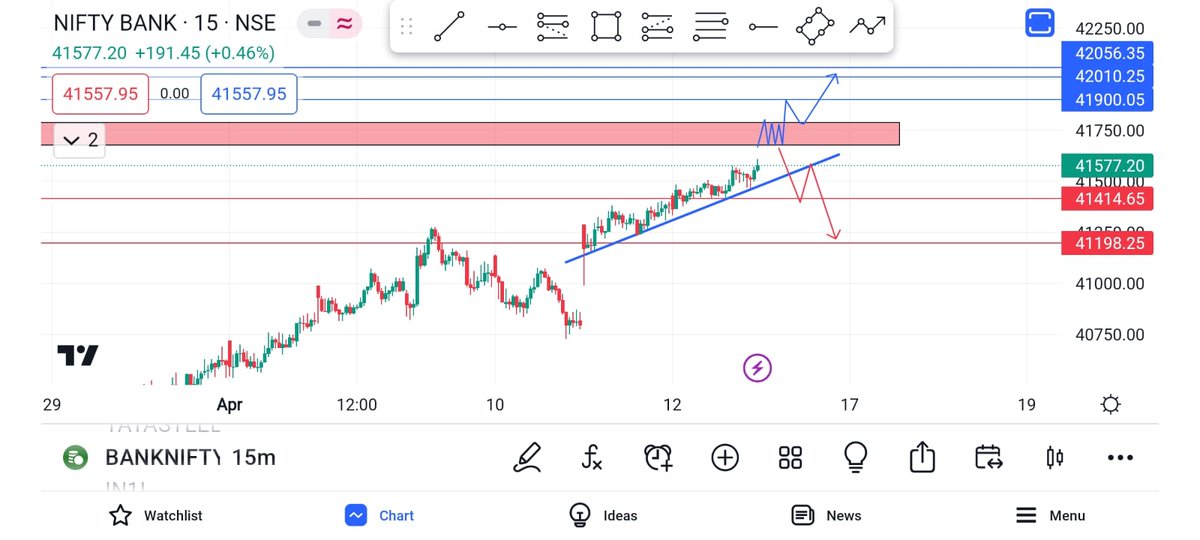
"Here's my intraday analysis for tomorrow: Resistance and reversal at 41677-41786. If it breaks after consolidation, targets are 41900, 42000, and 42050. On the downside, if it breaks 41414 after reversal, targets are 41200, 41100, and 41000. #IntradayAnalysis #StockMarket"
Watching Bank Nifty Future with Data Points 📊: P-Level (Pressure Level) at 47258, key zone for today's action. Bulls in control above, bears below. Currently riding at 500-points gain 📈😌 #BankNiftyFuture #IntradayAnalysis #OptionsTrading

📊 $Gold Intraday Update Bias: Bullish above 3333.00 🎯 Targets: 3375.00 & 3395.00 📉 Below 3333.00? Watch 3314.00 & 3297.00 RSI holding above 50 — momentum favors the bulls ⚡ #XAUUSD #IntradayAnalysis #FOREX #JessPhillips

Nifty Oil & Gas hovering at 11,387 🔹 Bounce or break? Upside target: 11,506–11,603 Support: 11,151 Share your view 👇 #Nifty #OilGas #IntradayAnalysis

📊 $Gold Intraday Update Bias: Bullish above 3333.00 🎯 Targets: 3375.00 & 3395.00 📉 Below 3333.00? Watch 3314.00 & 3297.00 RSI holding above 50 — momentum favors the bulls ⚡ #XAUUSD #IntradayAnalysis #FOREX #JessPhillips

NOW ASHOKLEY TOUCHED 199.35 HIT OUR TARGET 📊 #ASHOKLEY #StockMarket #IntradayAnalysis #SellSetup #BearishPattern
🌟 Gold Intraday: Under Pressure 🌟 👉 Read the full blog here: forexstreet5566.blogspot.com/2024/12/accura… 📌 Stay ahead in the market and make informed decisions. #GoldTrading #ForexSignals #IntradayAnalysis #TradingStrategy #PivotPoints #GoldMarket #ForexTips #TradingGold
forexstreet5566.blogspot.com
Gold Intraday Analysis – August 25, 2025
Today's Gold intraday levels, buy/sell targets, and pivot analysis.
$qqq 10 min/1hr chart 🌎 #intradayanalysis #Levels lvls✅ [follow trend. have no bias]
![matamoros_16's tweet image. $qqq 10 min/1hr chart 🌎
#intradayanalysis #Levels
lvls✅
[follow trend. have no bias]](https://pbs.twimg.com/media/FgvkdLSWIAYvm4P.jpg)
$qqq 10 min/1hr chart 🌎 #premarketanalysis #Levels Would like to see a rtst of 265.61 [11/2 low] for a rejection to continue lower bnb above 266.74 [10/17 low] for a continuation upward [follow trend. have no bias]
![matamoros_16's tweet image. $qqq 10 min/1hr chart 🌎
#premarketanalysis #Levels
Would like to see a rtst of 265.61 [11/2 low] for a rejection to continue lower
bnb above 266.74 [10/17 low] for a continuation upward
[follow trend. have no bias]](https://pbs.twimg.com/media/FgpFgfwXkAI-pxA.jpg)
$spy 10 min/1hr chart 🌎 #intradayanalysis #Levels lvls✅ [follow trend. have no bias]
![matamoros_16's tweet image. $spy 10 min/1hr chart 🌎
#intradayanalysis #Levels
lvls✅
[follow trend. have no bias]](https://pbs.twimg.com/media/FgvkTDJXEAEnh7D.jpg)
$spy 10 min/1hr chart 🌎 #premarketanalysis #Levels Would like to see price rtst 373.11 [10/24 wk low] for a rejection to continue lower bnb above 375.45 [10/17 wk high] for a continuation upward 373.11-375.45 chop [follow trend. have no bias]
![matamoros_16's tweet image. $spy 10 min/1hr chart 🌎
#premarketanalysis #Levels
Would like to see price rtst 373.11 [10/24 wk low] for a rejection to continue lower
bnb above 375.45 [10/17 wk high] for a continuation upward
373.11-375.45 chop
[follow trend. have no bias]](https://pbs.twimg.com/media/FgpEp66WIAAZUcx.jpg)
$nvda 10min/1hr chart 🌎 #intradayanalysis #lvls lvls ✅ [follow price. have no bias]
![matamoros_16's tweet image. $nvda 10min/1hr chart 🌎
#intradayanalysis #lvls
lvls ✅
[follow price. have no bias]](https://pbs.twimg.com/media/FhDmnM1WQAAjVOk.png)
$qqq 10min/1hr chart #intradayanalysis 🌎 lvls ✅ [follow price no bias]*
![matamoros_16's tweet image. $qqq 10min/1hr chart
#intradayanalysis 🌎
lvls ✅
[follow price no bias]*](https://pbs.twimg.com/media/Ff7UVHhX0AEN17R.jpg)
$qqq 10min/1hr chart #premarktanalysis 🌎 Bulls defend 275.43 dmnd zone to bnb above 280 sply zone and rtst 284.54 sply zone>286.82 potentially Bears defend 280 sply zone to bnb below 275.43 dmnd zone and rtst 272.13 dmnd zone>271.27 potentially [follow price no bias]*
![matamoros_16's tweet image. $qqq 10min/1hr chart
#premarktanalysis 🌎
Bulls defend 275.43 dmnd zone to bnb above 280 sply zone and rtst 284.54 sply zone>286.82 potentially
Bears defend 280 sply zone to bnb below 275.43 dmnd zone and rtst 272.13 dmnd zone>271.27 potentially
[follow price no bias]*](https://pbs.twimg.com/media/Ff6fJfwWYAYOqJE.jpg)
$spy 10min/1hr chart #intradayanalysis 🌎 lvls ✅ [follow price. have no bias]*
![matamoros_16's tweet image. $spy 10min/1hr chart
#intradayanalysis 🌎
lvls ✅
[follow price. have no bias]*](https://pbs.twimg.com/media/FgK5v_cXgAA92no.jpg)
$spy 10 min/1hr chart 🌎 #premarketanalysis stochastic on both timeframes looking clean price is above 200 ema on both timeframes could maintain and push here bears need to defend 379.46 to push lower 375.45 is the line in the sand [follow price. have no bias]*
![matamoros_16's tweet image. $spy 10 min/1hr chart 🌎
#premarketanalysis
stochastic on both timeframes looking clean
price is above 200 ema on both timeframes could maintain and push here
bears need to defend 379.46 to push lower
375.45 is the line in the sand
[follow price. have no bias]*](https://pbs.twimg.com/media/FgKNRmeXkAIpuAV.jpg)
$qqq 10min/1hr chart 🌎 #intradayanalysis #lvls lvls ✅ on a mission 🚀 [follow price. have no bias]*
![matamoros_16's tweet image. $qqq 10min/1hr chart 🌎
#intradayanalysis #lvls
lvls ✅
on a mission 🚀
[follow price. have no bias]*](https://pbs.twimg.com/media/FhDjQijXkAUrwp4.jpg)
![matamoros_16's tweet image. $qqq 10min/1hr chart 🌎
#intradayanalysis #lvls
lvls ✅
on a mission 🚀
[follow price. have no bias]*](https://pbs.twimg.com/media/FhDjhjrWQAA1-NW.jpg)
$qqq 10min/1hr chart 🌎 #premarketanalysis #lvls bulls defend 266.61/268.14 to bnb above 269.49 and rtst 272>274 potentially bears defend 269.49/268.14 to bnb below 266.61 and rtst 265.61>263.57>259.08 potentially [follow price. have no bias]
![matamoros_16's tweet image. $qqq 10min/1hr chart 🌎
#premarketanalysis #lvls
bulls defend 266.61/268.14 to bnb above 269.49 and rtst 272>274 potentially
bears defend 269.49/268.14 to bnb below 266.61 and rtst 265.61>263.57>259.08 potentially
[follow price. have no bias]](https://pbs.twimg.com/media/FhC5cN_WIAU1vVx.jpg)
$qqq 10min/1hr chart #intradayanalysis 🌎 bulls** lvls ✅ [follow price. have no bias]*
![matamoros_16's tweet image. $qqq 10min/1hr chart
#intradayanalysis 🌎
bulls**
lvls ✅
[follow price. have no bias]*](https://pbs.twimg.com/media/FgK5eCVXkAARgBr.jpg)
$qqq 10min/1hr chart #premarktayanalysis 🌎 bears to defend 272.70/273 spot to push further bears defend 272 spot [follow price. have no bias]*
![matamoros_16's tweet image. $qqq 10min/1hr chart
#premarktayanalysis 🌎
bears to defend 272.70/273 spot to push further
bears defend 272 spot
[follow price. have no bias]*](https://pbs.twimg.com/media/FgKOQj3XEAAjx-V.jpg)
$nvda 10min/1hr chart #intradayanalysis 🌎 still got work to do lvls ✅ [follow price no bias]*
![matamoros_16's tweet image. $nvda 10min/1hr chart
#intradayanalysis 🌎
still got work to do
lvls ✅
[follow price no bias]*](https://pbs.twimg.com/media/Ff7XKOTX0AgVEFs.jpg)
$nvda 10min/1hr chart #premarktanalysis 🌎 above 128.27 bulls take it below 124.51 bears take it [follow price no bias]*
![matamoros_16's tweet image. $nvda 10min/1hr chart
#premarktanalysis 🌎
above 128.27 bulls take it
below 124.51 bears take it
[follow price no bias]*](https://pbs.twimg.com/media/Ff6olsBWIAYaPqR.jpg)
$spy 10min/1hr chart 🌎 #intradayanalysis #lvls lvls ✅ fast forward, it touches the resistance lvl... [follow price. have no bias]
![matamoros_16's tweet image. $spy 10min/1hr chart 🌎
#intradayanalysis #lvls
lvls ✅
fast forward, it touches the resistance lvl...
[follow price. have no bias]](https://pbs.twimg.com/media/FhDkImIXEAEo9Qf.jpg)
$spy 10min/1hr chart 🌎 #premarketanalysis #lvls bulls defend 378.87 to bnb above 380.57 and rtst 382.11>383.29>385.26>388.4 bears defend 380.57 to bnb below 378.87 and rtst 375.53>371.04 potentially [follow price. have no bias]
![matamoros_16's tweet image. $spy 10min/1hr chart 🌎
#premarketanalysis #lvls
bulls defend 378.87 to bnb above 380.57 and rtst 382.11>383.29>385.26>388.4
bears defend 380.57 to bnb below 378.87 and rtst 375.53>371.04 potentially
[follow price. have no bias]](https://pbs.twimg.com/media/FhC3hKvWIAATSA4.jpg)
$vix 10min/1hr chart #intradayanalysis 🌎 26.71 gave up and the market had a melt up lvls ✅ [follow price. have no bias]*
![matamoros_16's tweet image. $vix 10min/1hr chart
#intradayanalysis 🌎
26.71 gave up and the market had a melt up
lvls ✅
[follow price. have no bias]*](https://pbs.twimg.com/media/FgK6lTHX0AATB7w.jpg)
$vix 10 min/1hr chart 🌎 bounce at 26.71 or bnb above 27.27 good for shorts 🐻 reject off 27.27 or bnb below 26.71 good for longs 🐂 [follow price. have no bias]*
![matamoros_16's tweet image. $vix 10 min/1hr chart 🌎
bounce at 26.71 or bnb above 27.27 good for shorts 🐻
reject off 27.27 or bnb below 26.71 good for longs 🐂
[follow price. have no bias]*](https://pbs.twimg.com/media/FgKL_2kX0AIB2KX.jpg)
$amzn 10min/1hr chart #intradayanalysis 🌎 make or break to the other side... 9 ema holding on both timeframes. lvls ✅ [follow price no bias]*
![matamoros_16's tweet image. $amzn 10min/1hr chart
#intradayanalysis 🌎
make or break to the other side... 9 ema holding on both timeframes.
lvls ✅
[follow price no bias]*](https://pbs.twimg.com/media/Ff7XWOKWAAIy4UI.jpg)
$amzn 10min/1hr chart #premarktanalysis 🌎 119.59/121.76 absolutely no trades above above 121.76 good for longs below below 119.56 good for shorts [follow price no bias]*
![matamoros_16's tweet image. $amzn 10min/1hr chart
#premarktanalysis 🌎
119.59/121.76 absolutely no trades
above above 121.76 good for longs
below below 119.56 good for shorts
[follow price no bias]*](https://pbs.twimg.com/media/Ff6o53HWIAE0HOL.jpg)
"Here's my intraday analysis for tomorrow: Resistance and reversal at 41677-41786. If it breaks after consolidation, targets are 41900, 42000, and 42050. On the downside, if it breaks 41414 after reversal, targets are 41200, 41100, and 41000. #IntradayAnalysis #StockMarket"

Jsw steel 30 Min time Frame My shorting entry will be at 561 sl ill Put 564.75 ( closing basis) and Target 554 #jswsteel #stockmarket #intradayanalysis #Technicalanalysis

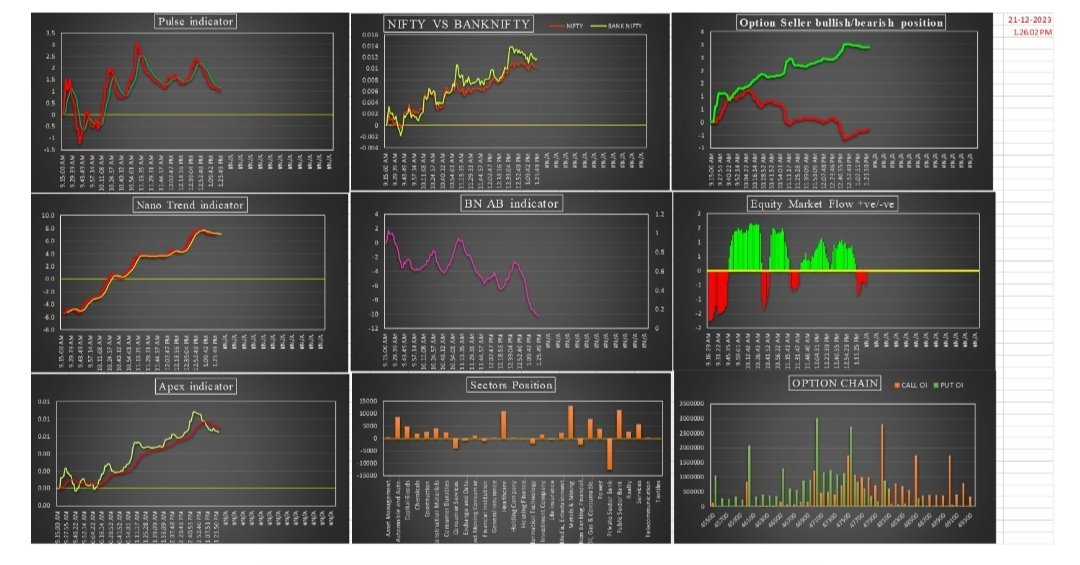
#Nifty #Banknifty #IntradayAnalysis #21Dec2021 #PointandFigure #PnF #TurtleBreakout #OptionsTrading youtu.be/s2cd71AAC8A For the First few minutes of the video, I shared the wrong screen. Here is a screenshot of the screen I was referring to

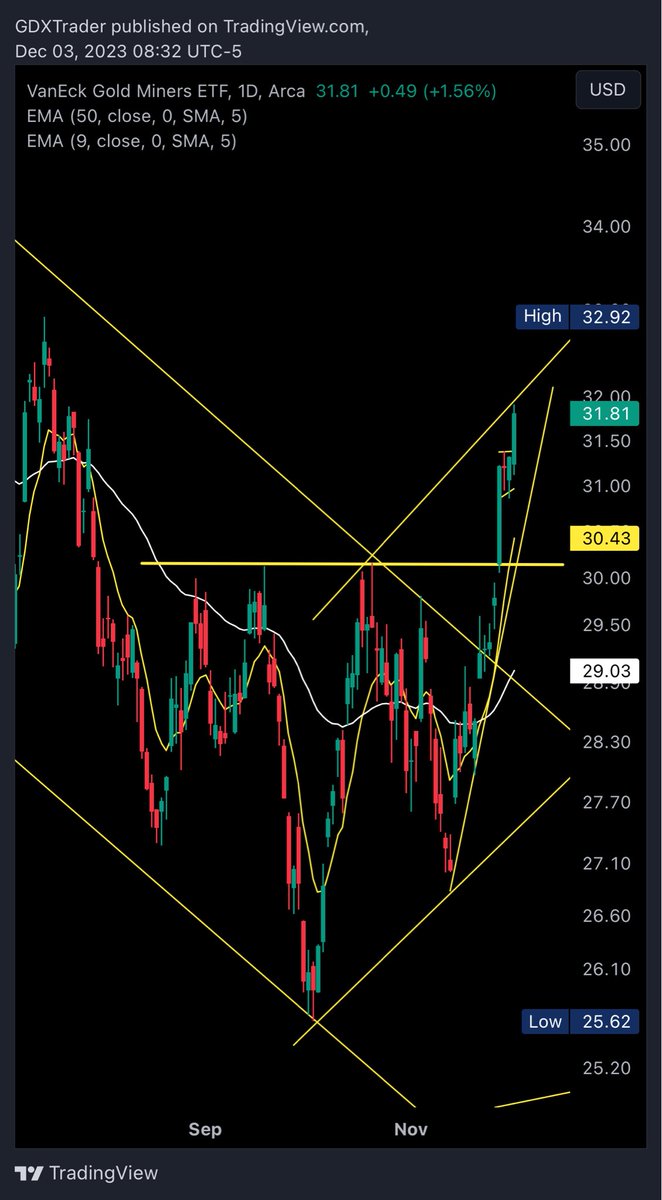
📈 Intraday insights on $GDX! 🚀 Just released a video for members, featuring updated stops, new levels, targets, and a deep dive into trends and key areas. Stay ahead with exclusive content! 💹💡 #GDX #IntradayAnalysis #TradingUpdates
📊 $Gold Intraday Update Bias: Bullish above 3333.00 🎯 Targets: 3375.00 & 3395.00 📉 Below 3333.00? Watch 3314.00 & 3297.00 RSI holding above 50 — momentum favors the bulls ⚡ #XAUUSD #IntradayAnalysis #FOREX #JessPhillips

attract more investors to the financial services by your offers #Publish #IntradayAnalysis goo.gl/A1yoDm

Nifty Oil & Gas hovering at 11,387 🔹 Bounce or break? Upside target: 11,506–11,603 Support: 11,151 Share your view 👇 #Nifty #OilGas #IntradayAnalysis

Watching Bank Nifty Future with Data Points 📊: P-Level (Pressure Level) at 47258, key zone for today's action. Bulls in control above, bears below. Currently riding at 500-points gain 📈😌 #BankNiftyFuture #IntradayAnalysis #OptionsTrading


Something went wrong.
Something went wrong.
United States Trends
- 1. #StrangerThings5 50.9K posts
- 2. Afghan 134K posts
- 3. Thanksgiving 544K posts
- 4. National Guard 459K posts
- 5. #AEWDynamite 12.2K posts
- 6. #Survivor49 1,398 posts
- 7. Rahmanullah Lakanwal 55.3K posts
- 8. Cease 26.5K posts
- 9. holly 20K posts
- 10. dustin 81.3K posts
- 11. Celtics 13.3K posts
- 12. Blood 240K posts
- 13. Cade 33.3K posts
- 14. Blue Jays 11.2K posts
- 15. Operation Allies Welcome 17.6K posts
- 16. Derrick White 2,133 posts
- 17. Okada 7,411 posts
- 18. Walker Horn N/A
- 19. #kubball N/A
- 20. D.C. 291K posts


![matamoros_16's tweet image. $nvda 10min/1hr chart 🌎
#premarketanalysis #lvls
[follow price. have no bias]](https://pbs.twimg.com/media/FhDBQqjaYAAOZA2.png)


