#omgraph search results


Support for protesters plummets when survey respondents learn the protesters are Black. Wild seeing so many groups tell on themselves here. #OMGraph

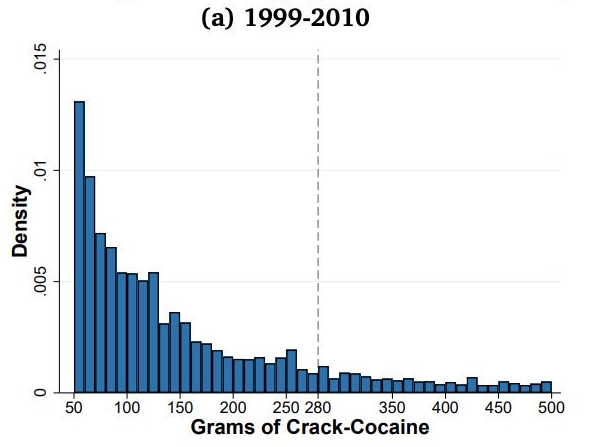
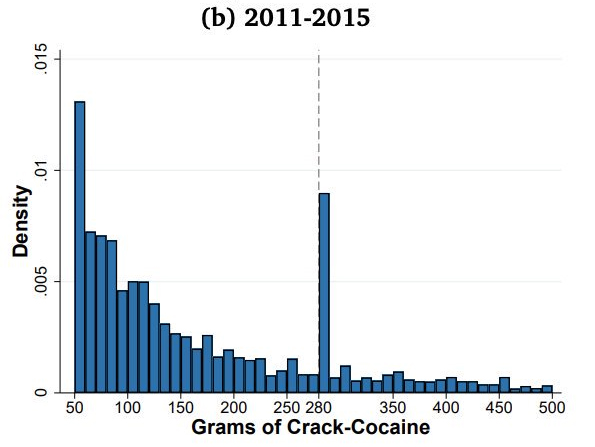
Pre-2010, 50g of crack-cocaine got you a mandatory minimum 10 years in prison. Post-2010, that threshold was raised to 280g, which resulted in this .... uhhh suspicious drug seizure graph. #OMGraph #iteachmath h/t @JohnHolbein1 econweb.umd.edu/~tuttle/files/…
Cancer diagnoses spike at age 65. Any guesses why? (Folks living outside the US – feel free not to answer, gloat.) #OMGraph #iteachmath h/t @lukeoneil47

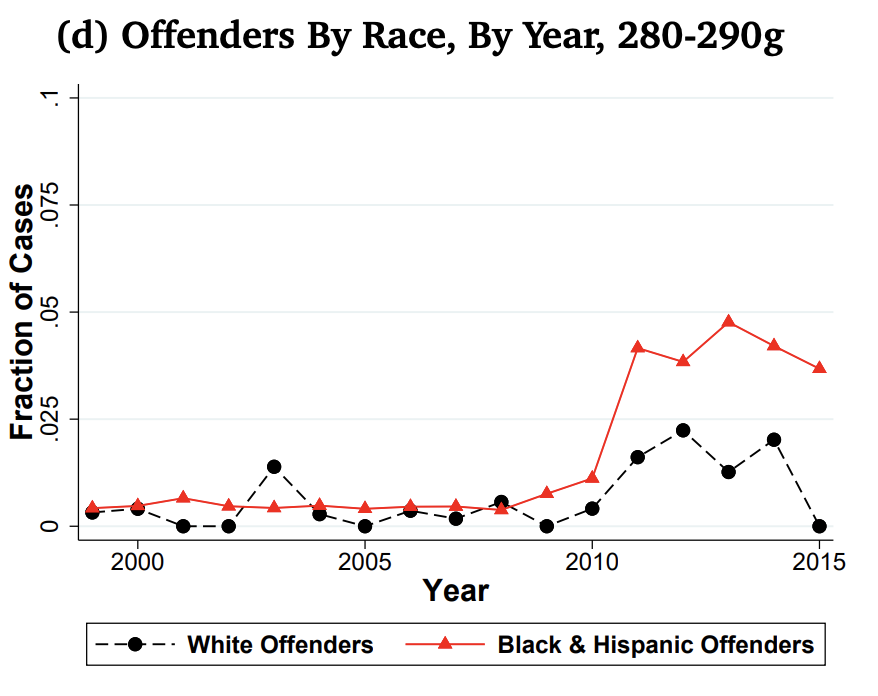
That utterly implausible spike in 280g seizures, each one triggering a 10-year prison sentence? Would it surprise you to find out it disproportionately comprised Black & Hispanic people? #OMGraph #iteachmath
This graph is such a wild ride. The distance from y = x is 🔑. It looks like the 85%-ile income is the most detached from reality. (~$103,000 USD) #OMGraph nber.org/system/files/w…


It really shows the power of a graph to communicate some complex ideas in a concise way. #OMGraph I wonder if any of this relates to the differences in "average income" vs "median income"? and how household vs individual income numbers add to the mix.

Has anyone checked in on men recently?? #OMGraph

UVA study of students who were asked to sit alone in a room for 15 minutes. Percent who decided to give themselves a painful shock. Men, lol (h/t @idea_soup)


Here's a scatterplot of health spending per capita (x axis) & life expectancy (y axis) in OECD countries (lines = averages). One country sits alone in the bottom right quadrant due to its much higher spending and below-average life expectancy. Source: oecd-ilibrary.org/sites/ae3016b9…

@raphaeljames23 Rabbit? #omgraph @megmcmanus5 photo creds! twitpic.com/88g1zq

Dyeing mothers hair! #omgraph @raphaeljames23 good memories dyeing #Stella 's hair together (L)
Pre-2010, 50g of crack-cocaine got you a mandatory minimum 10 years in prison. Post-2010, that threshold was raised to 280g, which resulted in this .... uhhh suspicious drug seizure graph. #OMGraph #iteachmath h/t @JohnHolbein1 econweb.umd.edu/~tuttle/files/…

This is data that needs to be seen! Graphs like this have dramatically changed how I think about drug laws and the criminal justice system over the last 15 years. Also: I would love to get #OMGraph trending! 😍
@LatamData posted this one, which is also striking. The US line is a little bit hidden, but check out that drop. #OMGraph

(1/10) Would you trade an extra year and a half of life in exchange for living under a communist regime? A thread on Cuban Life Expectancy 🇨🇺❤️🩹:

Here's a scatterplot of health spending per capita (x axis) & life expectancy (y axis) in OECD countries (lines = averages). One country sits alone in the bottom right quadrant due to its much higher spending and below-average life expectancy. Source: oecd-ilibrary.org/sites/ae3016b9…
Cancer diagnoses spike at age 65. Any guesses why? (Folks living outside the US – feel free not to answer, gloat.) #OMGraph #iteachmath h/t @lukeoneil47
It really shows the power of a graph to communicate some complex ideas in a concise way. #OMGraph I wonder if any of this relates to the differences in "average income" vs "median income"? and how household vs individual income numbers add to the mix.
This graph is such a wild ride. The distance from y = x is 🔑. It looks like the 85%-ile income is the most detached from reality. (~$103,000 USD) #OMGraph nber.org/system/files/w…
Has anyone checked in on men recently?? #OMGraph
UVA study of students who were asked to sit alone in a room for 15 minutes. Percent who decided to give themselves a painful shock. Men, lol (h/t @idea_soup)

Support for protesters plummets when survey respondents learn the protesters are Black. Wild seeing so many groups tell on themselves here. #OMGraph
Support for protesters plummets when survey respondents learn the protesters are Black. Wild seeing so many groups tell on themselves here. #OMGraph
Pre-2010, 50g of crack-cocaine got you a mandatory minimum 10 years in prison. Post-2010, that threshold was raised to 280g, which resulted in this .... uhhh suspicious drug seizure graph. #OMGraph #iteachmath h/t @JohnHolbein1 econweb.umd.edu/~tuttle/files/…
This is data that needs to be seen! Graphs like this have dramatically changed how I think about drug laws and the criminal justice system over the last 15 years. Also: I would love to get #OMGraph trending! 😍
That utterly implausible spike in 280g seizures, each one triggering a 10-year prison sentence? Would it surprise you to find out it disproportionately comprised Black & Hispanic people? #OMGraph #iteachmath
Pre-2010, 50g of crack-cocaine got you a mandatory minimum 10 years in prison. Post-2010, that threshold was raised to 280g, which resulted in this .... uhhh suspicious drug seizure graph. #OMGraph #iteachmath h/t @JohnHolbein1 econweb.umd.edu/~tuttle/files/…


@raphaeljames23 Rabbit? #omgraph @megmcmanus5 photo creds! twitpic.com/88g1zq


Pre-2010, 50g of crack-cocaine got you a mandatory minimum 10 years in prison. Post-2010, that threshold was raised to 280g, which resulted in this .... uhhh suspicious drug seizure graph. #OMGraph #iteachmath h/t @JohnHolbein1 econweb.umd.edu/~tuttle/files/…
That utterly implausible spike in 280g seizures, each one triggering a 10-year prison sentence? Would it surprise you to find out it disproportionately comprised Black & Hispanic people? #OMGraph #iteachmath
Cancer diagnoses spike at age 65. Any guesses why? (Folks living outside the US – feel free not to answer, gloat.) #OMGraph #iteachmath h/t @lukeoneil47
Support for protesters plummets when survey respondents learn the protesters are Black. Wild seeing so many groups tell on themselves here. #OMGraph
It really shows the power of a graph to communicate some complex ideas in a concise way. #OMGraph I wonder if any of this relates to the differences in "average income" vs "median income"? and how household vs individual income numbers add to the mix.
This graph is such a wild ride. The distance from y = x is 🔑. It looks like the 85%-ile income is the most detached from reality. (~$103,000 USD) #OMGraph nber.org/system/files/w…
@raphaeljames23 Rabbit? #omgraph @megmcmanus5 photo creds! twitpic.com/88g1zq
Something went wrong.
Something went wrong.
United States Trends
- 1. Megyn Kelly 24.6K posts
- 2. Vine 28.2K posts
- 3. Senator Fetterman 15.3K posts
- 4. CarPlay 3,969 posts
- 5. #NXXT_JPMorgan N/A
- 6. Padres 29.4K posts
- 7. Cynthia 106K posts
- 8. Osimhen 92.9K posts
- 9. Katie Couric 8,672 posts
- 10. Black Mirror 4,807 posts
- 11. #WorldKindnessDay 16.3K posts
- 12. Rep. Eric Swalwell 5,870 posts
- 13. Gaetz 11.7K posts
- 14. Woody Johnson 1,538 posts
- 15. V-fib N/A
- 16. Sheel N/A
- 17. GeForce Season N/A
- 18. World Cup 87.5K posts
- 19. Cal Raleigh N/A
- 20. VOTAR NO 25.8K posts