#powerqueryeditor search results

TRANSFORMING DATA Power query editor cleans data faster and handles larger datasets. #data #powerbi #powerqueryeditor

In this tutorial, we show you how to use Power Query Editor to clean and prepare your dataset like a pro. Learn how to check Column Quality, Column Distribution, and Column Profile so you can trust your data before analysis #pixardataconsult #PowerQueryEditor #ColumnQuality

For those of you writing custom M code in #powerquery and #powerbi go and get your own #PowerQueryEditor here goo.gl/yo45S9

Power Query and Power Pivot Made Easy for Beginners youtu.be/OPDSQG7MzG0?si… via @YouTube #powerquery #powerqueryeditor #dashboard #excel #dataanalysis #calendar #fyp #pmo #powerpivot

youtube.com
YouTube
Power Query and Power Pivot Made Easy for Beginners
Power Query Calendar Trick Everyone Should Know youtube.com/shorts/KfA5aFw… via @YouTube #powerquery #powerqueryeditor #dashboard #excel #dataanalysis #calendar #fyp #pmo #financialcalendar #financialperiods

youtube.com
YouTube
Power Query Calendar Trick Everyone Should Know


Do you know the differences between #PowerQueryEditor and #DataWragler in #MicrosoftFabric? Today, I explained that in a blog and video here: radacad.com/data-wrangler-… #PowerQuery #DataFactory #Fabric #Microsoft #DataTransformation #ETL #DataScience #DataWarehouse

Fuzzy match in Excel in Power Query to Match Data #excel #powerqueryeditor #datascience #DataProtection
Split Inconsistent Text in Excel by using Power query #excel #powerqueryeditor #datascience #DataQuality youtube.com/shorts/3DN8vzd…
Power Query MAGIC Dynamic Calendar Secrets Revealed youtu.be/iJccmdTZ9TE?si… via @YouTube #powerquery #powerqueryeditor #dashboard #excel #dataanalysis #calendar #fyp #pmo #financialcalendar #financialperiods

youtube.com
YouTube
Power Query MAGIC Dynamic Calendar Secrets Revealed

Join our webinar tomorrow to see how-to demos of #PowerBI data cleansing techniques using #PowerQueryEditor. bit.ly/2OFWHS3


Star Schema Preparation in Power Query Editor for Power Bi: lttr.ai/AMA6h #PowerQueryEditor #LowestRequiredGrain #KeyPerformanceIndicators #CreatingDimensionTables #CreatingFactTables #StarSchemaPreparation #EffectivelyIdentifyDimensions #IdentifyPotentialDimensions
We will cover topics such as identifying dimensions and facts, creating dimension tables, and creating fact tables. 👉 lttr.ai/AI5SE #PowerQueryEditor #LowestRequiredGrain #KeyPerformanceIndicators #CreatingDimensionTables #CreatingFactTables #StarSchemaPreparation


RT PragmaticWorks: Want to unlock even more of the power that #PowerBI has to offer by learning the language called #M? Join superpowerbi as he provides a behind the scenes look at the #PowerQueryEditor! 6/18 at 11a.m. EST bit.ly/2XLKfQ9 #FreeT…

Integrating Natural Language Understanding with Power BI: lttr.ai/AL88R #KeyPhraseExtraction #PowerQueryEditor #ExtractingValuableInsights #PowerBiDesktop #IntegratingLanguageApis #IntegrateLanguageApis #AiInsightsFeature #DesiredLanguageApi #ExtractKeyPhrases #PowerBi
Wake up your #PowerBI reporting with #PowerQueryEditor! Join our live webinar on 3/17 to learn about the environment, how to remove rows and columns, merge and append queries, and create a new fact table. senturus.com/?p=13794


Power Query #day6 : Master the Power Query Interface in Minutes! #rpandeytutorials #powerqueryeditor #Day7 #ExcelTips #PowerQueryTutorial #ExcelInterface #LearnExcel #PowerBI #excelforbeginners @exceldictionary @DailyExcelsior1 #Twitter動画保存ランキング #Twitter婚活 #short
Power BI is built on three main layers: the Power Query layer, the data model layer, and the data visualization layer. ▸ lttr.ai/AI3ZW #PowerQueryEditor #PerformDataCleansing #SubsequentDataVisualization #InteractiveVisualReports #CoherentDataModel #PowerQueryLayer


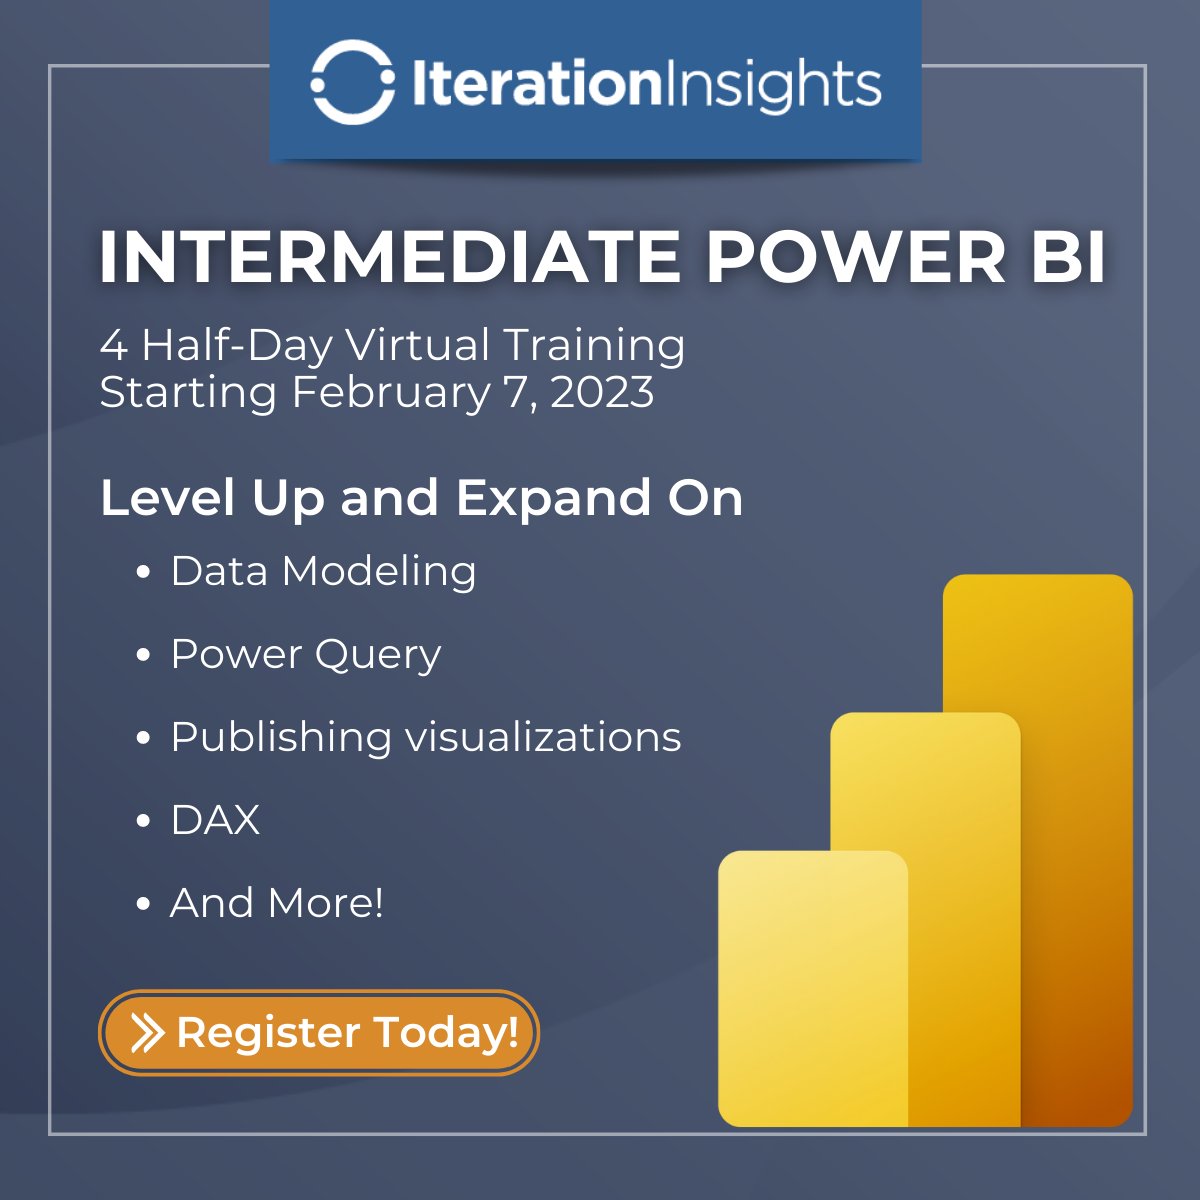
Expand on basic Power BI concepts while using #PowerQueryEditor, writing basic DAX expressions, publishing #DashboardVisualizations to end-users, and more. Claim your spot today! ow.ly/UYhQ50MsHoA
TRANSFORMING DATA Power query editor cleans data faster and handles larger datasets. #data #powerbi #powerqueryeditor
Power Query Calendar Trick Everyone Should Know youtube.com/shorts/KfA5aFw… via @YouTube #powerquery #powerqueryeditor #dashboard #excel #dataanalysis #calendar #fyp #pmo #financialcalendar #financialperiods
youtube.com
YouTube
Power Query Calendar Trick Everyone Should Know
In this tutorial, we show you how to use Power Query Editor to clean and prepare your dataset like a pro. Learn how to check Column Quality, Column Distribution, and Column Profile so you can trust your data before analysis #pixardataconsult #PowerQueryEditor #ColumnQuality
Power Query and Power Pivot Made Easy for Beginners youtu.be/OPDSQG7MzG0?si… via @YouTube #powerquery #powerqueryeditor #dashboard #excel #dataanalysis #calendar #fyp #pmo #powerpivot
youtube.com
YouTube
Power Query and Power Pivot Made Easy for Beginners
Power Query MAGIC Dynamic Calendar Secrets Revealed youtu.be/iJccmdTZ9TE?si… via @YouTube #powerquery #powerqueryeditor #dashboard #excel #dataanalysis #calendar #fyp #pmo #financialcalendar #financialperiods
youtube.com
YouTube
Power Query MAGIC Dynamic Calendar Secrets Revealed
Transform your #data in our 4 Half-Day virtual instructor-led course starting October 1st! Create interactive dashboards while learning #PowerQueryEditor, #DataModeling, creating custom #Visualizations, and more! Claim your spot today! ow.ly/aS7t50T2qPf

Transform your #data in our 4 Half-Day virtual instructor-led course starting May 7th! Create interactive dashboards while learning #PowerQueryEditor, #DataModeling, creating custom #Visualizations, and more! Claim your spot today! ow.ly/hMBx50Roa3H

Star Schema Preparation in Power Query Editor for Power Bi: lttr.ai/AMA6h #PowerQueryEditor #LowestRequiredGrain #KeyPerformanceIndicators #CreatingDimensionTables #CreatingFactTables #StarSchemaPreparation #EffectivelyIdentifyDimensions #IdentifyPotentialDimensions
Integrating Natural Language Understanding with Power BI: lttr.ai/AL88R #KeyPhraseExtraction #PowerQueryEditor #ExtractingValuableInsights #PowerBiDesktop #IntegratingLanguageApis #IntegrateLanguageApis #AiInsightsFeature #DesiredLanguageApi #ExtractKeyPhrases #PowerBi
With the data model, users can combine data from multiple sources and create calculated tables and columns using the powerful DAX (Data Analysis Expressions) language. 👉 lttr.ai/ALukU #PowerQueryEditor #PerformDataCleansing #SubsequentDataVisualization


✅There are a few ways you can use #Pythonscripts in Power BI: As a data source to import new data To enrich an existing data source in the #PowerQueryEditor To visualize data in the Power BI report canvas
We will cover topics such as identifying dimensions and facts, creating dimension tables, and creating fact tables. 👉 lttr.ai/AI5SE #PowerQueryEditor #LowestRequiredGrain #KeyPerformanceIndicators #CreatingDimensionTables #CreatingFactTables #StarSchemaPreparation
Power BI is built on three main layers: the Power Query layer, the data model layer, and the data visualization layer. ▸ lttr.ai/AI3ZW #PowerQueryEditor #PerformDataCleansing #SubsequentDataVisualization #InteractiveVisualReports #CoherentDataModel #PowerQueryLayer
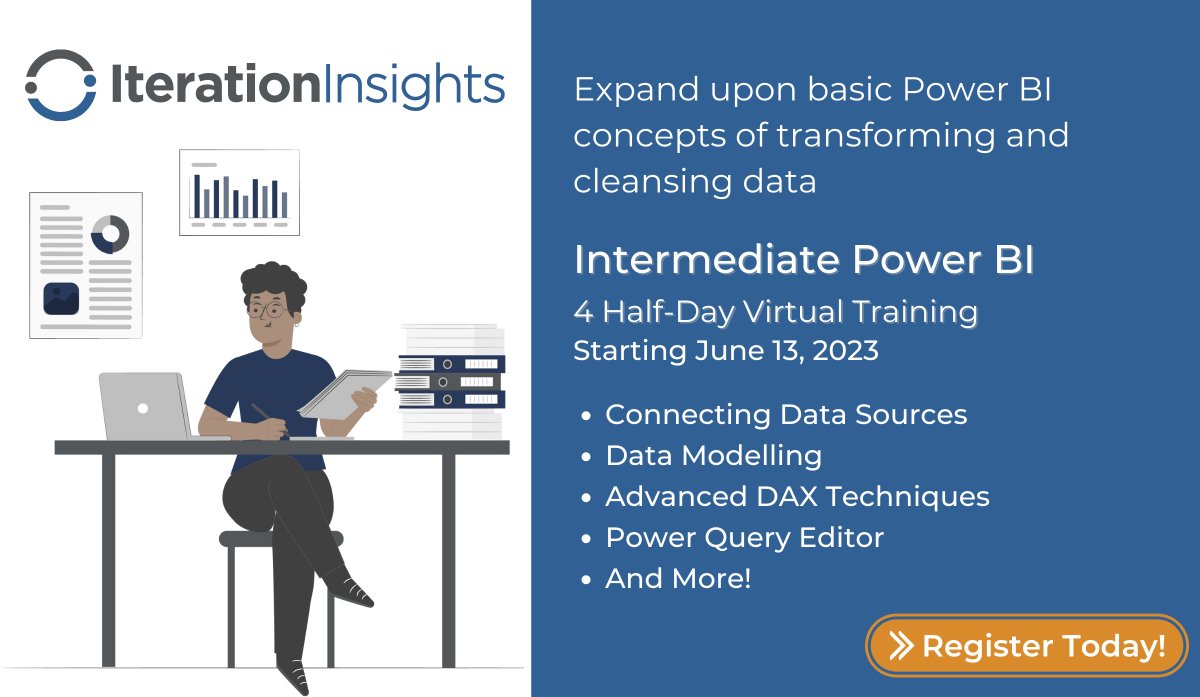
2️⃣ #DataAcquisition & Transformation: -Connecting to various data sources (Excel, CSV files) -Importing & transforming data using #PowerQueryEditor -Cleaning & shaping data through data transformation operation -Applying #datamodeling techniques for optimal analysis
For those of you writing custom M code in #powerquery and #powerbi go and get your own #PowerQueryEditor here goo.gl/yo45S9
Do you know the differences between #PowerQueryEditor and #DataWragler in #MicrosoftFabric? Today, I explained that in a blog and video here: radacad.com/data-wrangler-… #PowerQuery #DataFactory #Fabric #Microsoft #DataTransformation #ETL #DataScience #DataWarehouse

"Zero to Hero: A Beginner's Guide to Power BI" @tekkigurus Audrey Workman (@AudreyLWorkman) tekkigurus.com/zero-hero-begi… #PowerBI #DataAnalysis #PowerQueryEditor #Analyze #Visualization #Guide


Do you know the differences between #PowerQueryEditor and #DataWragler in #MicrosoftFabric? Today, @rad_reza explained that in a blog and video here: radacad.com/data-wrangler-… #PowerQuery #DataFactory #Fabric #Microsoft #DataTransformation #ETL #DataScience #DataWarehouse

Integrating Natural Language Understanding with Power BI: lttr.ai/AL88R #KeyPhraseExtraction #PowerQueryEditor #ExtractingValuableInsights #PowerBiDesktop #IntegratingLanguageApis #IntegrateLanguageApis #AiInsightsFeature #DesiredLanguageApi #ExtractKeyPhrases #PowerBi
Star Schema Preparation in Power Query Editor for Power Bi: lttr.ai/AMA6h #PowerQueryEditor #LowestRequiredGrain #KeyPerformanceIndicators #CreatingDimensionTables #CreatingFactTables #StarSchemaPreparation #EffectivelyIdentifyDimensions #IdentifyPotentialDimensions
We will cover topics such as identifying dimensions and facts, creating dimension tables, and creating fact tables. 👉 lttr.ai/AI5SE #PowerQueryEditor #LowestRequiredGrain #KeyPerformanceIndicators #CreatingDimensionTables #CreatingFactTables #StarSchemaPreparation
Power BI is built on three main layers: the Power Query layer, the data model layer, and the data visualization layer. ▸ lttr.ai/AI3ZW #PowerQueryEditor #PerformDataCleansing #SubsequentDataVisualization #InteractiveVisualReports #CoherentDataModel #PowerQueryLayer
Kick-off this Fall by transforming your #data in our Introduction to #PowerBI two-day instructor-led course! Create interactive dashboards while learning #PowerQueryEditor, #DataModeling, DAX, Visualizations, and more! Claim your spot today! ow.ly/yVjR50KswOX

Clean data is a 2-day webinar away! Expand on basic Power BI concepts while using #PowerQueryEditor, writing basic DAX expressions, and publishing #DashboardVisualizations to end-users. Register today! ow.ly/98OV50KBoc4

Expand on basic Power BI concepts while using #PowerQueryEditor, writing basic DAX expressions, publishing #DashboardVisualizations to end-users, and more. Claim your spot today! ow.ly/UYhQ50MsHoA
With the data model, users can combine data from multiple sources and create calculated tables and columns using the powerful DAX (Data Analysis Expressions) language. 👉 lttr.ai/ALukU #PowerQueryEditor #PerformDataCleansing #SubsequentDataVisualization
Introduction to #PowerBI is back starting Sept 19! Transform your data in our 4 Half-Day virtual instructor-led course! Create interactive dashboards learning #PowerQueryEditor, #DataModeling, creating custom #Visualizations, and more! Register today! iterationinsights.com/event/introduc…


Want to unlock even more of the power that #PowerBI has to offer by learning the language called #M? Join @superpowerbi as he provides a behind the scenes look at the #PowerQueryEditor! 6/18 at 11a.m. EST bit.ly/2XLKfQ9 #FreeTraining #TechNews
Clean data is a 4 Half-day webinar away! Expand on basic Power BI concepts while using #PowerQueryEditor, writing basic DAX expressions, publishing #DashboardVisualizations to end-users, and more. Claim your spot today! ow.ly/omIs50NRyBA
Transform your #data in our 4 Half-Day instructor-led course! Create interactive dashboards while learning #PowerQueryEditor, #DataModeling, creating custom #Visualizations, and more! Claim your spot today! iterationinsights.com/event/introduc…

There are still a few days left in 2022 to sign up for Power BI training to make a $50 donation to Calgary Meals on Wheels. Expand your #PowerBI skills in #PowerQueryEditor, #DataModeling, #Visualizations, and more! Claim Your Spot Today! ow.ly/8MxW50M9wbR

Join our webinar tomorrow to see how-to demos of #PowerBI data cleansing techniques using #PowerQueryEditor. bit.ly/2OFWHS3
Introduction to #PowerBI is back this fall! Transform your #data in our 4 Half-Day virtual instructor-led course! Create interactive dashboards while learning #PowerQueryEditor, #DataModeling, creating custom #Visualizations, and more! Register today! ow.ly/tosu50Pxyx5

RT PragmaticWorks: Want to unlock even more of the power that #PowerBI has to offer by learning the language called #M? Join superpowerbi as he provides a behind the scenes look at the #PowerQueryEditor! 6/18 at 11a.m. EST bit.ly/2XLKfQ9 #FreeT…
Something went wrong.
Something went wrong.
United States Trends
- 1. Bears 88.6K posts
- 2. Jake Moody 13.6K posts
- 3. Snell 24K posts
- 4. Falcons 51K posts
- 5. Caleb 48.6K posts
- 6. Bills 139K posts
- 7. Josh Allen 26.4K posts
- 8. Jayden 22.7K posts
- 9. #BearDown 2,355 posts
- 10. phil 172K posts
- 11. Swift 288K posts
- 12. Ben Johnson 4,383 posts
- 13. Joji 28.7K posts
- 14. #Dodgers 15.2K posts
- 15. Turang 4,297 posts
- 16. Troy Aikman 6,433 posts
- 17. Happy Birthday Charlie 7,351 posts
- 18. Roki 6,055 posts
- 19. Bijan 32.6K posts
- 20. Brewers 48.2K posts