#powerbi search results

If you’re lucky, users will tell you your dashboard needs rework. Most of the times though, they will just quietly stop using it and request a new report. 😅 #powerbi #report #design #uxui #ux #ui
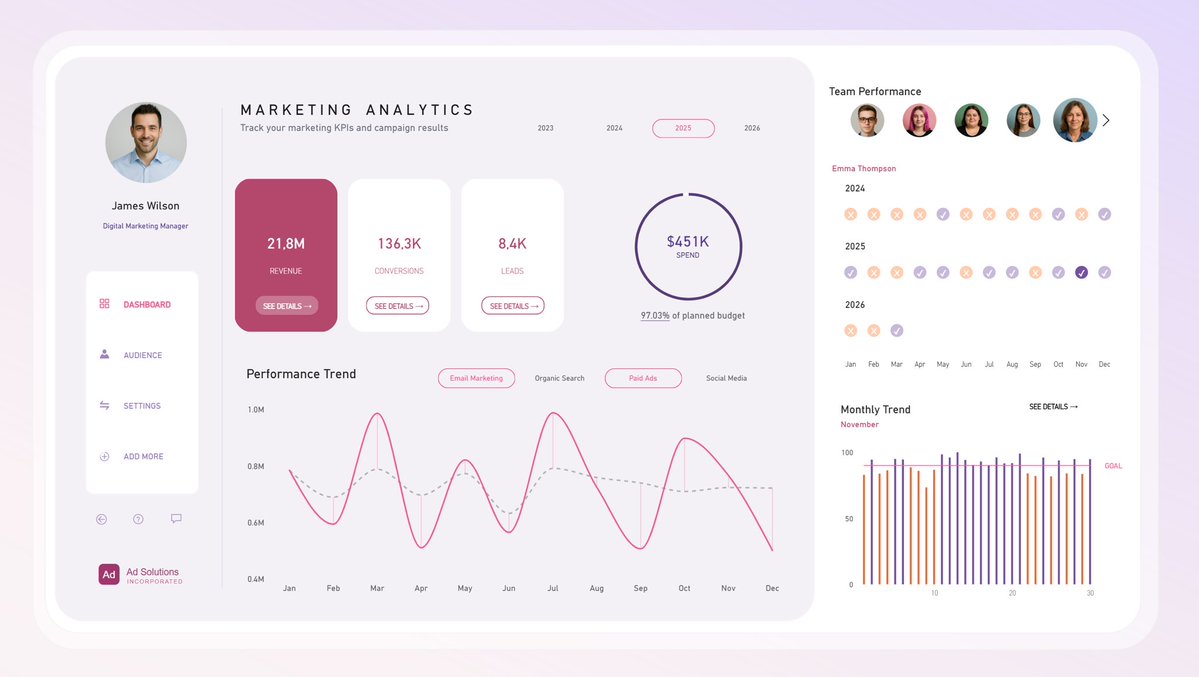

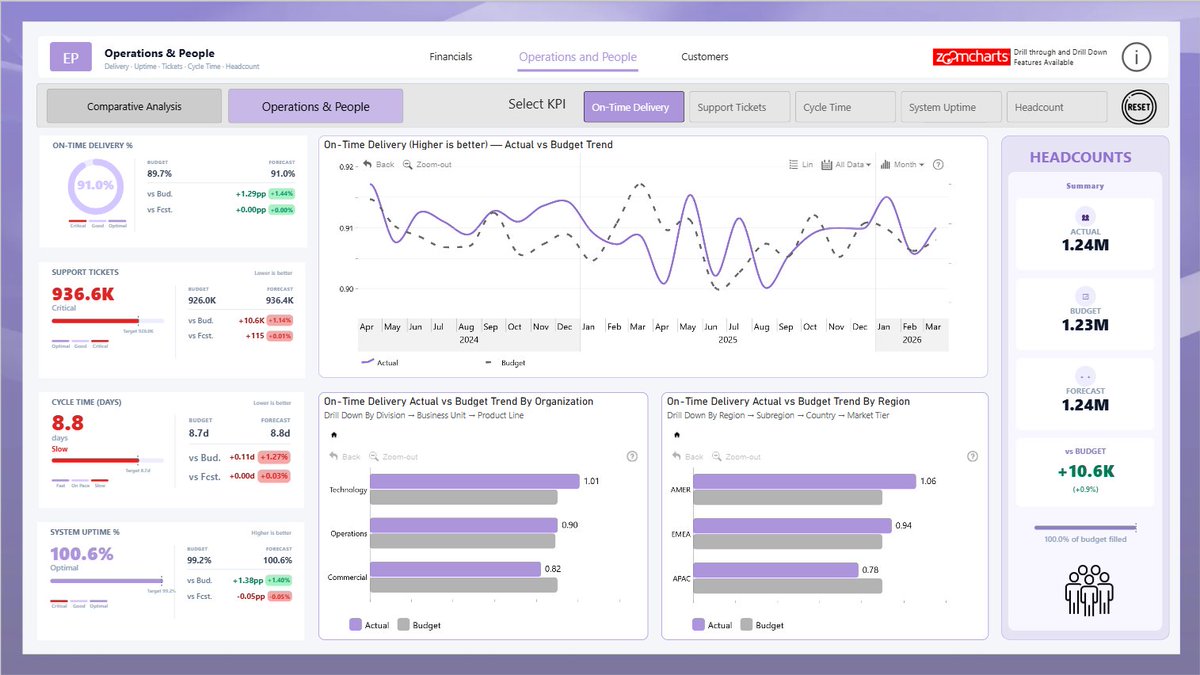
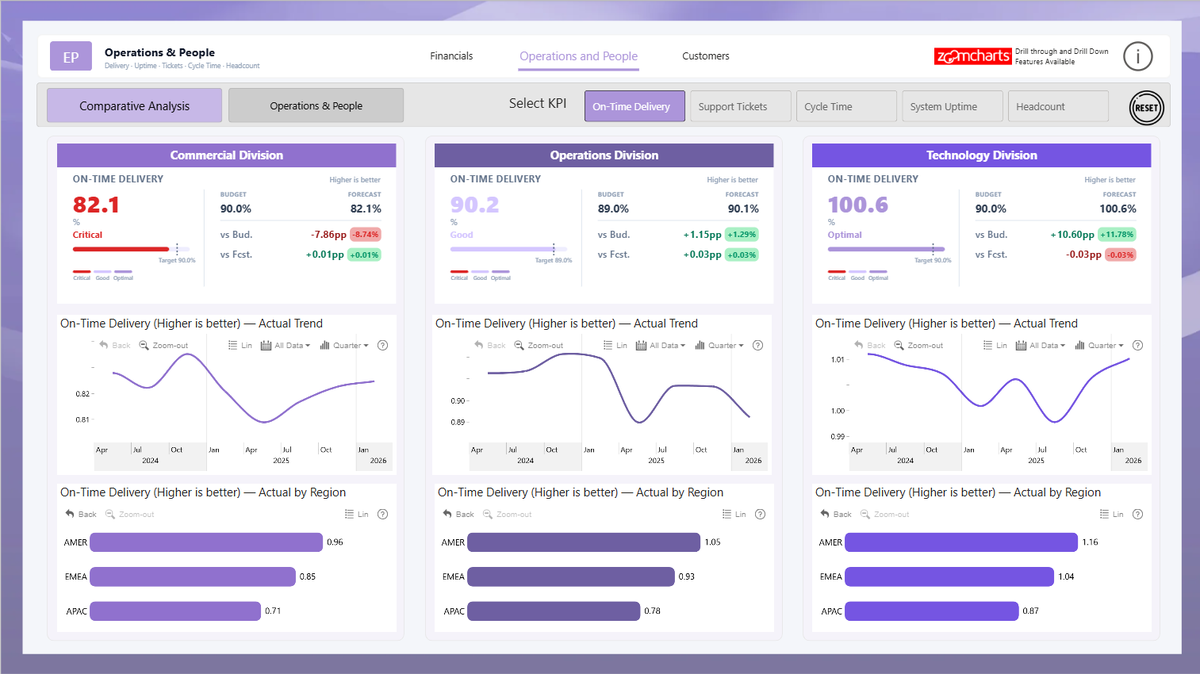
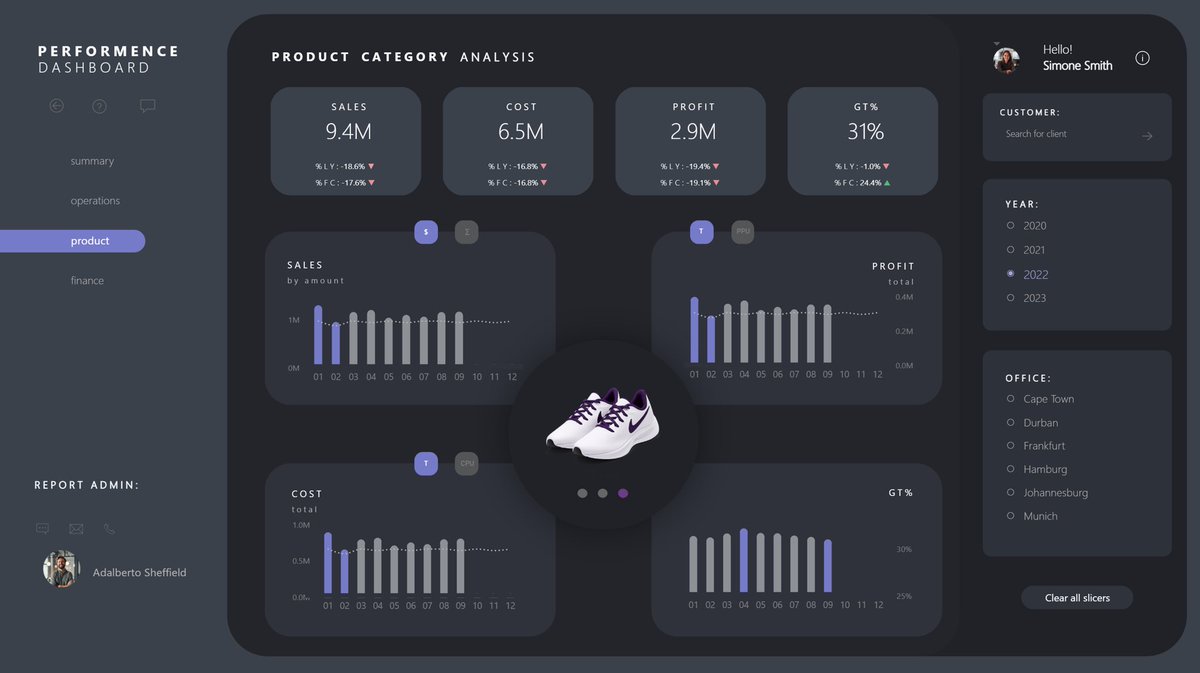
10 KPIs. One question: are we on track? Built an Executive KPI Dashboard in @MSPowerBI Financials → Operations → Customers Budget vs Actual vs Forecast Custom DAX + HTML/SVG cards Check out Zefas BI youtube.com/@ZefasBi-Analy… for more BI projects. #PowerBI @ZoomCharts


519: New projects unveiled! Featuring Kurt Buhler & Maxim's Power BI Report CLI tool. Boost your workflow. #PowerBI #DevTools


How to Add Conditional Column in Power BI [Using Power Query] spguides.com/power-bi-condi… #PowerBI
spguides.com
Add Conditional Column in Power BI using Power Query
Learn how to add a conditional column in Power BI using Power Query. Follow this step-by-step guide to create dynamic columns based on specific conditions!
3️⃣ Power BI habits that make you SENIOR: 1. You ask spot-on questions before opening any file. 2. You think in decisions, not visuals. 3. You are able to simplify what others overcomplicate. #powerbi #skills #senior #data #analytics

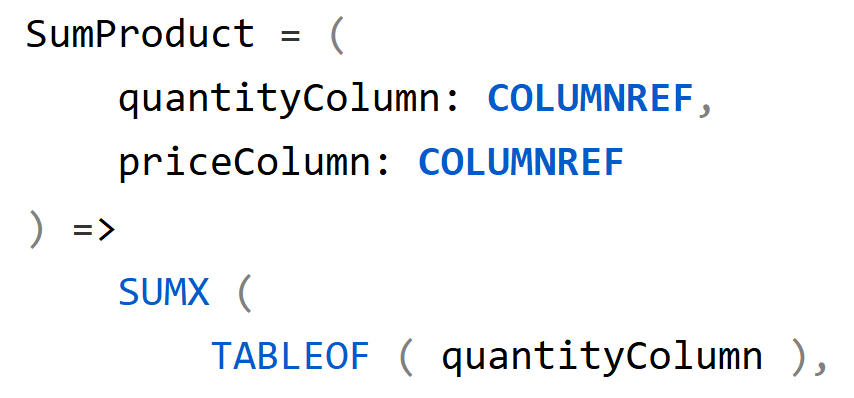
This article+video describes the parameter types available in DAX user-defined functions, focusing on the specialized reference types MEASUREREF, COLUMNREF, TABLEREF, and CALENDARREF. #dax #powerbi sqlbi.com/articles/under…


Power BI tip that'll blow your mind Use CALCULATE() with multiple filters instead of nested IFs. Old way: ❌ IF(condition1, IF(condition2, value)) New way: ✅ CALCULATE(SUM(Sales), Filter1, Filter2) Cleaner. Faster. More maintainable. #PowerBI #DataAnalytics #DAX #tech


How to end up with 5,000 useless reports: „We need a report.” Ok ✅ „Let’s change a few things” Ok ✅ „I am not sure it this is so insightful. Need to think about it“ Ok ✅ „I have an idea for a new report. Let’s meet tomorrow“ Ok ☑️ Repeat #powerbi #analytics #reporting


صمم تقرير يُفهم من أول نظرة ! من خلال دورة Power BI ستتعلم كيفية تحليل البيانات وعرضها بشكل بصري احترافي ابدأ رحلتك اليوم وامتلك مهارة مطلوبة في سوق العمل📊 🌐:alfac.edu.sa واتساب:0555744916 مركزالاتصال:920000840 #PowerBI #DataAnalytics #أكاديمية_الفيصل_العالمية

Module 4 coming soon + subtitles in 17 languages! ✌🏻 Sign up now - Module 4 is already included. #powerbi #udfs #data #analytics


Beyond the numbers, this project helped me build patience and strengthen my Power BI skills, especially in creating KPIs and working with DAX. I’m continuously learning, improving, and open to feedback. #PowerBI #DataAnalytics #DashboardDesign #LearningJourney

How to Sort Matrix Column Headers in #PowerBI ? enjoysharepoint.com/sort-matrix-co…

Day 13 of learning Power BI 👀 Today I went a bit deeper… Learned about: • Data Warehouse • OLTP vs OLAP • Data Catalog Now I’m starting to understand Power BI is not just dashboards it’s about how data actually flows 📊 Still learning, step by step 🚶♂️ #PowerBI

How to Add Conditional Column in Power BI [Using Power Query] spguides.com/power-bi-condi… #PowerBI
spguides.com
Add Conditional Column in Power BI using Power Query
Learn how to add a conditional column in Power BI using Power Query. Follow this step-by-step guide to create dynamic columns based on specific conditions!
Power BI tip that'll blow your mind Use CALCULATE() with multiple filters instead of nested IFs. Old way: ❌ IF(condition1, IF(condition2, value)) New way: ✅ CALCULATE(SUM(Sales), Filter1, Filter2) Cleaner. Faster. More maintainable. #PowerBI #DataAnalytics #DAX #tech
519: New projects unveiled! Featuring Kurt Buhler & Maxim's Power BI Report CLI tool. Boost your workflow. #PowerBI #DevTools
Beyond the numbers, this project helped me build patience and strengthen my Power BI skills, especially in creating KPIs and working with DAX. I’m continuously learning, improving, and open to feedback. #PowerBI #DataAnalytics #DashboardDesign #LearningJourney

Day 41 💻 Today I explored Power BI → Bar, Stacked & 100% charts → Column & Stacked Column charts → Aggregations Started digging into features more deeply ⚡ #PowerBI #DataAnalytics #LearningInPublic

R and Python visuals in Power BI embedded scenarios stop rendering this month. If your 'Embed for customers' reports use them, those charts just go blank. Not a soft deprecation — they break. If this applies to you, migration shouldn't wait. #PowerBI #PowerPlatform

التحقت بدورتي Excel وPower BI بناءً على توصية الأستاذ @ABDULMAJEEDFUL ، وكانت تجربة مميزة 👏🏻 مدربين محترفين وأسلوب واضح، اكتسبت مهارات عملية في تحليل البيانات أطبقها مباشرة في الموارد البشرية. خطوة قوية في تطوير مسيرتي المهنية. #HR #PowerBI #Excel


519: New features simplify Power BI UI. Straightforward Git workflow for team collaboration. #PowerBI #Git
Replace Last Character from String in Power Automate enjoysharepoint.com/replace-last-c… #powerbi
enjoysharepoint.com
Replace Last Character from String in Power Automate
Learn how to replace the last character from a string in Power Automate. Follow this simple guide to clean and format text data effectively in your flows.

I’ll be spending more time here. I need it to really stick! #PowerBI #DataAnalytics #LearningInPublic

🚀 Top 5 Data Careers this year. From BI Analysts to AI Specialists, data jobs are evolving fast — and the demand keeps growing! 📈 Master tools like Power BI, Excel & Tableau to start your data journey today. 💡 👉 #data #powerbi #excel #tableau #datacareer
519: Embed Power BI in Teams, use bookmarks to share report states, and ensure consistent review. #PowerBI #MicrosoftTeams

Hi Guys, I have released an youtube content explaining Power Query Editor features. Do find it using the below link and please like, comment and share in your network youtu.be/V59LfnBvYyg #PowerBI #Data #Analytics #DataWorks

ブログ更新しました〜 【Power BI】使用回数を可視化するレポートを作ってみた - 改善紀 flow-with-tech.com/copilot-usage-… #PowerBI #改善紀 @kama_bizdevより

Display Average Instead of Total in Power BI Matrix Visual enjoysharepoint.com/power-bi-matri… #powerbi
enjoysharepoint.com
Power BI Matrix Display Average Instead of Total
Learn how to display average values instead of totals in a Power BI Matrix visual using DAX and formatting options to enhance your report insights with examples.


Accessibility isn’t “extra.” It’s the bare minimum for interactive reports. Want our checklist you can reuse every time? Comment KEYBOARD and we’ll send it. #PowerBI #ExcelDashboard #DataVisualization #Accessibility #BusinessIntelligence


If you’re lucky, users will tell you your dashboard needs rework. Most of the times though, they will just quietly stop using it and request a new report. 😅 #powerbi #report #design #uxui #ux #ui
10 KPIs. One question: are we on track? Built an Executive KPI Dashboard in @MSPowerBI Financials → Operations → Customers Budget vs Actual vs Forecast Custom DAX + HTML/SVG cards Check out Zefas BI youtube.com/@ZefasBi-Analy… for more BI projects. #PowerBI @ZoomCharts
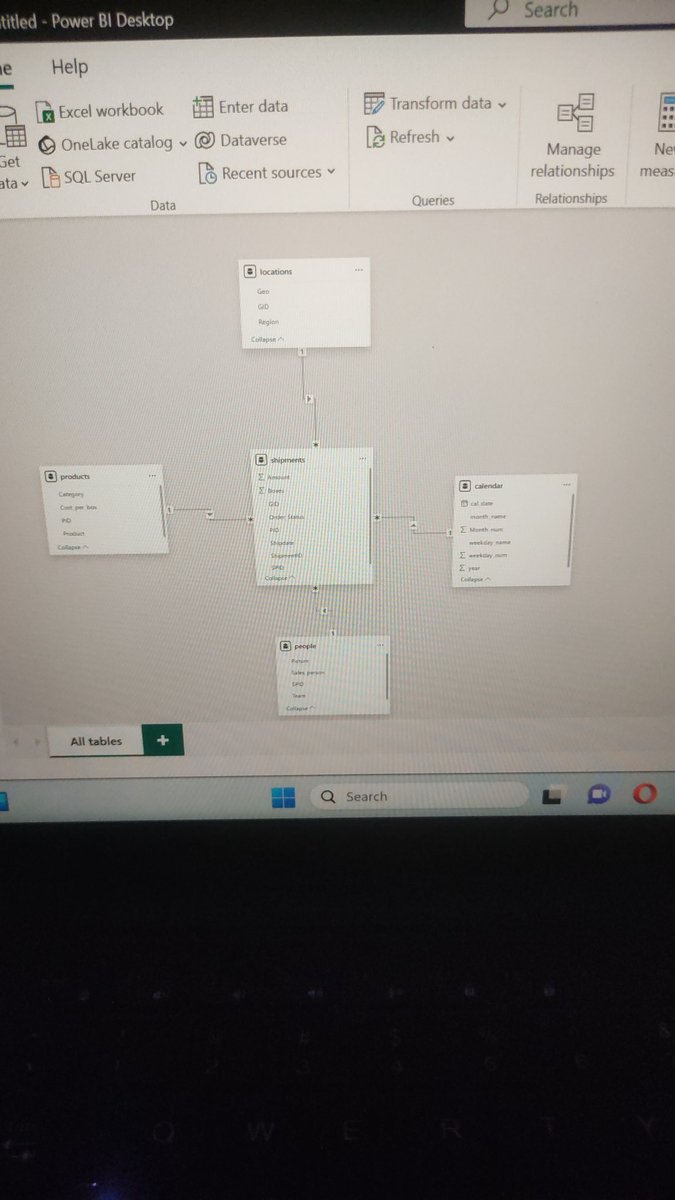
Day 7/15 of #15DaysOfPowerBI. I practiced building a star schema using a dataset with 5 tables and created relationships between them. I also built a few simple visuals to see how the model interacts with the data and everything is starting to make more sense 👏👏 #PowerBI
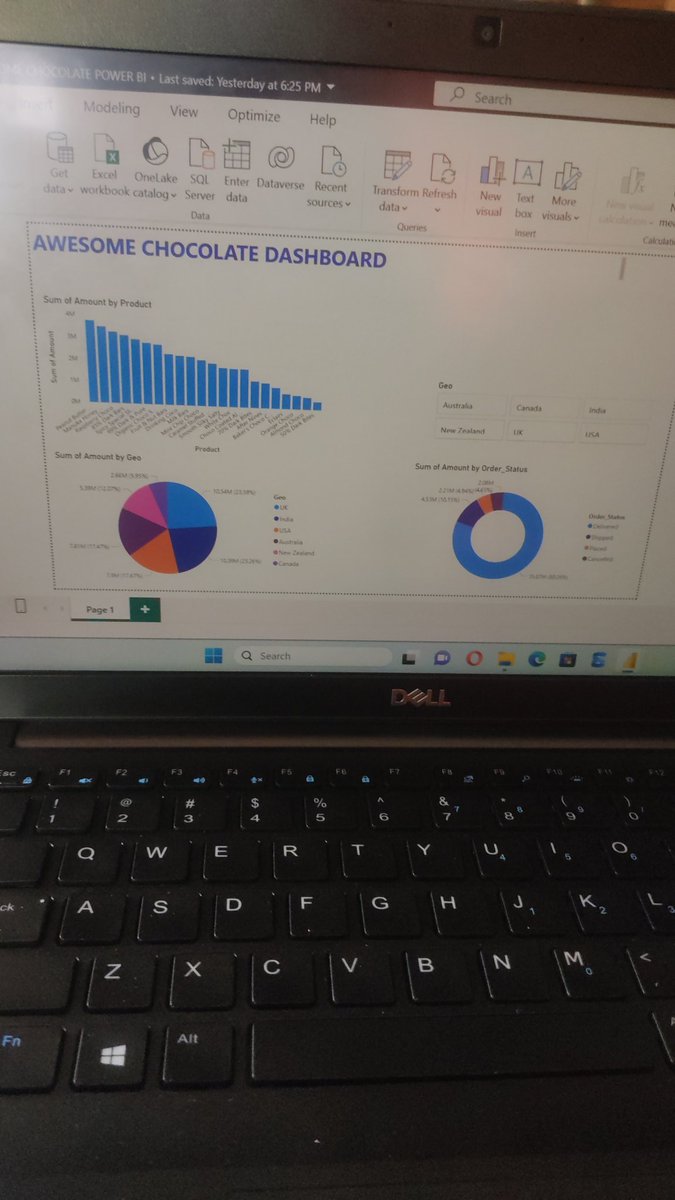

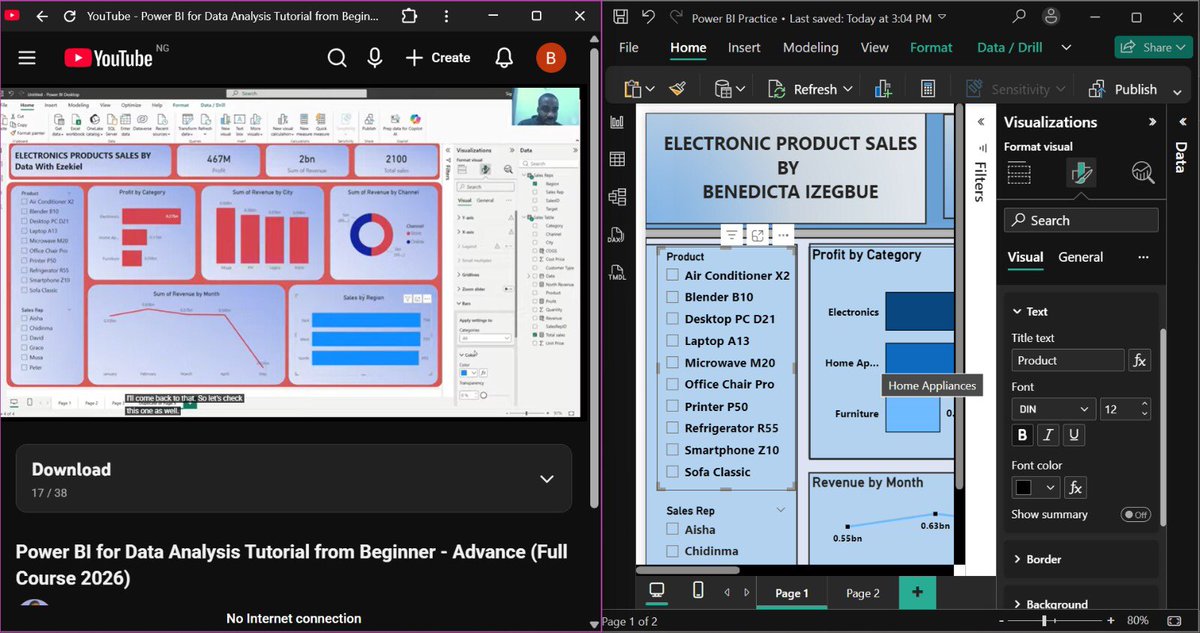
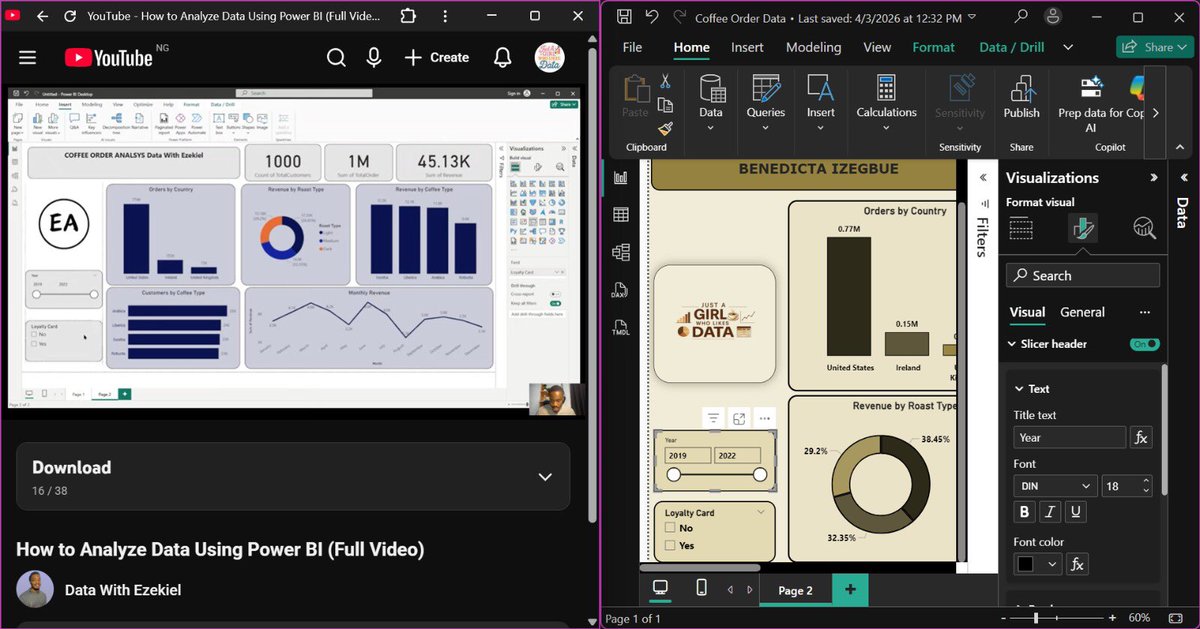
Day 50. Two of the dashboards done by our data analytics tutor @ezekiel_aleke replicated by me using his Power BI YouTube tutorial videos.😊😊 @TechSphereAcad #day50 #60DaysOfTech #powerbi #visualizations #LearningWithTS #justagirlwholikesdata💕


How to end up with 5,000 useless reports: „We need a report.” Ok ✅ „Let’s change a few things” Ok ✅ „I am not sure it this is so insightful. Need to think about it“ Ok ✅ „I have an idea for a new report. Let’s meet tomorrow“ Ok ☑️ Repeat #powerbi #analytics #reporting

1. Before any analysis, I set up the star schema for LagosLink Express 🗄️ 5 tables: 1 fact table (fact_deliveries) and 4 dimensions — zone, courier, date, and failure reason. Primary keys on all tables, foreign keys wired from the fact table back to each dimension. #SQL #PowerBI

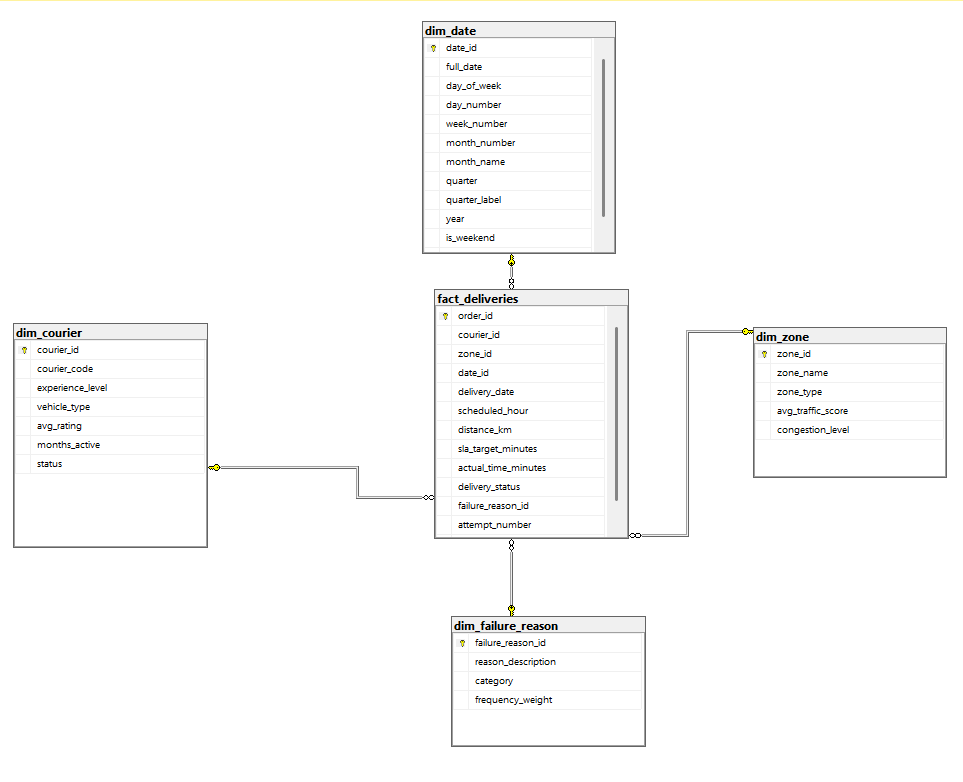
Hello #datafam, I just kicked off a new SQL + Power BI project, where I'll be analysing data for a Lagos-based delivery company I’ll be documenting my progress in the quotes — from schema to dashboard.
3️⃣ Power BI habits that make you SENIOR: 1. You ask spot-on questions before opening any file. 2. You think in decisions, not visuals. 3. You are able to simplify what others overcomplicate. #powerbi #skills #senior #data #analytics
Module 4 coming soon + subtitles in 17 languages! ✌🏻 Sign up now - Module 4 is already included. #powerbi #udfs #data #analytics


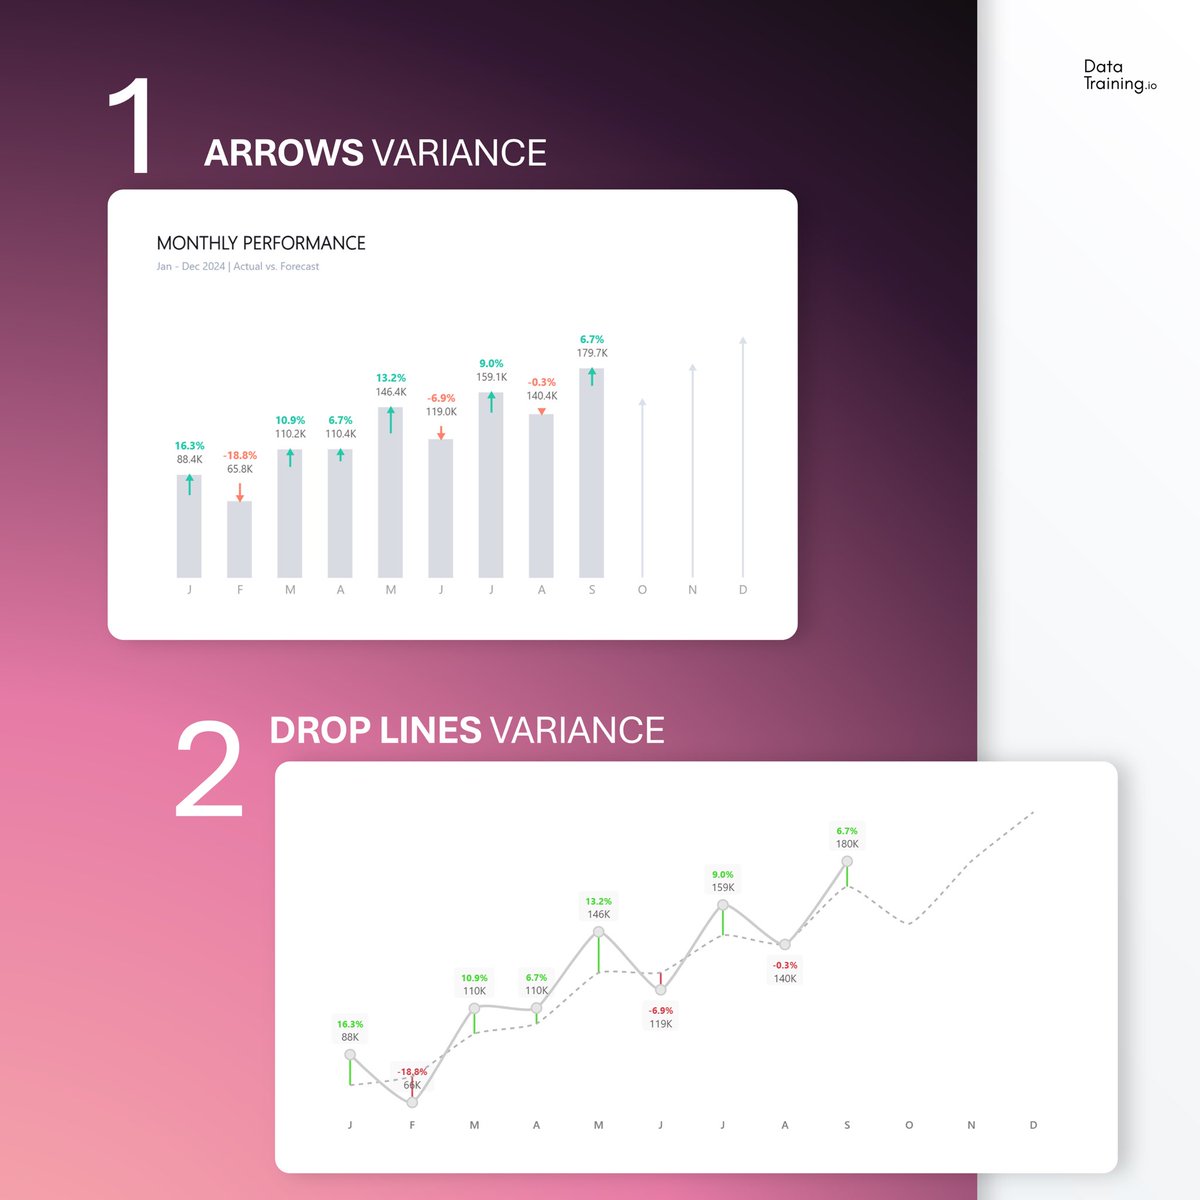
3 visuals to show the difference in Power BI Which one is your favorite? #powerbi #visualization #skills


Currently learning how dashboards tell stories with data 📊 Not just charts… but insights. #PowerBI #LearningInPublic
This article+video describes the parameter types available in DAX user-defined functions, focusing on the specialized reference types MEASUREREF, COLUMNREF, TABLEREF, and CALENDARREF. #dax #powerbi sqlbi.com/articles/under…

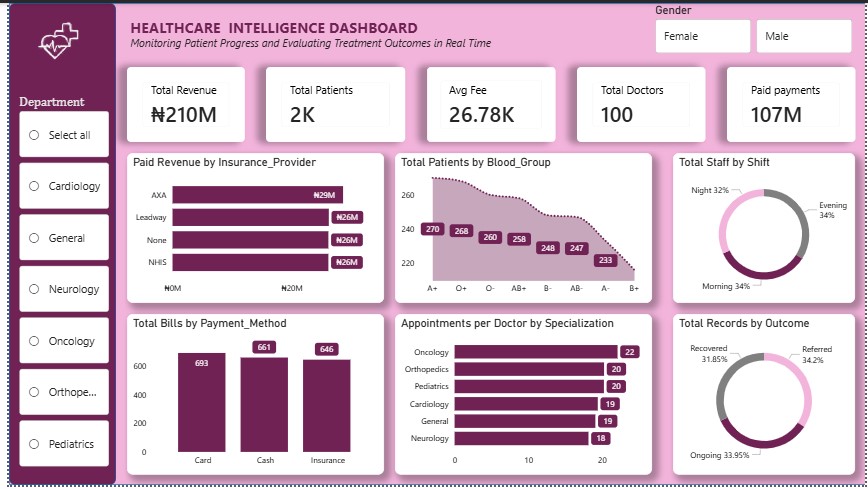
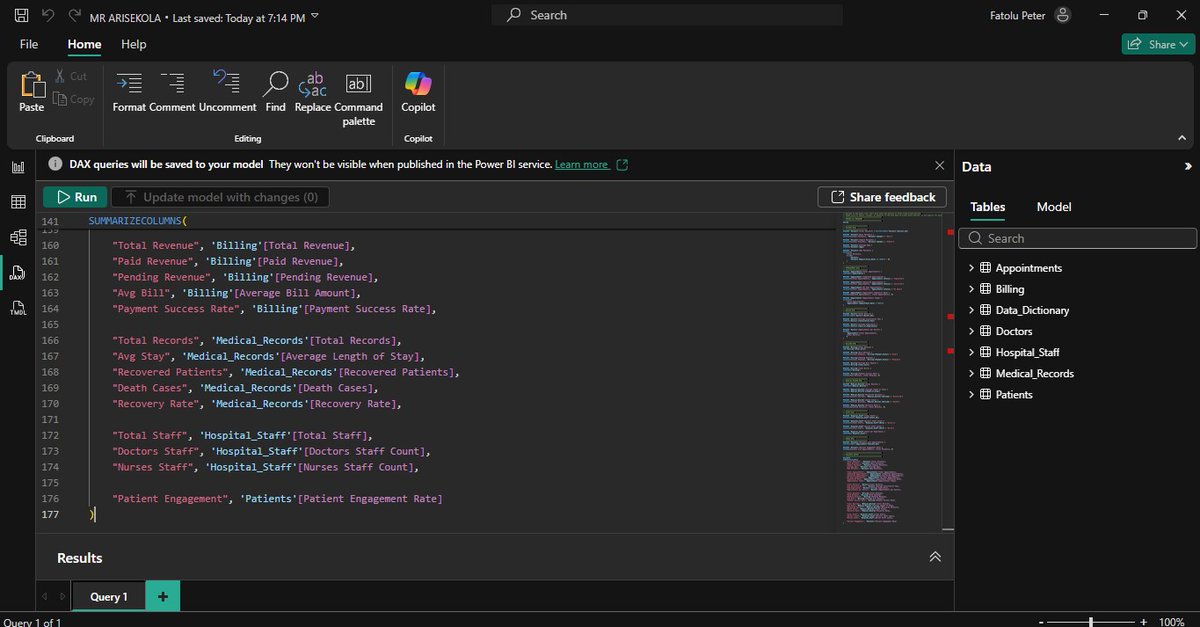
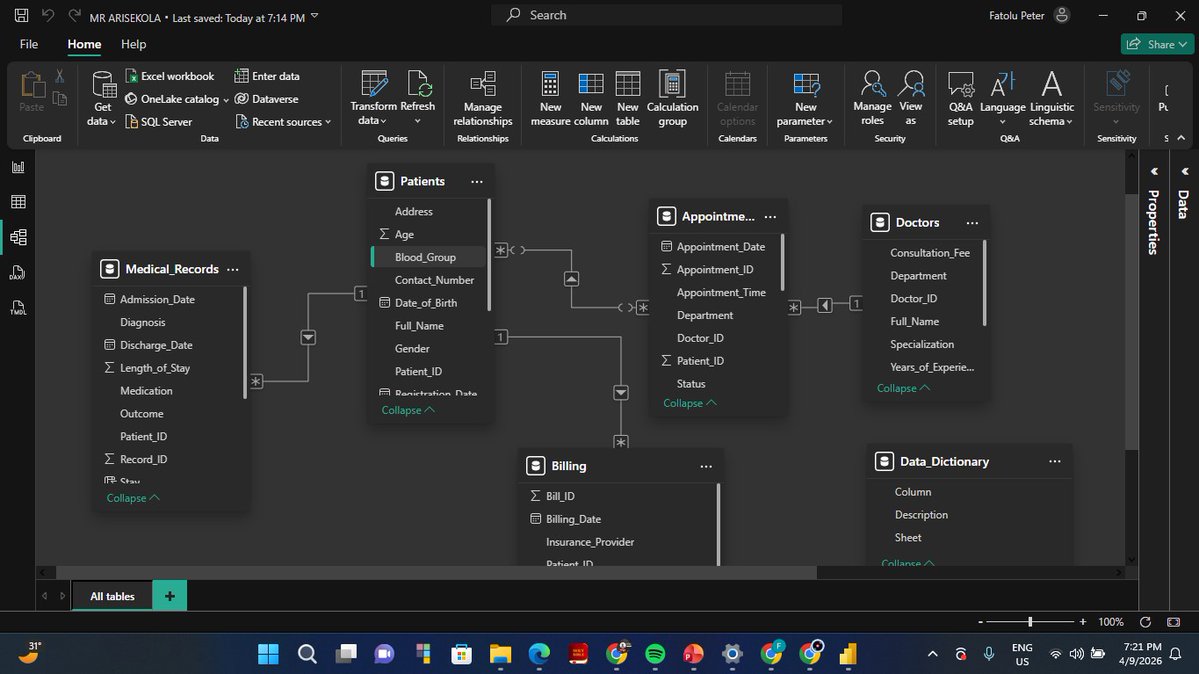
Built this in class today 🚀 My students created a full Healthcare Intelligence Dashboard in Power BI — from data model ➝ star schema ➝ DAX ➝ final visuals. Real skills. Real results. 📊 #PowerBI #DataAnalytics #DAX #DashboardDesign

Something went wrong.
Something went wrong.
United States Trends
- 1. #COYS N/A
- 2. Villa N/A
- 3. Ryan Walker N/A
- 4. Mo Wagner N/A
- 5. Ben Rice N/A
- 6. #MiamiGP N/A
- 7. Chase Burns N/A
- 8. Duncan Robinson N/A
- 9. Lauren Betts N/A
- 10. Rolling Stone N/A
- 11. Tottenham N/A
- 12. Kimi Antonelli N/A
- 13. Leclerc N/A
- 14. De Zerbi N/A
- 15. Braxton Ashcraft N/A
- 16. Liverpool N/A
- 17. #RaiseIt N/A
- 18. #Wurth400 N/A
- 19. ALL RISE N/A
- 20. Carrick N/A