#rprogramming 搜索结果

IN PHOTOS | The Philippine Statistics Authority–Mountain Province conducted the Provincial-Level Training on R Programming and Data Management using the 2024 CBMS data on December 1–5, 2025, at Diadem’s Restaurant in Samoki, Bontoc. #CBMS #swaknadatos #RProgramming


Data Science & Analytics are transforming Cameroon! From health to agriculture & business, data-driven decisions are shaping national development. Training programs like #InternationalTraining2025 are building the skills to lead this change. #DataScience #RProgramming #Cameroon


Climate change impact is real, but decoding its complex data shouldn’t be overwhelming. Discover how visualization using R brings clarity, meaning, and precision to climate insights. Discover more tinyurl.com/yz9vkphh #ClimateData #RProgramming #DataVisualization


What Are The Advantages Of R Programming? 𝐑𝐞𝐚𝐝 𝐎𝐮𝐫 𝐋𝐚𝐭𝐞𝐬𝐭 𝐁𝐥𝐨𝐠𝐬: cromacampus.com/blogs/what-are… 𝐅𝐨𝐫 𝐅𝐫𝐞𝐞 𝐂𝐨𝐧𝐬𝐮𝐥𝐭𝐚𝐭𝐢𝐨𝐧 𝐂𝐚𝐥𝐥/𝐖𝐡𝐚𝐭𝐬𝐚𝐩𝐩:+91-9711526942 #RProgramming #LearnR #RStats #RLanguage #RForDataScience #RDev #RCode


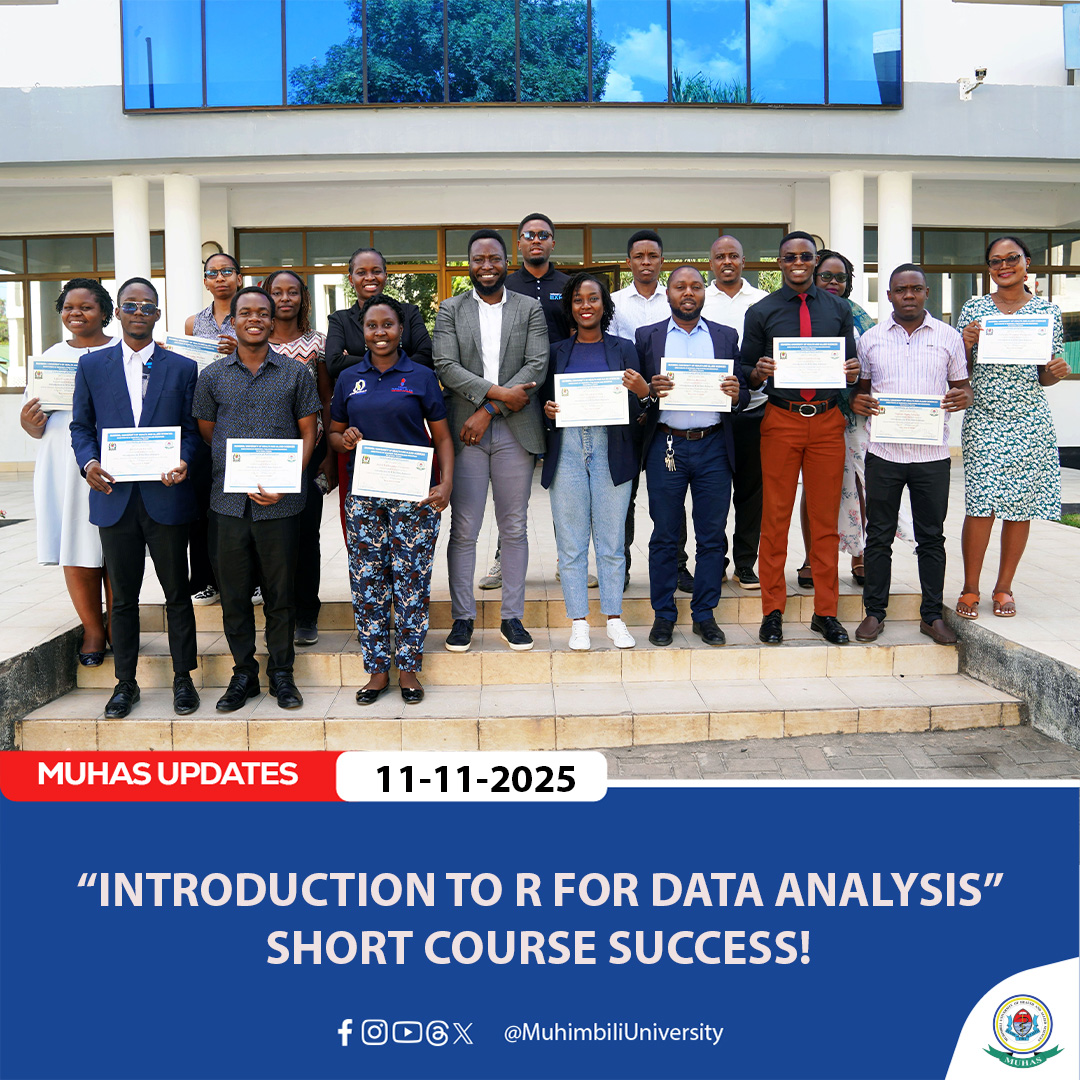
Participants of the recent short course, held at the MUHAS Harvard Boardroom (CHPE), are now equipped with essential data analysis skills. #MUHAS #DataAnalysis #RProgramming #ShortCourse #CHPE

Logistic regression uses a binary outcome (like diabetes) & multiple predictors. Which combo best predicts the outcome? This video breaks down building the model in R, step-by-step. #LogisticRegression #RProgramming

🚀 Your Pathway to Becoming a Successful Python / R Programmer Starts Here! 💻 📞 Call: +91 88005 95295 🌐 Visit: pinakiithub.com #PythonProgramming #RProgramming #DataScience #MachineLearning #PinakiITConsultant #TechEducation #FutureReady #LearnCoding #CareerGrowth


On 27 October 2025, I hosted an Intro to #RProgramming session for our 1st year MSc Data Science with Business Analysis class, focusing on definition analysis! 🚀 Gamification bridges all generations Millennials, Boomers, Gen Z alike boosting engagement & skills. #BusinessAnalyz


Your First Multiple Linear Regression in R - A Complete Tutorial with Code | The Academic Papers UK Learn more here: theacademicpapers.co.uk/blog/2025/10/2… - - - #RProgramming #DataAnalysis #StatisticsTutorial #MachineLearning #LinearRegression #DataScience #CodingForBeginners


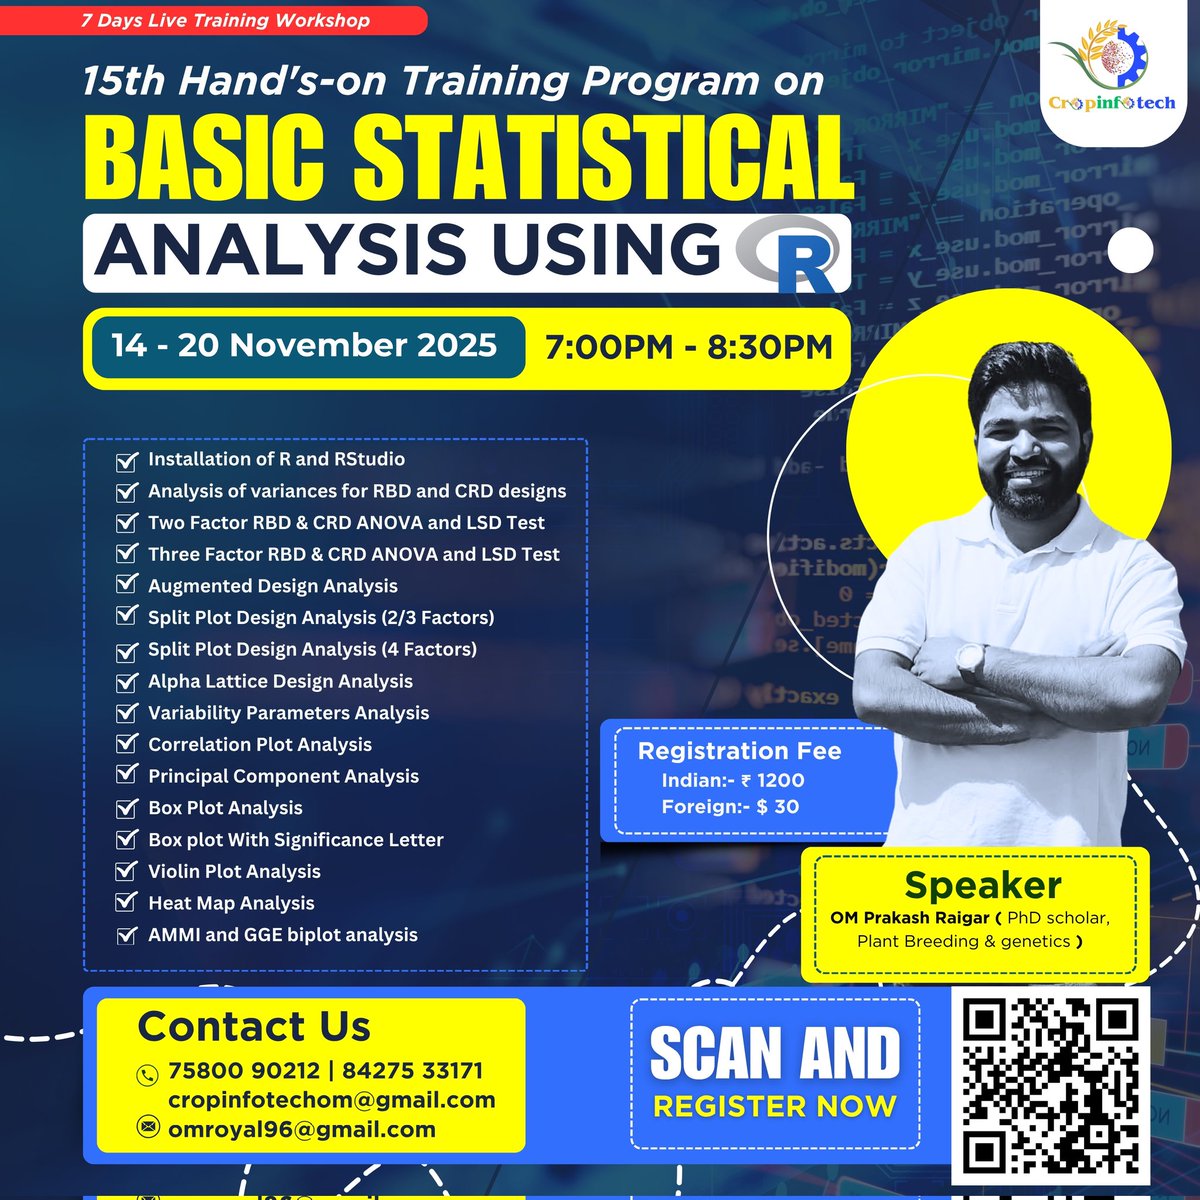
🚀 Master the Power of Data with R! 👉 Register Now – Limited Seats Available! 🔗 cropinfotech.in #RProgramming #StatisticalAnalysis #CropInfotech #DataScience #RTraining #PlantBreeding #AgriculturalResearch #Workshop #LearningByDoing #ResearchTools
Something went wrong.
Something went wrong.
United States Trends
- 1. Chiefs 109K posts
- 2. Mahomes 39.6K posts
- 3. Kelce 24.6K posts
- 4. Texans 47.3K posts
- 5. #ITWelcomeToDerry 63.2K posts
- 6. Andy Reid 6,843 posts
- 7. #BaddiesUSA 30.3K posts
- 8. Rashee Rice 9,194 posts
- 9. Collinsworth 6,721 posts
- 10. Stroud 10.6K posts
- 11. Pennywise 31.6K posts
- 12. #HOUvsKC 2,124 posts
- 13. doyoung 245K posts
- 14. #HTownMade 3,011 posts
- 15. Jeff Kent 8,969 posts
- 16. jungwoo 262K posts
- 17. AFC West 5,122 posts
- 18. Nagy 2,419 posts
- 19. Chris Jones 2,754 posts
- 20. Pitre 6,624 posts