#datviz search results

% of young adults (18-34) who oppose gay marriage in Europe: 🇬🇪Georgia 94% 🇷🇺Russia 86% 🇺🇦Ukraine 82% 🇭🇺Hungary 52% 🇬🇷Greece 51% 🇵🇱Poland 50% 🇮🇪Ireland 20% 🇫🇷France 17% 🇩🇪Germany 15% 🇳🇴Norway 14% 🇬🇧UK 13% 🇫🇮Finland 12% 🇪🇸Spain 7% 🇸🇪Sweden 5% #Maps #Mapping #Datviz #GayMarriage


Guess I got a bit side-tracked while creating some (mostly bad) color palette examples for a #datviz training... 1. sequential 2. diverging 3. rainbow 4. qualitative (used for quantitative data)


#DatViz of earthquakes from inside the Earth🌏 by @nicolaraluk via @TrustMyScience #Science #BigData #3D @alvinfoo @TopCyberNews @chboursin @mvollmer1 @Julez_Norton @AudreyDesisto @NevilleGaunt @JoannMoretti @Fabriziobustama @ArkangelScrap @JolaBurnett @enricomolinari @robvank
#DatViz of earthquakes from inside the Earth🌏 by @nicolaraluk v/ @TrustMyScience #Science #BigData #3D @alvinfoo @chboursin @mvollmer1 @Julez_Norton @AudreyDesisto @NevilleGaunt @JoannMoretti @Fabriziobustama @Ronald_vanLoon @kalydeoo @HeinzVHoenen @KaiGrunwitz @YuHelenYu

My daily #datviz: #OhioCoronavirus cases up by 590 now total 46,127 (a 1% increase). Hospitalizations increase by 87 (a 1% increase). Deaths increase by 31 bringing the total deaths to 2,735 (a 1% increase).


tl;dr - A visual breakdown of @GeorgiaTech papers at #CHI2021 with all authors, including collaborators and orgs. Interactive #datviz: public.tableau.com/views/GeorgiaT…


Another SQL formula breakthrough - changing subscore titles for selected tests. Planning on adding this feature to future state testing and @NWEA MAP reports. #Datastudio #Datviz #Storytellingwithdata #OETC22

#datviz 📈📉Does anyone know the origin of this SUNBURST chart? I'm pretty sure it came from twitter, but can no longer find the source.

The world's #earthquakes greater than magnitude 4, every month, 2000-2015. Each dot is a quake. The brighter the dot, the bigger the quake. Source: 422 South #Datviz #DataScience #DataVisualization


Data visualisation in the era of social media - another fantastic set of slides by @jburnmurdoch regarding #ddj and impactful #datviz buff.ly/2u5FjLm


Family photo album to Costa Rica expresses as color palettes. Fun and something different (for me). @tableaupublic tabsoft.co/2ENCOj5 #datviz #tableau


🚀 Course Alert: Advanced #Python for Life Sciences 📅 Three days of diving into data science with Python. Perfect for getting your foundational skills in machine learning & #datviz and mastering typical workflows🧬🐍 physalia-courses.org/courses-worksh…

Who and what from @GeorgiaTech will you find this week at #SIGCSE2019? Check out our overview of #CSEducation research and stick around for the #datviz conversation starters. gvu.gatech.edu/sigcse-2019

#psy6135 #datviz Topic last week, Human Factors: How to tell what works. 📊 Slides: friendly.github.io/6135/lectures/…


•In Latin America and the Caribbean since 2010, the pooled mean sodium consumption was ~4.13 g/day •The pooled mean sodium consumption from national samples was smaller than that from community samples. Paper: bit.ly/2VcHoRB #DatViz: bit.ly/32eFxgH


RECRUITMENT DIVERSITY & PAY EQUITY DASHBOARD 📊 I found a Human Resources dataset and wanted to tell a story with it, to find insights on recruitment diversity and pay equity across gender, ethnicity, and global regions. I learnt a lot in the process. #Datafam #Datviz #PowerBI


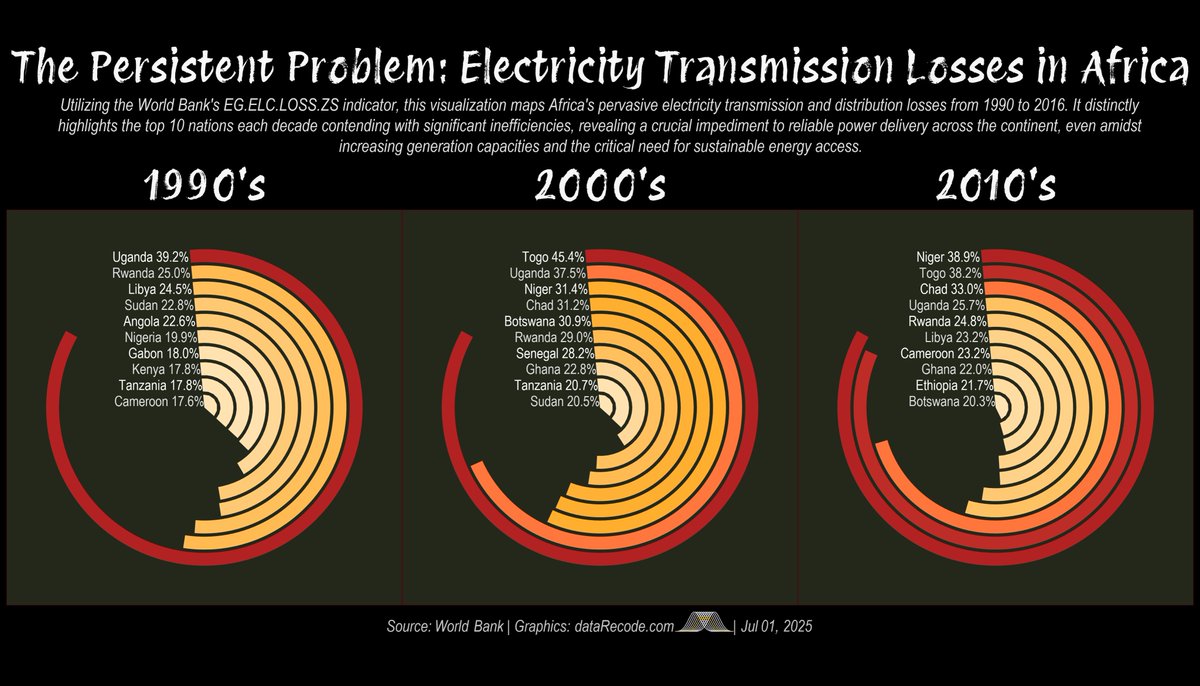
High electricity transmission losses negate Africa's increased generation capacity. Our lates analysis and dataviz (1990-2016), spotlighting the top 10 African nations for each decade. For deeper analysis, contact us at [email protected] #energy #datviz #rstats #africaenergy

NEW: Ukrainian forces lose ground in Kursk region as they fight on without US support. Read @fabrice_deprez and @NastyaStognei's report ft.com/content/05130a… #datviz
🚀 Course Alert: Advanced #Python for Life Sciences 📅 Three days of diving into data science with Python. Perfect for getting your foundational skills in machine learning & #datviz and mastering typical workflows🧬🐍 physalia-courses.org/courses-worksh…

I've finally reached the halfway mark! 🎉 In the June edition of my monthly #datviz journey, I was inspired by @ed_hawkins 'Warming Stripes' to explore temperature changes in the UK (1884-2023) ☀️ Link: tabsoft.co/3zpLMmr #datafam #showyourstripes

Looking to make the most of your #datviz? Our new partnership could be just what you need. Building on over a decade of experience helping clients communicate complexity with clarity, we’ve developed this offer to meet the specific needs of knowledge-led organisations. (1/4) 🧵


The only UK government in my, and your, lifetime to kill living standards AND enact #Brexit☠️ #HowTheyBrokeBritain for more details. @EdConwaySky should be advising the next government and get a knighthood for real-time analysis and #datviz services 🤩. x.com/rsen5/status/1…
Since I was born in our great capital city, living standards increased under all governments (1955-2019) including Thatcher's 3 term's of de-industrialisation. But the #Brexit enacting Johnson/Truss/Sunak (2019-2024) gov. killed LS. 🔥 2.5% GDP p.a. 💉#SOS x.com/Haggis_UK/stat…

💧🌍 #Water stress warning: Population growth is straining water resources. China has seen a 50% decrease, and Pakistan an 80% reduction in per capita water availability from 1963 to 2019. Explore this #SDGAtlas interactive #datviz ➡️ wrld.bg/Kszy50R16K9
💧🌍 #Water stress warning: Population growth is straining water resources. China has seen a 50% decrease, and Pakistan an 80% reduction in per capita water availability from 1963 to 2019. Explore this #SDGAtlas interactive #datviz: wrld.bg/Lhbn50QVEE4

📚 Want to master Tableau certification? Our comprehensive guide has got you covered! From study hacks to expert tips, we've got everything you need to ace that exam 🎓💯 👉🏼 Full article here : itcertificate.org/blog/analytics… #TableauCertification #StudyTips #DatViz #LearningIsFun

Map in a single tweet library(leaflet) # Background: NASA m <- leaflet() %>% addTiles() %>% setView( lng = 69.3451, lat = 30.3753, zoom = 5 ) %>% addProviderTiles("NASAGIBS.ViirsEarthAtNight2012") m #Rspatial #Maps #Datviz #Leaflet Full code: github.com/umemasiddiqi/3…

#psy6135 #datviz Topic last week, Human Factors: How to tell what works. 📊 Slides: friendly.github.io/6135/lectures/…
#datviz 📈📉Does anyone know the origin of this SUNBURST chart? I'm pretty sure it came from twitter, but can no longer find the source.
💧🌍Water stress warning: Population growth is straining water resources. China has seen a 50% decrease, and Pakistan an 80% reduction in per capita water availability from 1963 to 2019. Explore this #SDGAtlas interactive #datviz: wrld.bg/9vh150QbNbu

Hetzelfde als in 2022 gold, geldt voor 1e kw 2024. Ik heb ruimte voor advieswerk over #BigData, #DatViz, #Excel & #Onderzoek. Ik ben kieskeurig! De aanvraag moet voor 30 november bij mij binnen zijn! Mijn carrière tot nu toe: sites.google.com/site/guiselain…
Er is nog ruimte in 1e kw 2022 voor kleine externe projecten! Je kunt tot en met eind dec tijd reserveren voor je project! Ik ben kieskeurig! Excel, onderzoek, enquete, advies & visualisatie data.
💧🌍 #Water stress warning: Population growth is straining water resources. Explore this #SDGAtlas interactive #datviz: wrld.bg/vUPA50PPVGu

💧🌍 #Water stress warning: Population growth is straining water resources. China has seen a 50% decrease, and Pakistan an 80% reduction in per capita water availability from 1963 to 2019. Explore this #SDGAtlas interactive #datviz ➡️ wrld.bg/IuTR50PN41I #SDGSummit #SDG6


Here is another view of the data; it's cool seeing the linearity of Bryn navigating the maize rows pre-harvest opposed to his seemingly random tracks post-harvest #map #datviz

% of young adults (18-34) who oppose gay marriage in Europe: 🇬🇪Georgia 94% 🇷🇺Russia 86% 🇺🇦Ukraine 82% 🇭🇺Hungary 52% 🇬🇷Greece 51% 🇵🇱Poland 50% 🇮🇪Ireland 20% 🇫🇷France 17% 🇩🇪Germany 15% 🇳🇴Norway 14% 🇬🇧UK 13% 🇫🇮Finland 12% 🇪🇸Spain 7% 🇸🇪Sweden 5% #Maps #Mapping #Datviz #GayMarriage
#googlefonts finally added Sans & Serif #Ethiopic fonts. Tested both on a couple of graphic devices and they work like a charm! This is a big deal for #datviz in #Ethiopia

Guess I got a bit side-tracked while creating some (mostly bad) color palette examples for a #datviz training... 1. sequential 2. diverging 3. rainbow 4. qualitative (used for quantitative data)


tl;dr - A visual breakdown of @GeorgiaTech papers at #CHI2021 with all authors, including collaborators and orgs. Interactive #datviz: public.tableau.com/views/GeorgiaT…
Another SQL formula breakthrough - changing subscore titles for selected tests. Planning on adding this feature to future state testing and @NWEA MAP reports. #Datastudio #Datviz #Storytellingwithdata #OETC22


Who and what from @GeorgiaTech will you find this week at #SIGCSE2019? Check out our overview of #CSEducation research and stick around for the #datviz conversation starters. gvu.gatech.edu/sigcse-2019

#DatViz for the day showing the counties in Central Illinois included in our adjudication of #HumanTrafficking cases research. Due to outdated computer systems not all counties could pull arrest records or jail bookings but we were able to analyze 16/46 counties!

🚀 Course Alert: Advanced #Python for Life Sciences 📅 Three days of diving into data science with Python. Perfect for getting your foundational skills in machine learning & #datviz and mastering typical workflows🧬🐍 physalia-courses.org/courses-worksh…
My daily #datviz: #OhioCoronavirus cases up by 590 now total 46,127 (a 1% increase). Hospitalizations increase by 87 (a 1% increase). Deaths increase by 31 bringing the total deaths to 2,735 (a 1% increase).

Tips data set with #Tableau public! It is great intuitive tool for #datviz and dash-boarding plays nice with #rstats transformed data.


RECRUITMENT DIVERSITY & PAY EQUITY DASHBOARD 📊 I found a Human Resources dataset and wanted to tell a story with it, to find insights on recruitment diversity and pay equity across gender, ethnicity, and global regions. I learnt a lot in the process. #Datafam #Datviz #PowerBI

🦇 Are you batty for #data? 🌱 As some of the most important pollinators in Aussie ecosystems, bats (Chiroptera family) can be found all across the country. Check out this amazing #datviz using #RStats by @daxkellie to see the most recorded bats in the ALA by region. 😍

Map in a single tweet library(leaflet) # Background: NASA m <- leaflet() %>% addTiles() %>% setView( lng = 69.3451, lat = 30.3753, zoom = 5 ) %>% addProviderTiles("NASAGIBS.ViirsEarthAtNight2012") m #Rspatial #Maps #Datviz #Leaflet Full code: github.com/umemasiddiqi/3…

Working on some #rstats #datviz this morning and accidentally duplicated work that I did last week, hidden further down the script BUT I solved the problem a different way, so still feels like a net win 🤷🏼♀️

Something went wrong.
Something went wrong.
United States Trends
- 1. Wemby 35.9K posts
- 2. Steph 74.3K posts
- 3. Spurs 32.4K posts
- 4. Draymond 15.4K posts
- 5. Clemson 11.3K posts
- 6. Louisville 11K posts
- 7. Zack Ryder 16.3K posts
- 8. #SmackDown 52.5K posts
- 9. #DubNation 2,081 posts
- 10. Aaron Fox 2,351 posts
- 11. Massie 56.6K posts
- 12. Harden 14.8K posts
- 13. Marjorie Taylor Greene 47.8K posts
- 14. Brohm 1,688 posts
- 15. Bill Clinton 190K posts
- 16. Dabo 1,988 posts
- 17. PERTHSANTA JOY KAMUTEA 312K posts
- 18. Matt Cardona 2,957 posts
- 19. UCLA 8,815 posts
- 20. Mitch Johnson N/A