#densitybasedclustering resultados de búsqueda

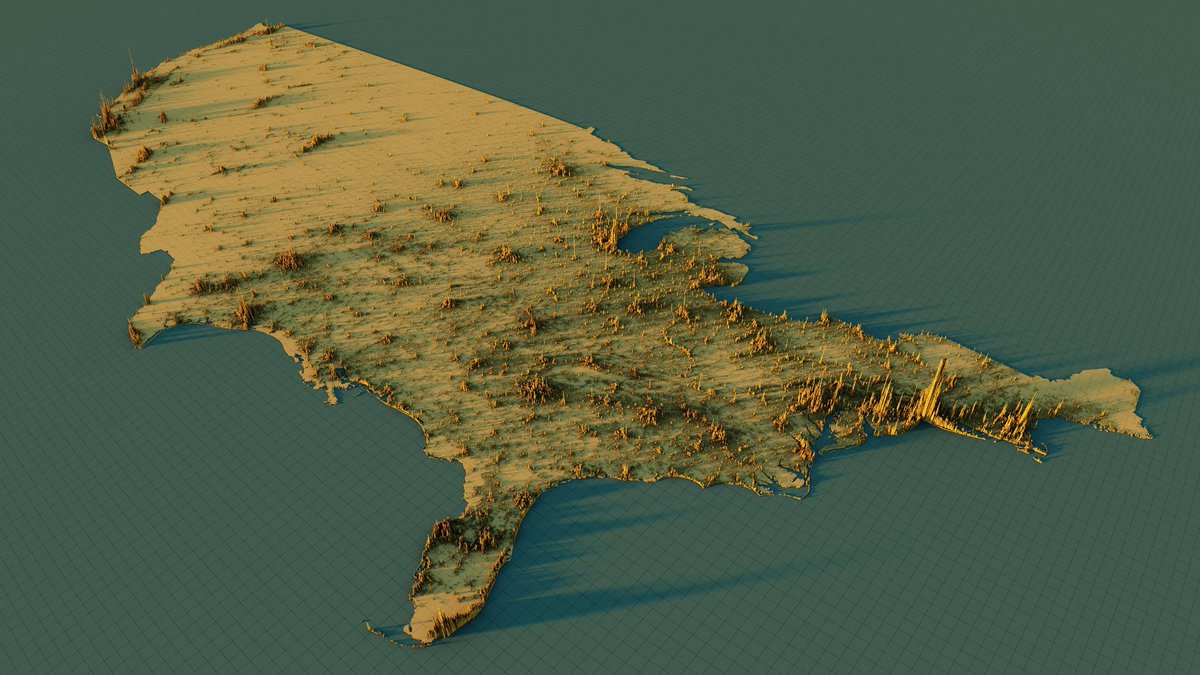
#30DayMapChallenge 🗺️ Día 6: Dimensiones Otro mapa azul, pero ahora uno en 3D con la densidad de población por AGEB en una malla de hexágonos. Qué divertido es jugar con las dimensiones y la visualización de los mapas. Este lo hice en R 💙


Model-Based Clustering and Classification for #DataScience, with Applications in R: amzn.to/4aV1VhH ————— #Rstats #DataScientist #MachineLearning #AI #Statistics #Mathematics


Postgres can auto-cluster your geodata with the help of PostGIS! ST_ClusterKMeans() turns noisy GPS dots into neat blobs + centroids. 🔍 Spot retail hotspots, balance delivery zones, or map wildlife ranges—all without leaving SQL!


🧵1/9 Let's talk about methods for identifying the optimal number of clusters in cluster analysis! Cluster analysis is a technique used to group data points based on their similarity. Here are some popular methods & R packages. #RStats #DataScience


China and US county division map. For China areas with more dense county divisions means higher population density, but not so much for the US, especially for the midwestern US, why is that?


Kernel density estimation (KDE) is a method to estimate the probability density of a data set. Unlike histograms, it produces a smooth curve that makes the distribution easier to interpret. ✔️ Helps reveal structure and multimodality, supporting better analysis ✔️ Provides a…


How biased are clustered SEs with 'few' clusters? A simulation illustrating this. DGP is y~x, 50 clusters, x is normal, true beta is 0.5. Plot of 1000 sims, beta estimate +95% CIs for each. Red = we did not cover true beta. Std SEs no good, clustered SEs yield ~95% coverage (1/6)


Scatter plots are not ideal when you have plenty of data points. Here's a plot you should try instead. . . Scatter plots get too dense to interpret when you have many data points. Instead, use Hexbin plots. They bin the chart into hexagons and assign a color intensity based on…


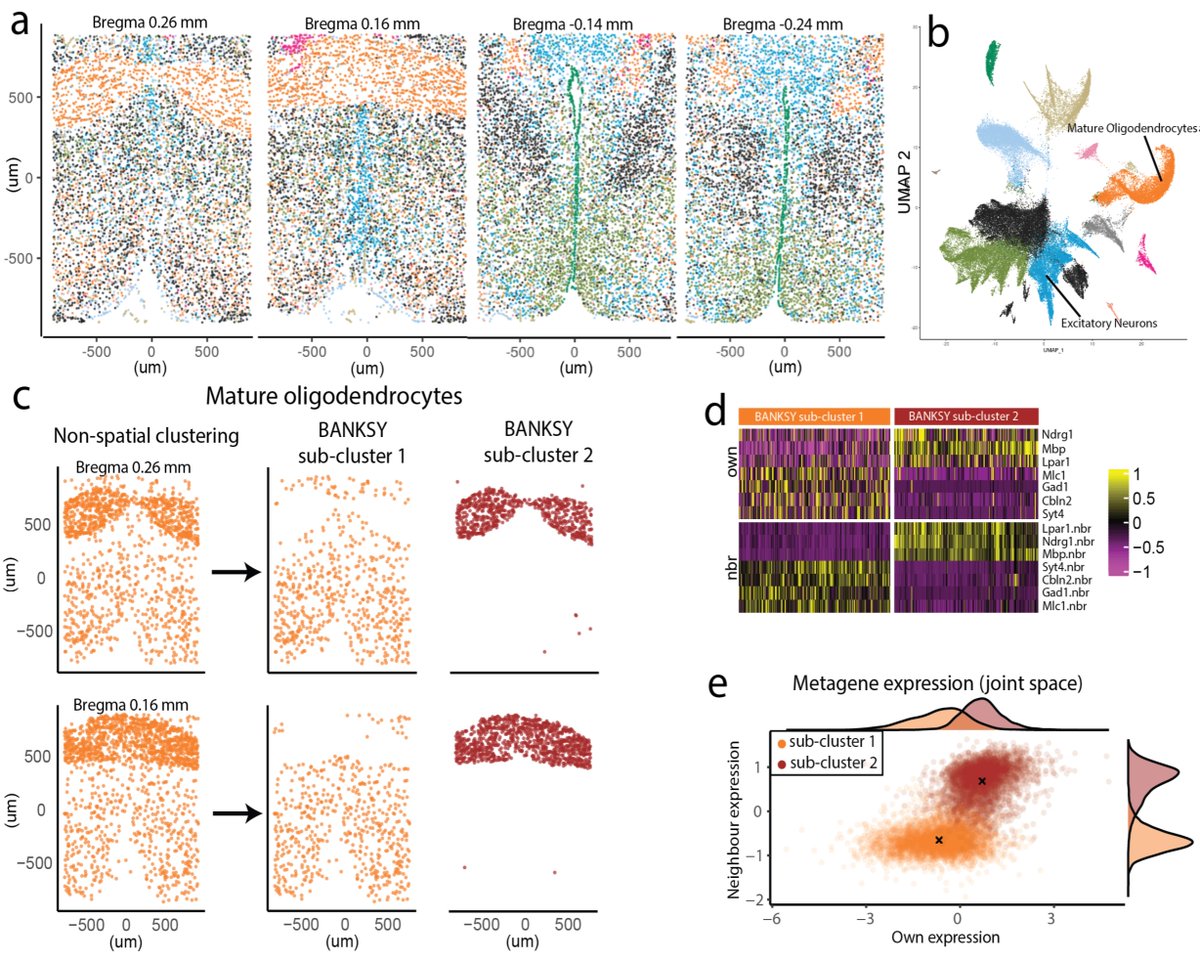
Still using #singlecell clustering algos on your #spatialomics data? Try BANKSY, a scalable, biologically motivated spatial #clustering tool that identifies both cell types and tissue domains: biorxiv.org/cgi/content/sh…


built my own vector db from scratch with - linear scan, kd_tree, hsnw, ivf indexes just to understand things from first principles. all the way from: > recursive BST insertion with d cycling split > hyperplan perpendicular splitting to axis at depth%d > bound and branch pruning…


High-density processing clusters divide difficult tasks into smaller logic segments for faster execution.

🚨🚨 Introducing the Density Database 🚨🚨 Ever wanted a stats sheet like this containing density, racial, and housing data for every state, county, city, zip code, and neighborhood in the country? Well, look no further! Just go to densitydb.github.io and search!


Breast density algorithms are like mini-AI They rate breast density on a 4-pt scale — A through D A not dense D very dense The AI for density mostly works, until it doesn’t Like this case It makes me ask — people really trust AI for their health?


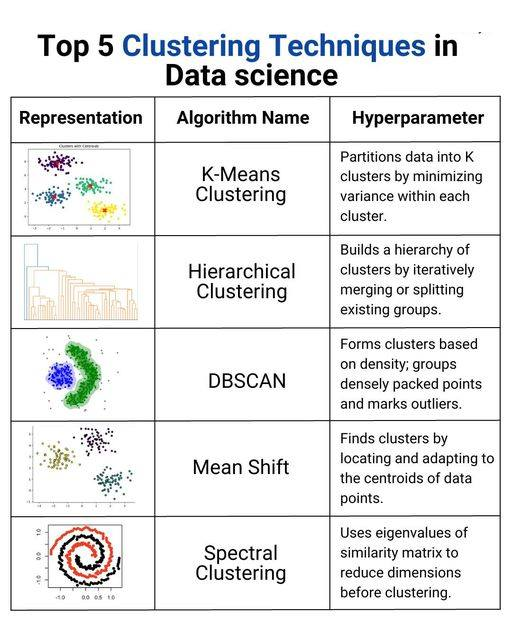
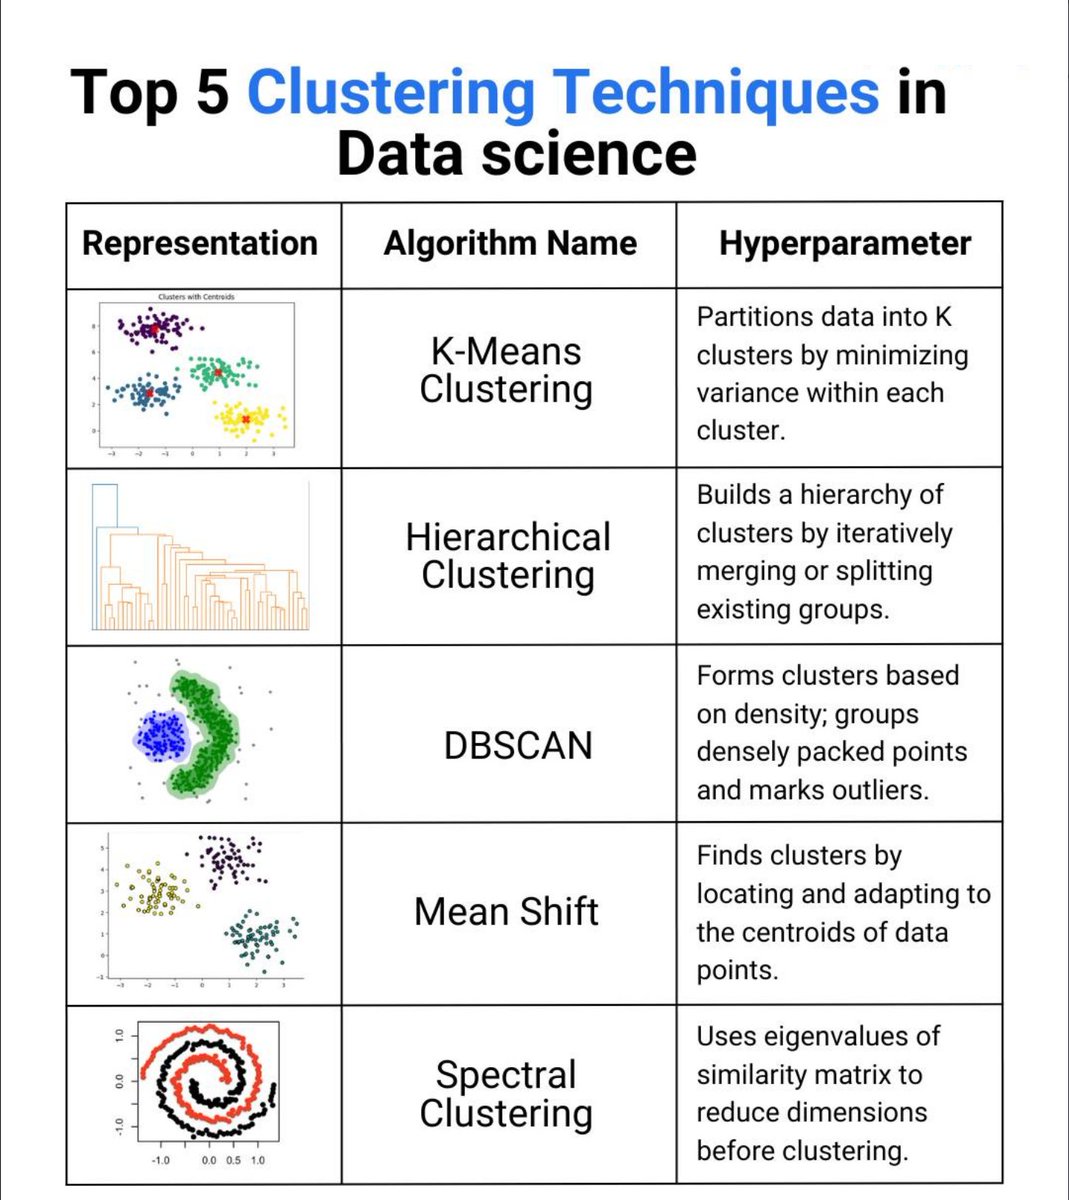
Posting after long time 📘 Day-(x+6) ML Progress ▫️ Learned K-Means Clustering 🎯 ▫️ Groups unlabeled data into K clusters ▫️ Optimal K via Elbow Method & Silhouette Score 📈 ▫️ Sensitive to init & irregular clusters Wrapped up with practice tasks ✅ #MachineLearning #KMeans #AI


My favorite alternative to scatterplots It's called hexagonal binning plot. They are perfect for large datasets. Here is how to create them in Python 👇…


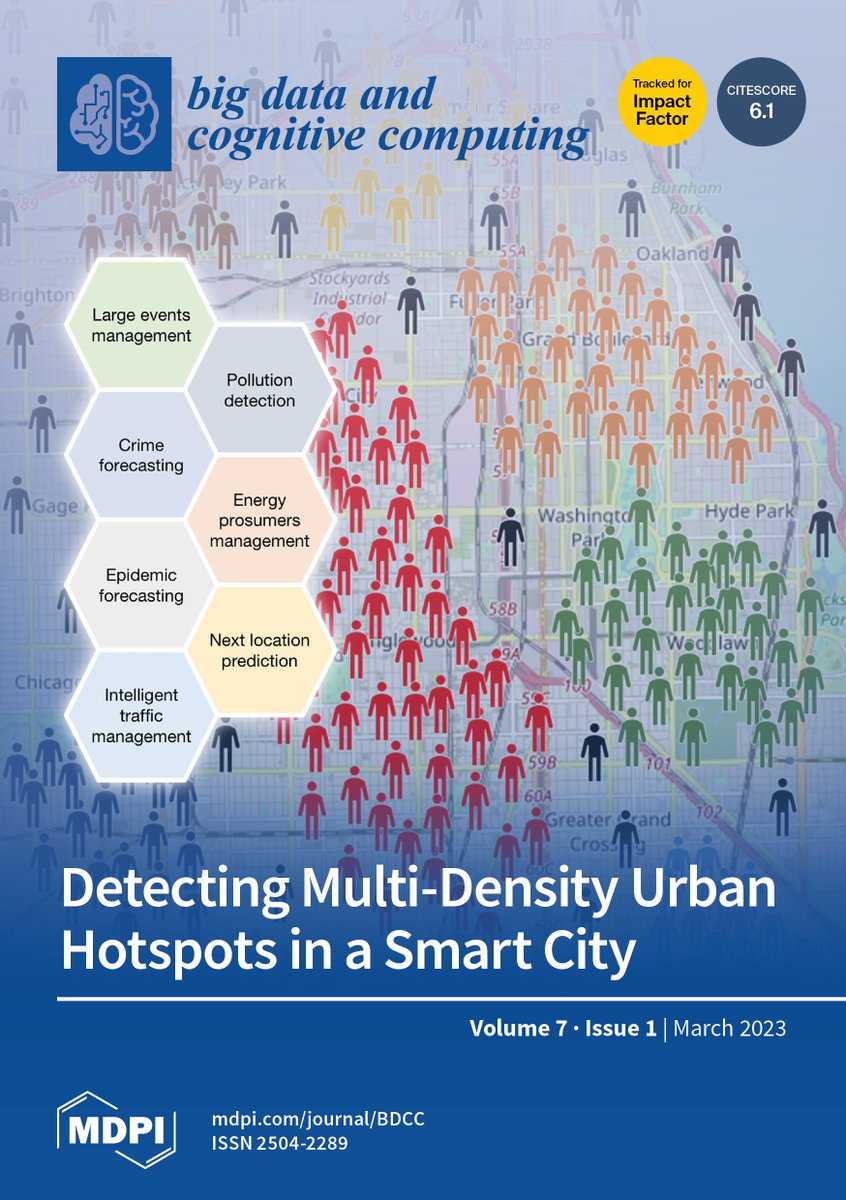
📚✨ Check out the hottest articles of 2023! 📚Dive into in-depth discussions on #smartcity #densitybasedclustering #urbandataanalysis by clicking the link below: mdpi.com/2504-2289/7/1/… @ComSciMath_Mdpi

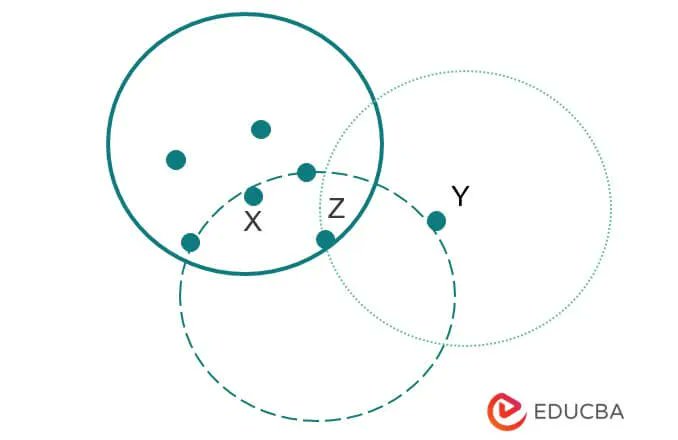
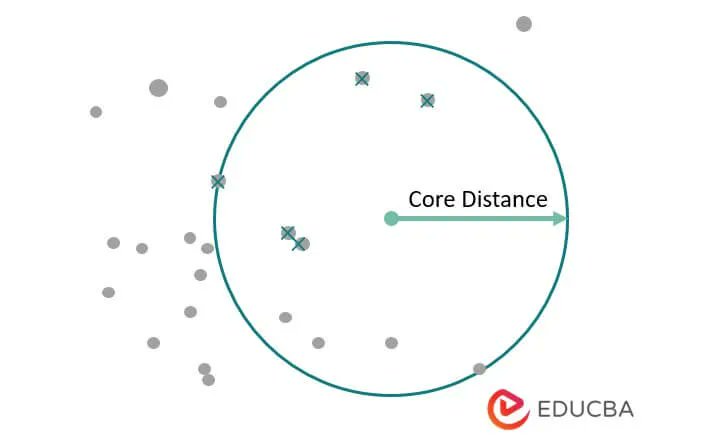
Density-based clustering: DBSCAN algorithm 📊 Explore density-based clustering using the DBSCAN algorithm. Learn how to identify clusters based on density connectivity and handle noisy data points in R. #DBSCAN #DensityBasedClustering

Density-based clustering | Parameters, Applications and Methods buff.ly/41yU7NO #Densitybasedclustering

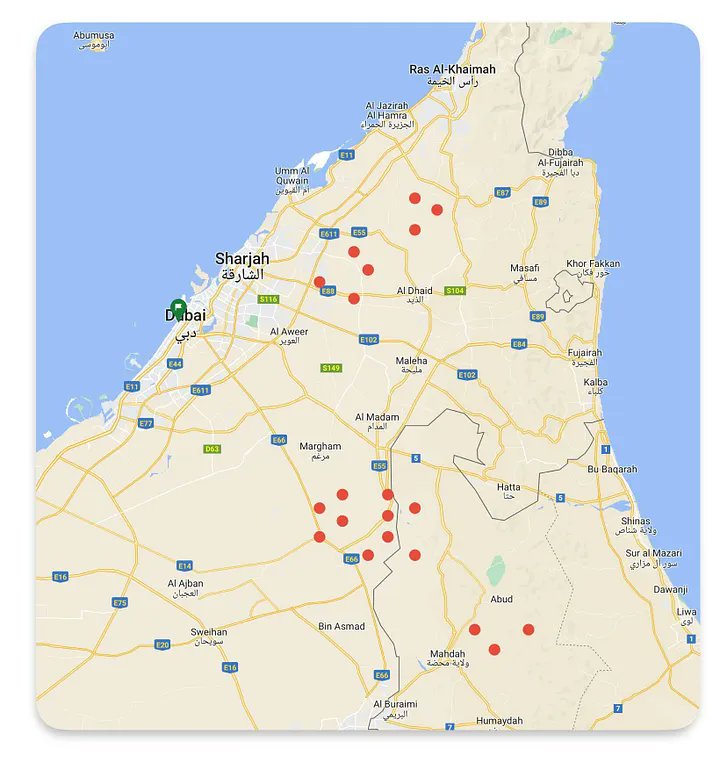
Another tutorial from PostGIS series explaining how to use "Density Based Spatial Clustering" using PostGIS by forming bounding boxes or centroids based on population density #spatialclustering #postgis #densitybasedclustering #kmeans Full article 👉medium.com/ideatolifeme

Dixit, Siddharth; Density Based Clustering using Mutual K-Nearest... #Densitybasedclustering #K-nearestneighbor rave.ohiolink.edu/etdc/view?acc_…
Another tutorial from PostGIS series explaining how to use "Density Based Spatial Clustering" using PostGIS by forming bounding boxes or centroids based on population density #spatialclustering #postgis #densitybasedclustering #kmeans Full article 👉medium.com/ideatolifeme
Density-based clustering | Parameters, Applications and Methods buff.ly/41yU7NO #Densitybasedclustering
📚✨ Check out the hottest articles of 2023! 📚Dive into in-depth discussions on #smartcity #densitybasedclustering #urbandataanalysis by clicking the link below: mdpi.com/2504-2289/7/1/… @ComSciMath_Mdpi
Something went wrong.
Something went wrong.
United States Trends
- 1. Penn State 17.4K posts
- 2. Mendoza 14.8K posts
- 3. Gus Johnson 3,482 posts
- 4. #iufb 2,915 posts
- 5. Omar Cooper 4,222 posts
- 6. Sunderland 140K posts
- 7. $SSHIB 1,522 posts
- 8. Jim Knowles N/A
- 9. James Franklin 5,929 posts
- 10. Texas Tech 11.8K posts
- 11. Happy Valley 1,361 posts
- 12. Arsenal 240K posts
- 13. WHAT A CATCH 9,180 posts
- 14. Sayin 62.4K posts
- 15. Jeremiah Smith 2,303 posts
- 16. St. John 7,739 posts
- 17. Charlie Becker N/A
- 18. CATCH OF THE YEAR 2,521 posts
- 19. #GoDawgs 4,358 posts
- 20. Cignetti 1,762 posts