#navigateyourflow search results

Trello offers a great way of organizing your work, and Kanban optimizes the way you get the same work done. Get our free step-by-step guide on setting up and leveraging Kanban on Trello → getnave.co/4j57j5D #NavigateYourFlow #Kanban #Trello #WorkflowOptimization


Simple tricks to help you manage stress in your workplace effectively → getnave.co/4nwxCnl #NavigateYourFlow #Kanban #BehaviorChange #AgileProjectManagement #ChangeLeadership

If you observe a drastic gap between the percentiles in your Cycle Time Scatterplot, chances are you’re dealing with an unstable and unpredictable system. What does your Cycle Time Scatterplot look like → getnave.co/45mprEq #NavigateYourFlow #Kanban #Agile #Forecasting

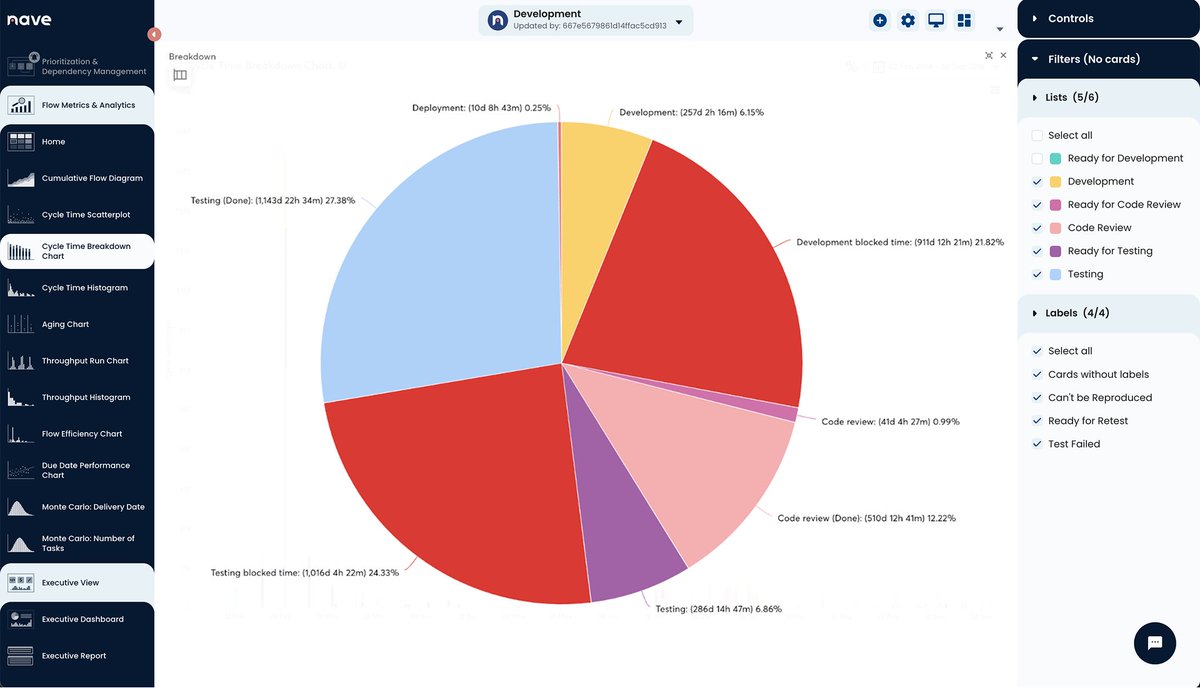
If you’re estimating with story points or hours, your delivery time will be longer. Acknowledge that waiting time exists and embrace the variability. Explore the Cycle Time Breakdown by Nave → getnave.co/3SLxi71 #NavigateYourFlow #Kanban #Agile #AgileManagement #Estimation
You might know our products but what about who we are—and what we stand for. The same way lasting personal relationships are built on shared values, so are the strongest business ones → getnave.co/3G4NJYZ #NavigateYourFlow #Kanban #CoreValues #Agile #ContinuousImprovement

Little’s Law explains the relationship between WIP, Cycle Time, and Throughput, helping you build a more predictable delivery system. Explore its assumptions in our guide → getnave.co/4iGvJCy #NavigateYourFlow #Kanban #AgileLeadership #Flow #AgileMindset

“Even before approvals, I used Nave in a compliant way.” Amanda Varella’s open-source Jira uploader makes instant, secure dashboards possible → getnave.co/48vvgkf #NavigateYourFlow #Kanban #WorkflowDesign #DataSecurity #TeamGrowth

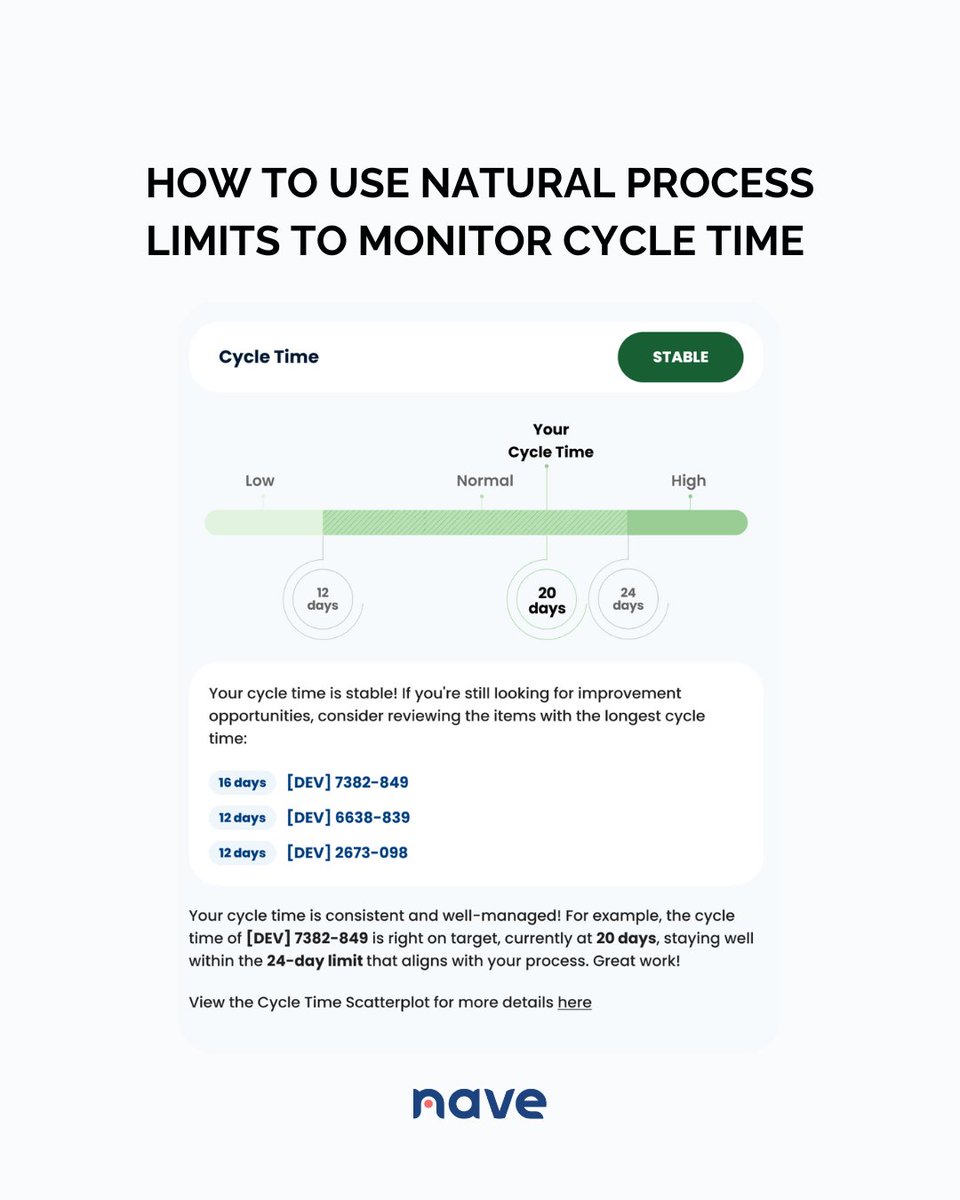
With stable cycle time, you can use Monte Carlo to reliably forecast delivery times. Explore how to track and respond to cycle time signals → getnave.co/3XX6W4N #NavigateYourFlow #Kanban #CycleTime #ProcessImprovement #DataDrivenDecisions
Kanban swimlanes come in to help with task organization as projects grow. They make it easy to track progress while focusing on personal responsibilities → getnave.co/4j5k6oW #NavigateYourFlow #Kanban #ProjectManagement #KanbanSwimlanes #TaskManagement

Explore the most reliable approach to measuring flow efficiency, the industry standards underpinning it, and how to leverage all the benefits of this essential flow metric → getnave.co/4nOa2mT #NavigateYourFlow #Kanban #Agile #Flow #PerformanceImprovement

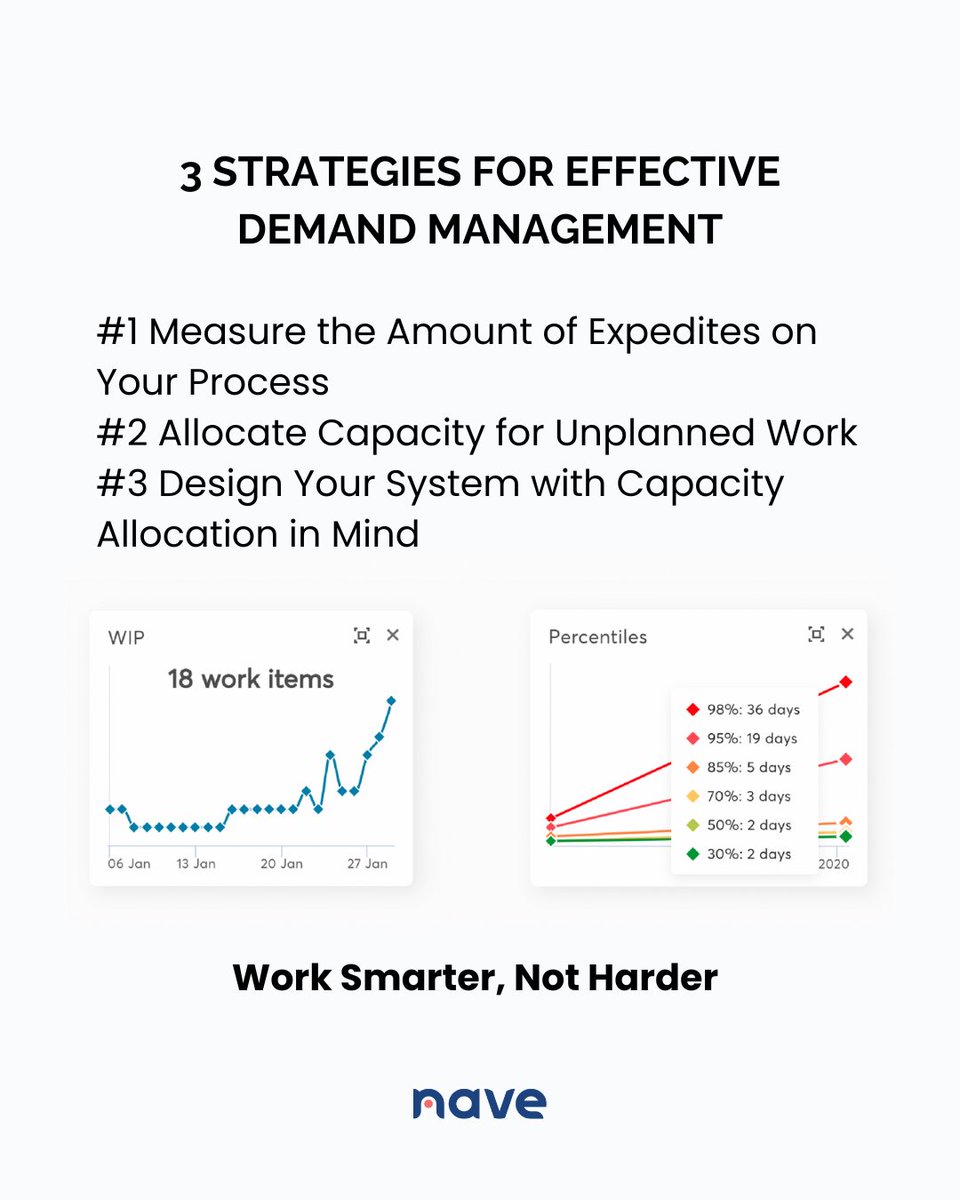
What does capacity allocation look like? It’s about distributing your team’s workload based on their ability to complete tasks—measured by fully finished work in a sprint, not what's in progress → getnave.co/4jCs6Ob #NavigateYourFlow #Kanban #AgileWorkflow

Too much work in progress slows everything down. Implementing WIP limits helps teams stay focused, collaborate effectively, and speed up delivery. Get our free guide to balancing demand with capacity → getnave.co/4c4JwAk #NavigateYourFlow #Kanban #Scrum #Demand #Capacity

If there’s a wide gap between percentiles, your system isn’t just slow—it’s unstable and unpredictable. What does your Cycle Time Scatterplot look like → getnave.co/4kAThJP #NavigateYourFlow #Kanban #Agile #Estimating #Forecasting

“Even before approvals, I used Nave in a compliant way.” Amanda Varella’s open-source Jira uploader makes instant, secure dashboards possible → getnave.co/46BPiqD #NavigateYourFlow #Kanban #WorkflowDesign #DataSecurity #TeamGrowth

There is a simple way to eliminate workplace stress and create a new narrative around how you manage your work → getnave.co/3JXM2yv #NavigateYourFlow #Kanban #AgileLeadership #AgileMindset #AgileManagement

Understanding how WIP, Cycle Time, and Throughput interact is key to predictable delivery. Little’s Law explains this connection—learn how to apply it effectively → getnave.co/4iZRZHi #NavigateYourFlow #Kanban #AgileLeadership #Flow #AgileMindset
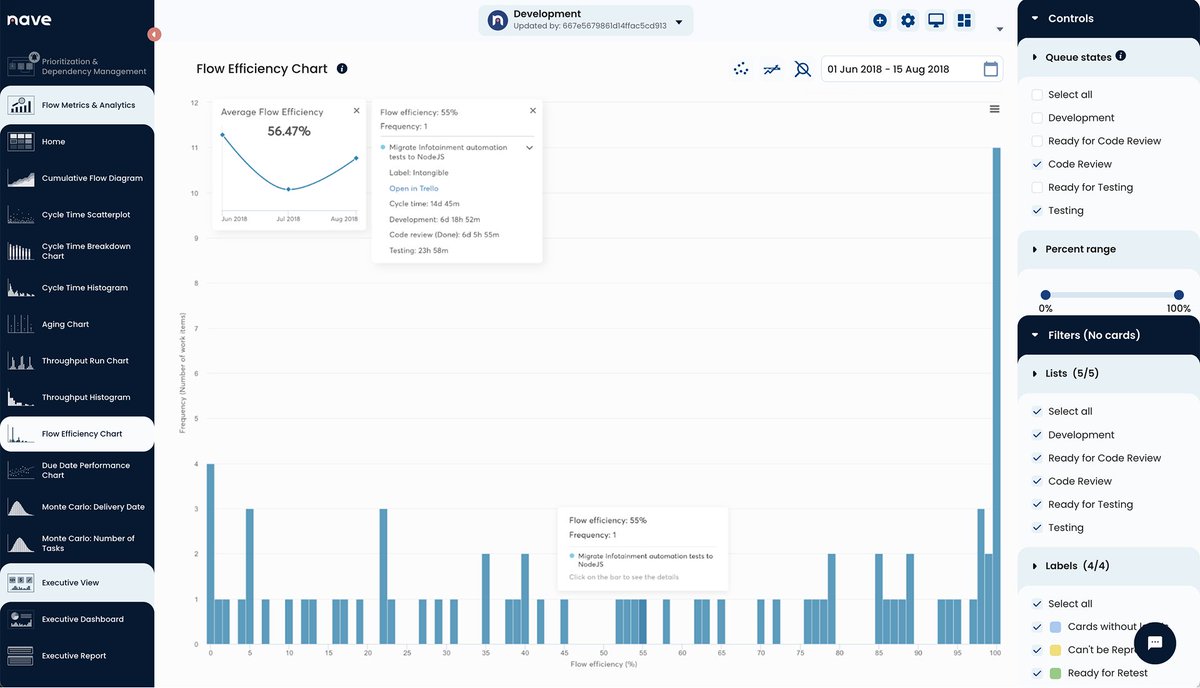
By looking beyond the time your work spends waiting, you would be able to expose the factors dragging your productivity down right away. Learn more about the Flow Efficiency Chart by Nave → getnave.co/4e080vp #NavigateYourFlow #Agile #Kanban #Scrum #Flow
Today, we’ll reveal the 3 fundamentals to an accurate flow efficiency calculation and how you can make the most out of this flow metric → getnave.co/4eNZdx1 #NavigateYourFlow #Kanban #Agility #PerformanceMonitoring #Workflow

To explore the assumptions behind Little's Law, which will enable you to maintain a stable system, download our guide to Little’s Law Process Policies → getnave.co/4iZRZHi #NavigateYourFlow #Kanban #AgileLeadership #Flow #AgileMindset

The Wizards delivered work consistently, but inefficiencies slowed them down. A simple pull strategy transformed their delivery times in under 2 months! Download the use case → getnave.co/4hTKrFe #NavigateYourFlow #Kanban #Scrum #AgileLeadership #ProductDevelopment

Trello offers a great way of organizing your work, and Kanban optimizes the way you get the same work done. Get our free step-by-step guide on setting up and leveraging Kanban on Trello → getnave.co/4j57j5D #NavigateYourFlow #Kanban #Trello #WorkflowOptimization
If you observe a drastic gap between the percentiles in your Cycle Time Scatterplot, chances are you’re dealing with an unstable and unpredictable system. What does your Cycle Time Scatterplot look like → getnave.co/45mprEq #NavigateYourFlow #Kanban #Agile #Forecasting
Explore the most reliable approach to measuring flow efficiency, the industry standards underpinning it, and how to leverage all the benefits of this essential flow metric → getnave.co/4nOa2mT #NavigateYourFlow #Kanban #Agile #Flow #PerformanceImprovement
Today, we’ll reveal the 3 fundamentals to an accurate flow efficiency calculation and how you can make the most out of this flow metric → getnave.co/4eNZdx1 #NavigateYourFlow #Kanban #Agility #PerformanceMonitoring #Workflow
If you’re estimating with story points or hours, your delivery time will be longer. Acknowledge that waiting time exists and embrace the variability. Explore the Cycle Time Breakdown by Nave → getnave.co/3SLxi71 #NavigateYourFlow #Kanban #Agile #AgileManagement #Estimation
What does capacity allocation look like? It’s about distributing your team’s workload based on their ability to complete tasks—measured by fully finished work in a sprint, not what's in progress → getnave.co/4jCs6Ob #NavigateYourFlow #Kanban #AgileWorkflow
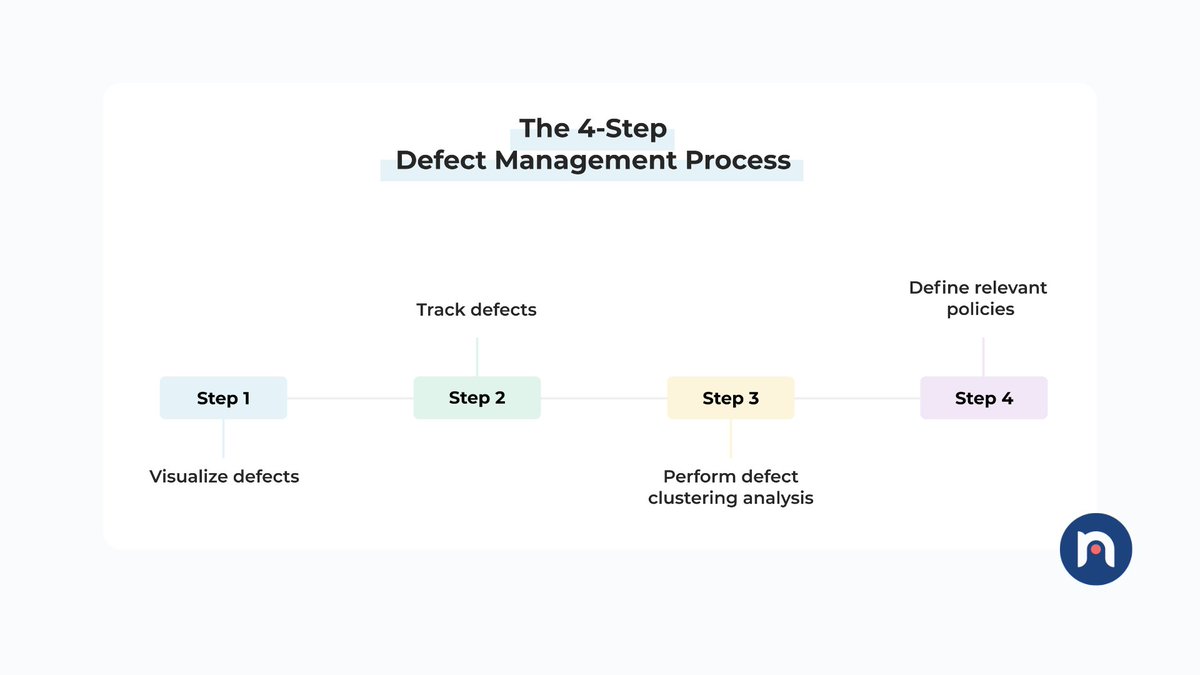
To learn more about the 4-step process to effective defect management, download our guide to more sustainable delivery of quality software → getnave.co/4kZYkUV #NavigateYourFlow #Kanban #ContinuousImprovement #DefectManagement #SoftwareDevelopment

Too much work in progress slows everything down. Implementing WIP limits helps teams stay focused, collaborate effectively, and speed up delivery. Get our free guide to balancing demand with capacity → getnave.co/4c4JwAk #NavigateYourFlow #Kanban #Scrum #Demand #Capacity
You can use the Flow Efficiency Chart to track the flow efficiency of your work items as well as your average flow efficiency. Learn more about the Flow Efficiency Chart by Nave → getnave.co/43WFS85 #NavigateYourFlow #Agile #Kanban #Scrum #Flow

By looking beyond the time your work spends waiting, you would be able to expose the factors dragging your productivity down right away. Learn more about the Flow Efficiency Chart by Nave → getnave.co/4e080vp #NavigateYourFlow #Agile #Kanban #Scrum #Flow
Overcoming WIP limits challenges led to remarkable results. Let me walk you through the strategies that help turn things around and achieve better team efficiency → getnave.co/42qUR9t #NavigateYourFlow #Kanban #AgileProductivity #EfficientWorkflow #WorkloadBalance


SmartNav: Overcoming GPS weaknesses in cities - Digital Journal digitaljournal.com/tech-science/s… #TravelTown #technology #navigateyourflow

Defects can be managed like blockers to investigate their root causes and solve them in an economically sensible way. Download our 4-step guide to effective defect management → getnave.co/4kZYkUV #NavigateYourFlow #Kanban #DefectManagement #WorkInProgress #Productivity
Explore how to deal with unplanned work in Kanban without causing delays or overburdening your team with excessive demand → getnave.co/42v4q7v #NavigateYourFlow #Kanban #AdaptiveWorkflow #KanbanResilience #EmbraceTheUnexpected
Increasing transparency is the first step towards reducing defects and highlighting their disruptive impact. To learn more about the 4-step process to effective defect management, download our free guide → getnave.co/4hK78vs #NavigateYourFlow #Kanban #DefectManagement

If your commitment is about 100 times bigger than the typical time of 1 day and it is 10 times bigger than the 50th percentile, it might be worth calling current work management practices into question → getnave.co/4e2xCYD #NavigateYourFlow #Kanban #CycleTime #Estimating

With this simple trick, you’ll uncover the immediate positive effect that implementing WIP limits has on your delivery speed → getnave.co/3IS7fJU #NavigateYourFlow #Kanban #WIP #ChangeLeadership #AgileTransformation

How to reveal the immediate impact implementing WIP limits brings about → getnave.co/4793tFf #NavigateYourFlow #Kanban #ContinuousImprovement #AgileCoach #AgileLeadership

The more stable your system is, the more predictable it becomes. And predictable systems produce accurate delivery forecasts. Explore the Aging Chart by Nave → getnave.co/44dgTOY #NavigateYourFlow #Kanban #Agile #ProductDevelopment #AgileProjectManagement

Discover what failure demand is, how to analyze it in your system, and strategies to turn it into value demand → getnave.co/4jcWZbW #NavigateYourFlow #Kanban #FailureDemand #ContinuousImprovement #BusinessGrowth

Simple tricks to help you manage stress in your workplace effectively → getnave.co/4nwxCnl #NavigateYourFlow #Kanban #BehaviorChange #AgileProjectManagement #ChangeLeadership
Trello offers a great way of organizing your work, and Kanban optimizes the way you get the same work done. Get our free step-by-step guide on setting up and leveraging Kanban on Trello → getnave.co/4j57j5D #NavigateYourFlow #Kanban #Trello #WorkflowOptimization
You might know our products but what about who we are—and what we stand for. The same way lasting personal relationships are built on shared values, so are the strongest business ones → getnave.co/3G4NJYZ #NavigateYourFlow #Kanban #CoreValues #Agile #ContinuousImprovement
With stable cycle time, you can use Monte Carlo to reliably forecast delivery times. Explore how to track and respond to cycle time signals → getnave.co/3XX6W4N #NavigateYourFlow #Kanban #CycleTime #ProcessImprovement #DataDrivenDecisions
The best way to communicate commitments is to use a forecast. The Cycle Time Histogram turns past performance into future predictability. Start forecasting with confidence with Nave → getnave.co/4e2xCYD #NavigateYourFlow #Kanban #CycleTime #Forecasting #Estimating

Kanban swimlanes come in to help with task organization as projects grow. They make it easy to track progress while focusing on personal responsibilities → getnave.co/4j5k6oW #NavigateYourFlow #Kanban #ProjectManagement #KanbanSwimlanes #TaskManagement
“Even before approvals, I used Nave in a compliant way.” Amanda Varella’s open-source Jira uploader makes instant, secure dashboards possible → getnave.co/48vvgkf #NavigateYourFlow #Kanban #WorkflowDesign #DataSecurity #TeamGrowth
Little’s Law explains the relationship between WIP, Cycle Time, and Throughput, helping you build a more predictable delivery system. Explore its assumptions in our guide → getnave.co/4iGvJCy #NavigateYourFlow #Kanban #AgileLeadership #Flow #AgileMindset
“Even before approvals, I used Nave in a compliant way.” Amanda Varella’s open-source Jira uploader makes instant, secure dashboards possible → getnave.co/46BPiqD #NavigateYourFlow #Kanban #WorkflowDesign #DataSecurity #TeamGrowth
The Wizards delivered work consistently, but inefficiencies slowed them down. A simple pull strategy transformed their delivery times in under 2 months! Download the use case → getnave.co/4hTKrFe #NavigateYourFlow #Kanban #Scrum #AgileLeadership #ProductDevelopment
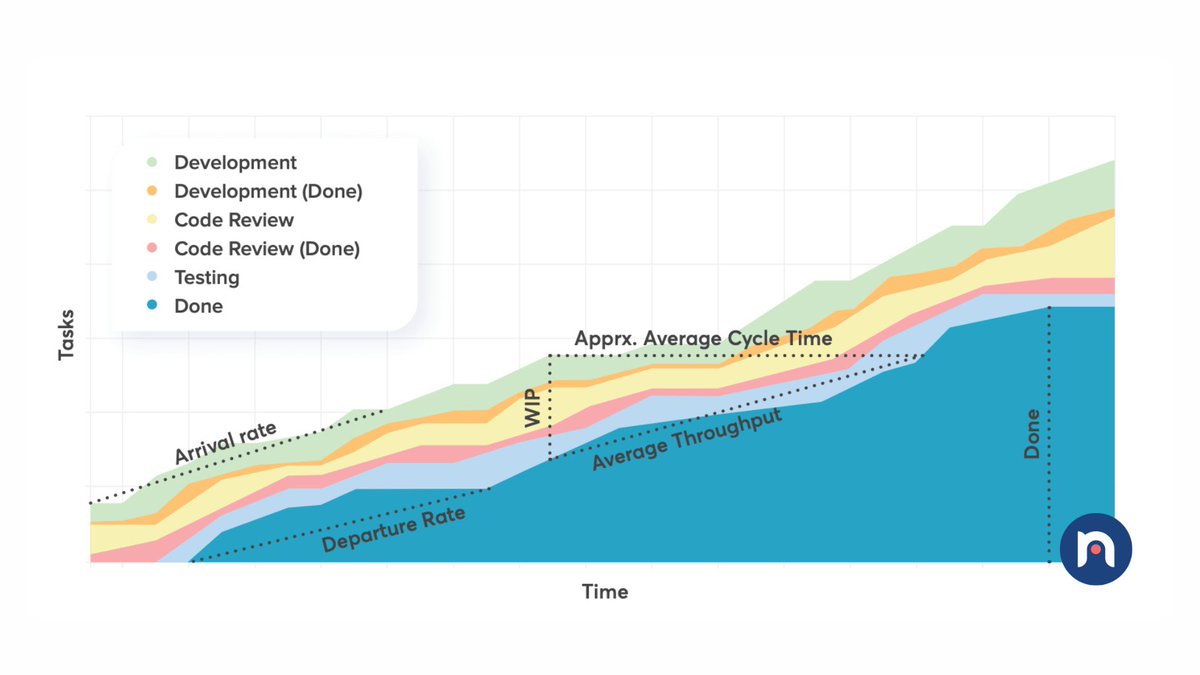
If work enters your workflow faster than it exits, this is an indication of unstable system. To evaluate whether your demand is aligned with your capability, download the ultimate guide to reading the CFD → getnave.co/4l0aPzU #NavigateYourFlow #Kanban #FlowManagement
Bottlenecks killing your delivery speed? The Cycle Time Breakdown shows you exactly where your time goes. Explore the Cycle Time Breakdown Chart by Nave → getnave.co/4kGRAL8 #NavigateYourFlow #Kanban #Agile #ContinuousImprovement

Learn how to increase productivity, avoid delays and relieve team overburden with our free guide to balancing demand with capacity → getnave.co/4c4JwAk #NavigateYourFlow #Kanban

Understanding how WIP, Cycle Time, and Throughput interact is key to predictable delivery. Little’s Law explains this connection—learn how to apply it effectively → getnave.co/4iZRZHi #NavigateYourFlow #Kanban #AgileLeadership #Flow #AgileMindset
The best way to communicate your commitments is to use a forecast. The Cycle Time Histogram will help you build a forecast using your past performance data. Learn more about it with by Nave → getnave.co/4jJS55X #NavigateYourFlow #Kanban #CycleTime #Forecasting #Estimating

There is a simple way to eliminate workplace stress and create a new narrative around how you manage your work → getnave.co/3JXM2yv #NavigateYourFlow #Kanban #AgileLeadership #AgileMindset #AgileManagement
If you’re estimating with story points or hours, your delivery time will be longer. Acknowledge that waiting time exists and embrace the variability. Explore the Cycle Time Breakdown by Nave → getnave.co/3SLxi71 #NavigateYourFlow #Kanban #Agile #AgileManagement #Estimation
If you observe a drastic gap between the percentiles in your Cycle Time Scatterplot, chances are you’re dealing with an unstable and unpredictable system. What does your Cycle Time Scatterplot look like → getnave.co/45mprEq #NavigateYourFlow #Kanban #Agile #Forecasting
Monte Carlo simulation explained: Everything you need to know to make accurate delivery forecasts → getnave.co/48clcN8 #NavigateYourFlow #Kanban #Flow #ProjectManager #AgileProjectManagement

Signals aren’t always bad news—some reveal unexpected improvements in delivery time. Explore how to track and respond to cycle time signals → getnave.co/3XX6W4N #NavigateYourFlow #Kanban #CycleTime #ProcessImprovement #DataDrivenDecisions

Something went wrong.
Something went wrong.
United States Trends
- 1. Ohtani 202K posts
- 2. Dodgers 247K posts
- 3. Dodgers 247K posts
- 4. Carson Beck 16.2K posts
- 5. $SAWA 1,664 posts
- 6. Miami 98.8K posts
- 7. Louisville 27.7K posts
- 8. Nebraska 17.6K posts
- 9. Brewers 54.9K posts
- 10. Babe Ruth 3,171 posts
- 11. NLCS 57.7K posts
- 12. Emiru 5,182 posts
- 13. #SmackDown 56.4K posts
- 14. #BostonBlue 7,750 posts
- 15. Rhule 4,567 posts
- 16. Minnesota 47.3K posts
- 17. 3 HRs 9,967 posts
- 18. George Santos 80.2K posts
- 19. 10 Ks 4,400 posts
- 20. Massie 28.4K posts