#symmetricaltriangle search results


$RIVN might be ready to complete a similar bottom reversal. #symmetricaltriangle.

#symmetricaltriangle can act as bottom reversal. This is how Edwards & Magee featured it with an example from 1940s.


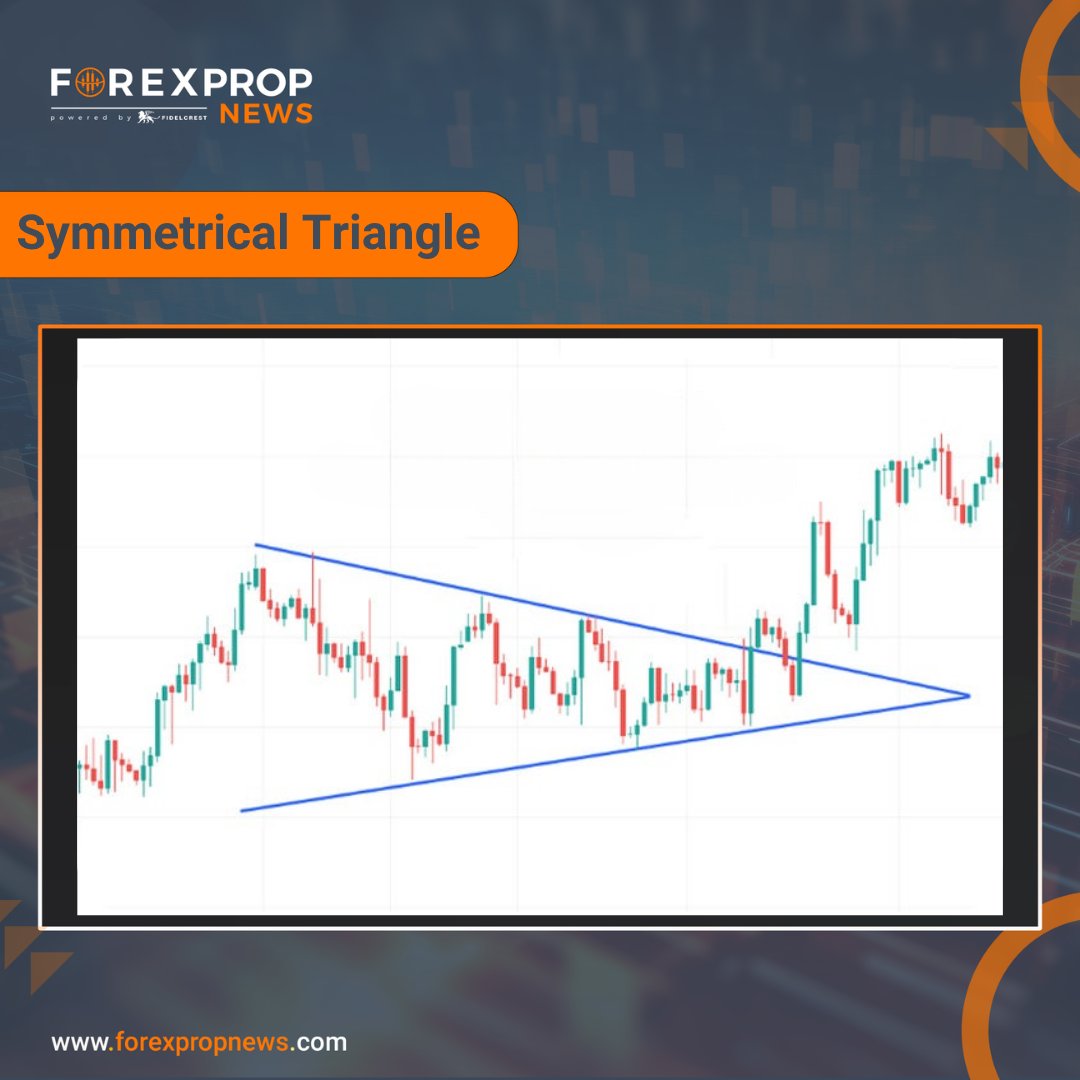
#SymmetricalTriangle Two Lines, One Breakout. Understanding the Symmetrical Triangle Pattern. Like , Share & Retweet


A #symmetricaltriangle is a bilateral chart pattern characterized by two converging trend lines connecting a series of sequential peaks and troughs. $BLTE


$COTI is forming a symmetrical triangle on the weekly timeframe. A breakout above $0.19 could confirm a bullish trend. Keep an eye on potential entry and exit points. #COTI #SymmetricalTriangle


#GraphiteIndia is consolidating within a tight #SymmetricalTriangle pattern — a classic setup before a decisive breakout. While volume bias remains tilted to the upside, the structure is still in a #NoTradeZone until a clear breakout confirmation (either direction) emerges.…


Instead of a price increase, $AIOZ chose a deeper correction, I will wait for the target from the #symmetricaltriangle #AIOZ

Fine points on #symmetricaltriangle breakouts.
#TECHCHARTSMEMBERS Another fresh #breakout #alert from the #watchlist. This one is a #symmetricaltriangle. It is the only chart pattern that I feature with diagonal boundary. Still, I try to pick those that has less steep pattern boundary so that any breakout can take out…

A strong daily close can be the beginning $TSLA. #symmetricaltriangle

An important week for $TSLA. Symmetrical triangle can complete or it can drag on and the pattern can morph into something else. It will be clear in the first few days of the trading week.


#symmetricaltriangle the breakout and the following price action around the minor high. A text-book example.
$ASELS.IS #symmetricaltriangle was discussed under #breakout #alerts The stock is resuming its uptrend with higher highs and higher lows. #BIST100


Nifty #SymmetricalTriangle Upside Breakout Target reached🎯 +2.80%, +700 points #Nifty50 #HST


நிஃப்ட்டியில் (Nifty50) #Symmetrical_Triangle ஃபார்மேஷன் உள்ளது. Downtrend or Uptrend உடைப்பதற்கு முன்பு எந்த விதமான லாங் டைம் Trade செய்யாமல் இருப்பது நல்லது. Note: Black Horizontal லைனை பார்க்கவும்

#symmetricaltriangle text-book price action.
$USDNOK Possible #symmetricaltriangle breakout with the high of the pattern acting as resistance. Check out next short video on #symmetricaltriangle breakouts.

#symmetricaltriangle is the only diagonal pattern I feature and keep stats on. Even with this pattern I look for min 3 touch points of the pattern boundary before a breakout takes place. A recent #breakout #alert from the #watchlist


$JASMY testing triangle support! 📆 4H TF: Price is moving inside a symmetrical triangle and is currently holding the support level 🛡️ 👀 Keep an eye — bounce or breakdown from here could set the next move! #JASMY #SymmetricalTriangle #AltcoinSetup Not financial advice — DYOR!

$RIVN Possible #symmetricaltriangle that can act as a reversal. Still a downtrend. Needs a turnaround story and momentum. Both boundaries are well-defined and recognized by market participants.

#SymmetricalTriangle Two Lines, One Breakout. Understanding the Symmetrical Triangle Pattern. Like , Share & Retweet
$RIVN might be ready to complete a similar bottom reversal. #symmetricaltriangle.
#symmetricaltriangle can act as bottom reversal. This is how Edwards & Magee featured it with an example from 1940s.
#symmetricaltriangle can act as bottom reversal. This is how Edwards & Magee featured it with an example from 1940s.
Fine points on #symmetricaltriangle breakouts.
#TECHCHARTSMEMBERS Another fresh #breakout #alert from the #watchlist. This one is a #symmetricaltriangle. It is the only chart pattern that I feature with diagonal boundary. Still, I try to pick those that has less steep pattern boundary so that any breakout can take out…

🔺 Symmetrical Triangle: Breakout Loading! ⚖️ Price tightens between buyers & sellers - momentum builds for a sharp move ahead. 📈📉 #SymmetricalTriangle #ChartPatterns #ForexTrading #BreakoutSetup


🔺 Symmetrical Triangle: Balance Before the Breakout! ⚖️ Price tightens between buyers & sellers - pressure builds, momentum waits. When it breaks, it moves fast! 🚀 #SymmetricalTriangle #ChartPatterns #BreakoutTrading #ForexTrading

$RIVN Possible #symmetricaltriangle that can act as a reversal. Still a downtrend. Needs a turnaround story and momentum. Both boundaries are well-defined and recognized by market participants.

🔺 Symmetrical Triangle – a battle of balance between buyers and sellers. ⚖️ Price tightens, volatility contracts, and momentum builds - waiting for a breakout in either direction! 📈📉 #SymmetricalTriangle #ForexPatterns #BreakoutSetup #SmartTrading #ChartAnalysis


Our trading bot delivers users symmetrical triangle pattern analysis and market capitalization insights to improve their investment decisions. Visit truststrategy.com today. #TradingBot #SymmetricalTriangle #MarketCap #InvestmentDecisions #TrustStrategy


Our trading bot, which identifies symmetrical triangle patterns and monitors market capitalization, assists investors who want to make informed decisions. Visit masterquant.com today.#TradingBot #SymmetricalTriangle #MarketCap #Investing #MasterQuant

Nifty #SymmetricalTriangle Upside Breakout Target reached🎯 +2.80%, +700 points #Nifty50 #HST
நிஃப்ட்டியில் (Nifty50) #Symmetrical_Triangle ஃபார்மேஷன் உள்ளது. Downtrend or Uptrend உடைப்பதற்கு முன்பு எந்த விதமான லாங் டைம் Trade செய்யாமல் இருப்பது நல்லது. Note: Black Horizontal லைனை பார்க்கவும்

🔺 Symmetrical Triangle Pattern A neutral consolidation where price compresses between higher lows and lower highs - signaling buildup before a breakout. ⚡ The direction of the break reveals the next major move. 📊 #SymmetricalTriangle #ChartPatterns #ForexTrading


🔺 Symmetrical Triangle – pressure building up! Price is coiling between higher lows and lower highs, signaling a breakout is near. ⚡ Wait for a clear break of structure to confirm the next big move. 📊 #SymmetricalTriangle #ChartPatterns #TechnicalAnalysis #ForexTrading


🔺 Symmetrical Triangle Forming! Tightening price action = momentum loading. A breakout is near - stay ready for either side! ⚔️📉📈 #SymmetricalTriangle #ChartPattern #ForexTrading #BreakoutWatch

#88 Symmetrical Triangle Breakout Up Pattern: 30s Chart Trick! #symmetricaltriangle #symmetricaltrianglelinechart #linechart #trading #tradingtips #chartpatterns


A #symmetricaltriangle is a bilateral chart pattern characterized by two converging trend lines connecting a series of sequential peaks and troughs. $BLTE

📊 Chart to Watch: Ticking Time Bomb? About to explode, but in which direction? Tell me a better chart than this. Prizor viztech ltd #SymmetricalTriangle


#Paperstocks setting up well 4 stocks similar pattern: #symmetricaltriangle #Breakout ( #TNPL #andhrapaper #westcoastpaper #SeshasayeePaper ) @_chartitude @ChartAddict007 @dmdsplyinvestor @Stock_Precision @kuttrapali26 @caniravkaria @Rishikesh_ADX @sunilgurjar01 #stockstowatch


Instead of a price increase, $AIOZ chose a deeper correction, I will wait for the target from the #symmetricaltriangle #AIOZ
$COTI is forming a symmetrical triangle on the weekly timeframe. A breakout above $0.19 could confirm a bullish trend. Keep an eye on potential entry and exit points. #COTI #SymmetricalTriangle


#GraphiteIndia is consolidating within a tight #SymmetricalTriangle pattern — a classic setup before a decisive breakout. While volume bias remains tilted to the upside, the structure is still in a #NoTradeZone until a clear breakout confirmation (either direction) emerges.…


A strong daily close can be the beginning $TSLA. #symmetricaltriangle
An important week for $TSLA. Symmetrical triangle can complete or it can drag on and the pattern can morph into something else. It will be clear in the first few days of the trading week.
$MDT is a bit behind schedule after the recent drop, but I'm still positive about this project. The marketcap of this project is only 40 million, remember once we leave this long-term #symmetricaltriangle, the sky will be the limit. #altcoins $KDA $AGIX $CFX


#SymmetricalTriangle Two Lines, One Breakout. Understanding the Symmetrical Triangle Pattern. Like , Share & Retweet

#BIST100 $ASELS.IS Possibly completing its #symmetricaltriangle with a breakout to all-time highs. Stocks that hold well in volatile market conditions will be the first one to breakout to new highs when momentum returns. From the latest report >> blog.techcharts.net

Something went wrong.
Something went wrong.
United States Trends
- 1. Wemby 38.4K posts
- 2. Steph 77.9K posts
- 3. Draymond 17.2K posts
- 4. Spurs 33.4K posts
- 5. Warriors 56.3K posts
- 6. Clemson 11.3K posts
- 7. #Truedtac5GXWilliamEst 113K posts
- 8. Louisville 11K posts
- 9. Zack Ryder 16.8K posts
- 10. WILLIAMEST CALLME MELODY 114K posts
- 11. Massie 58.7K posts
- 12. #DubNation 2,154 posts
- 13. Aaron Fox 2,549 posts
- 14. Bill Clinton 195K posts
- 15. Harden 15.4K posts
- 16. #SmackDown 53.8K posts
- 17. PERTHSANTA JOY KAMUTEA 423K posts
- 18. Marjorie Taylor Greene 50.1K posts
- 19. #NEWKAMUEVENTxPerthSanta 421K posts
- 20. Bubba 59.4K posts