#tidyplots search results

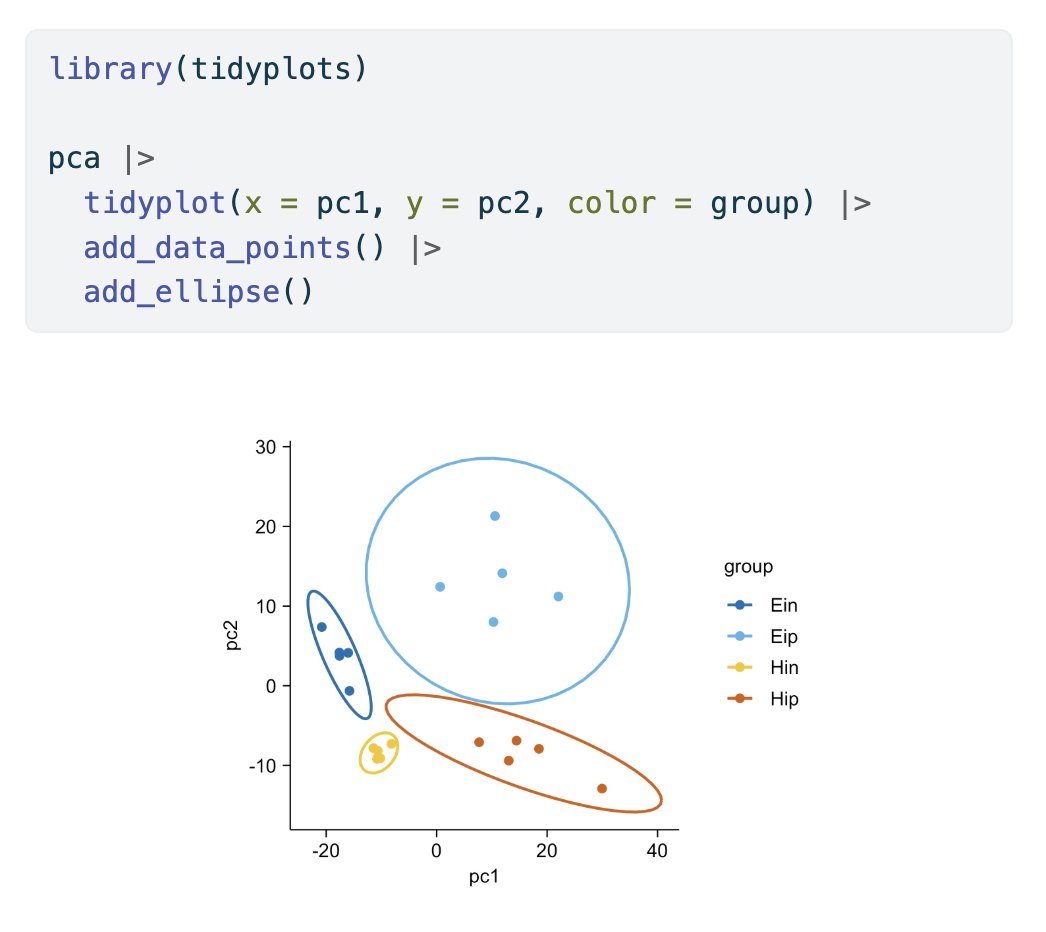
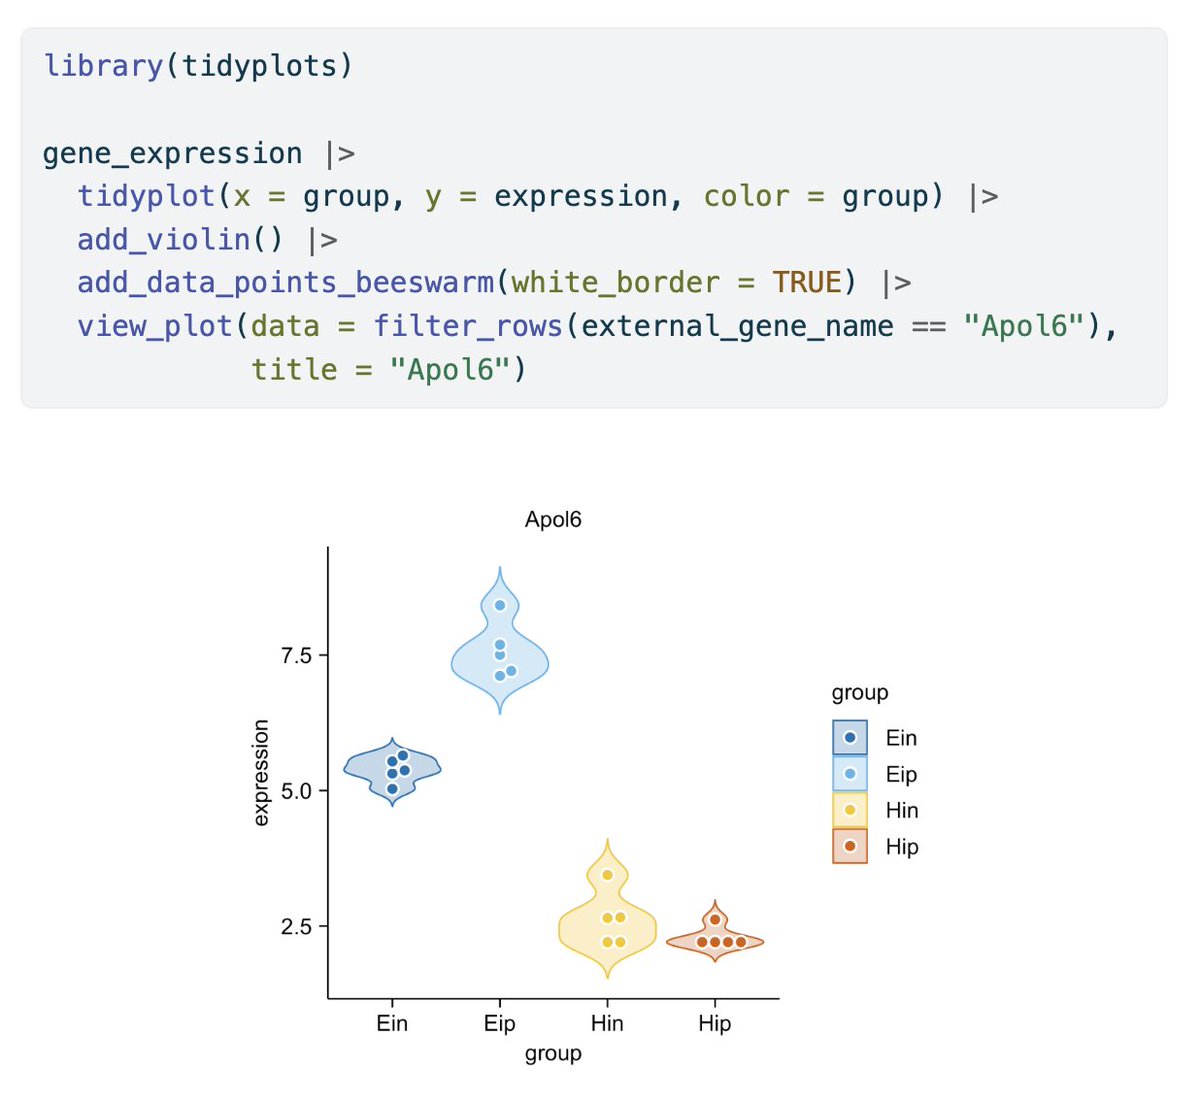
Here are some #tidyplots use cases for bioinformatics 🔥 Complete with data and code 🚀 tidyplots.org/use-cases/#bio… #rstats #dataviz #phd


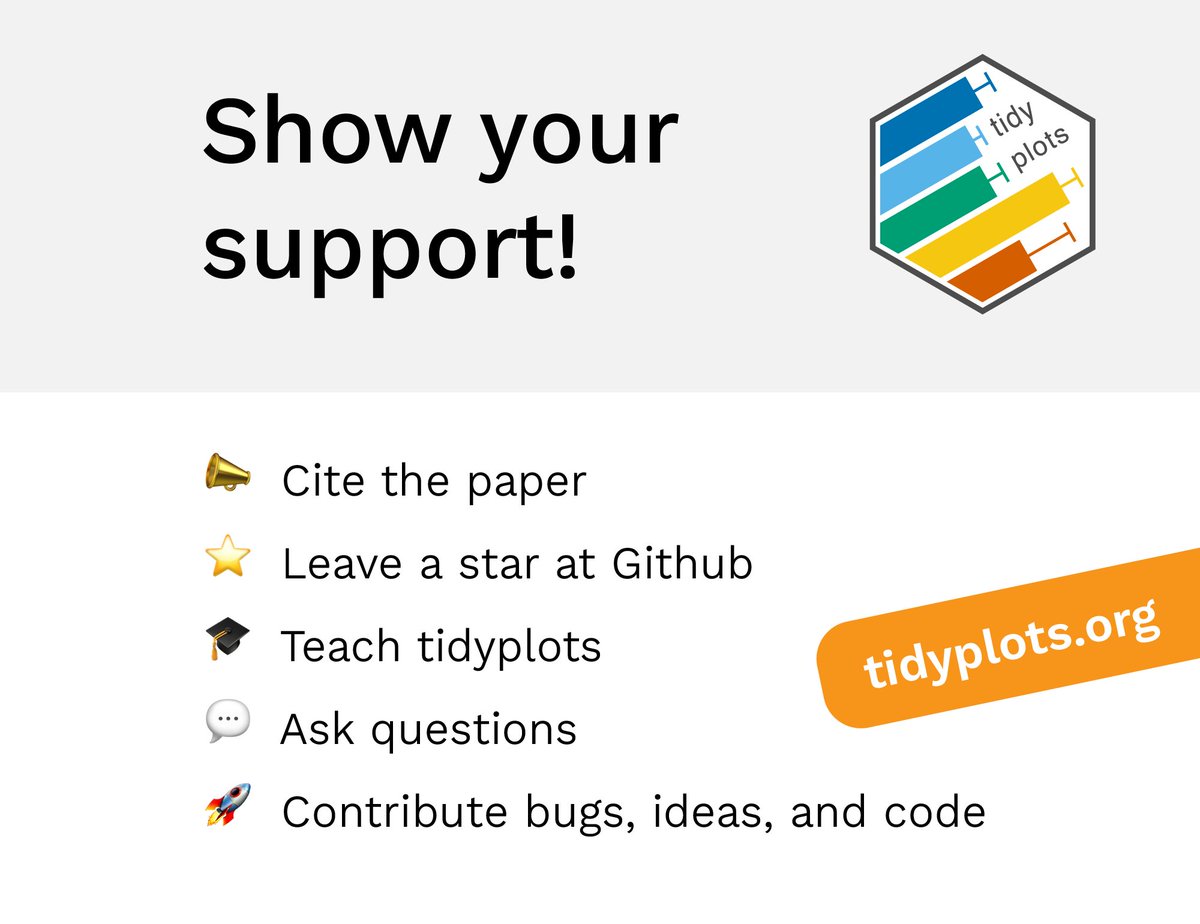
Being free and open-source, this is how you can support #tidyplots ❤️ tidyplots.org github.com/jbengler/tidyp… #rstats #dataviz #phd


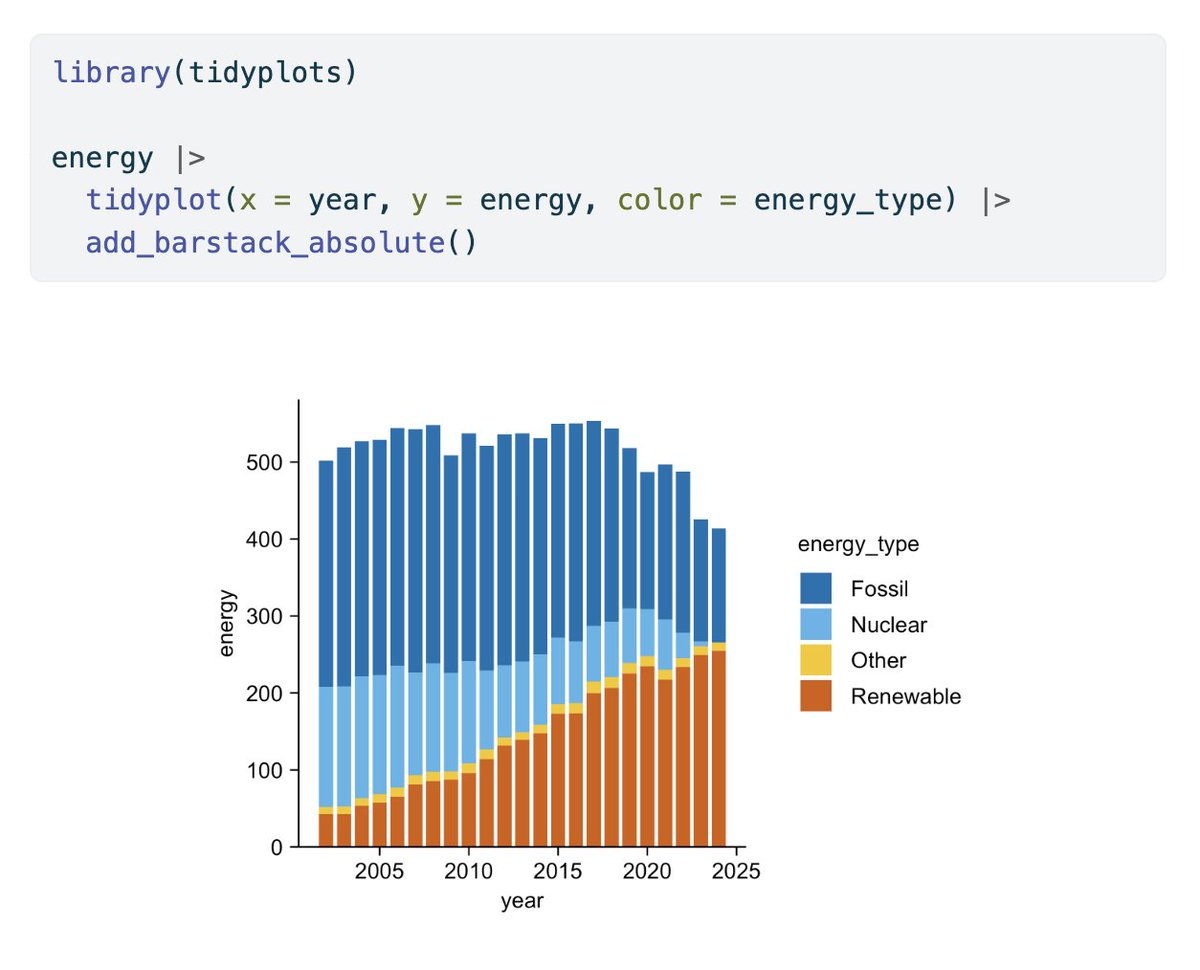
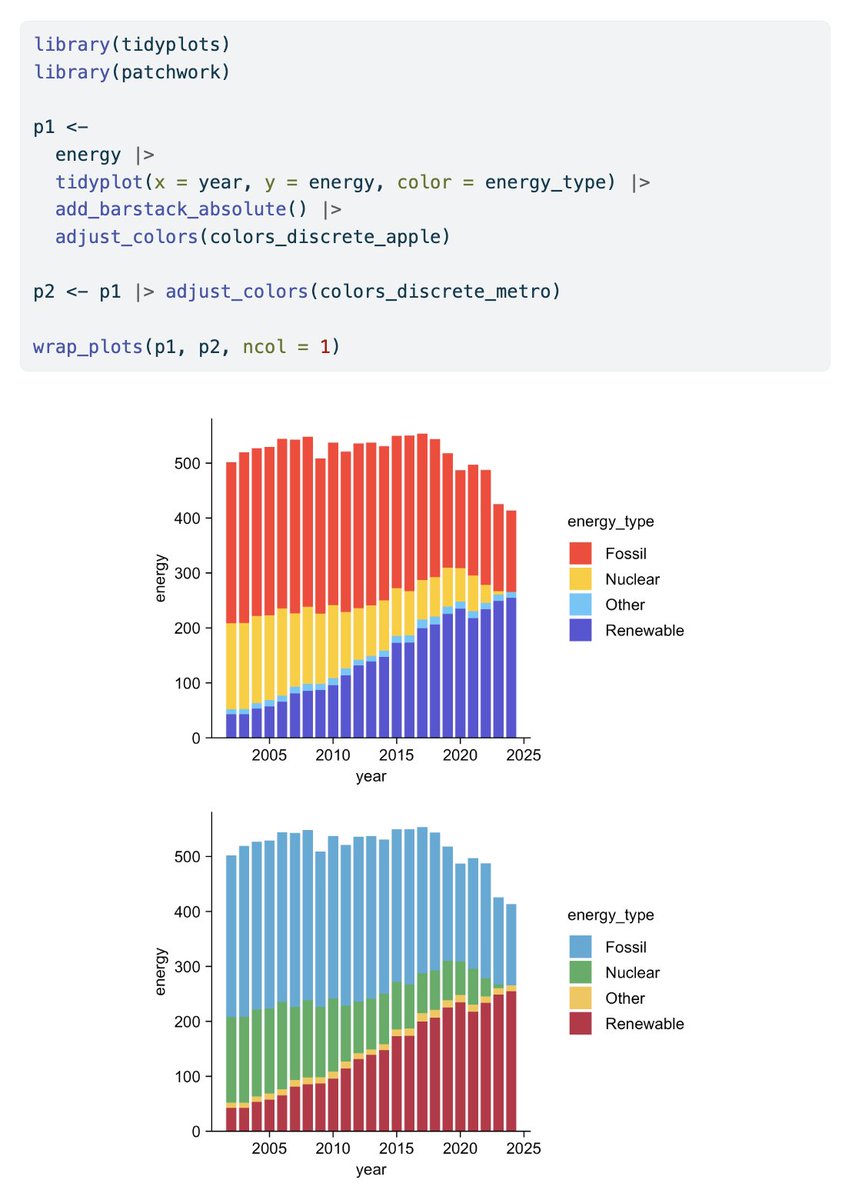
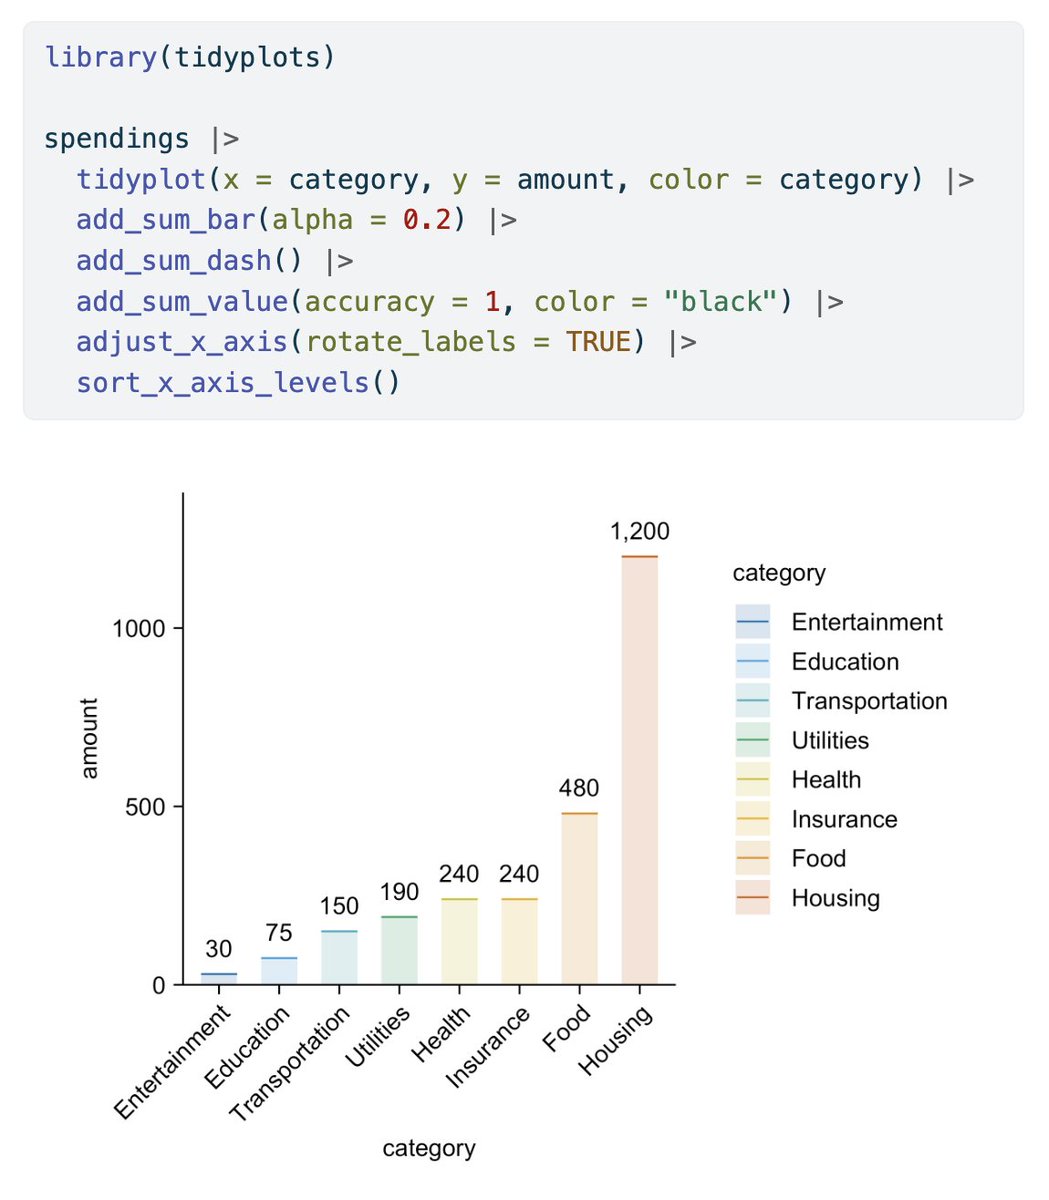
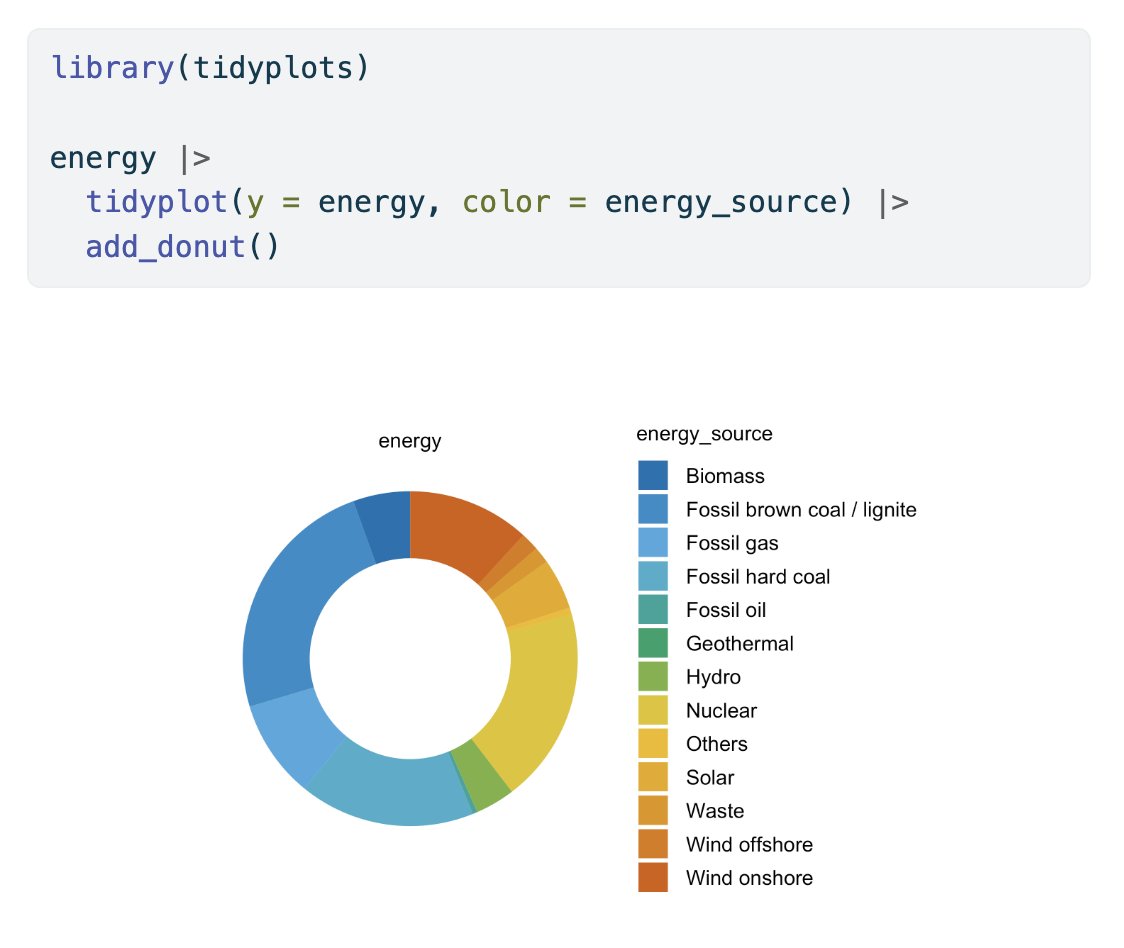
Here are some #tidyplots use cases for proportional data 🔥 Complete with data and code 🚀 tidyplots.org/use-cases/#pro… #rstats #dataviz #phd

This is how you can adjust the plot size in #tidyplots 🔥 All measures are in mm. #rstats #dataviz #phd

This is how you can set a default style in #tidyplots 🎨 jbengler.github.io/tidyplots/refe… #rstats #dataviz #phd

Here are some #tidyplots use cases for data journalism 🔥 Complete with data and code 🚀 tidyplots.org/use-cases/#dat… #rstats #dataviz #phd


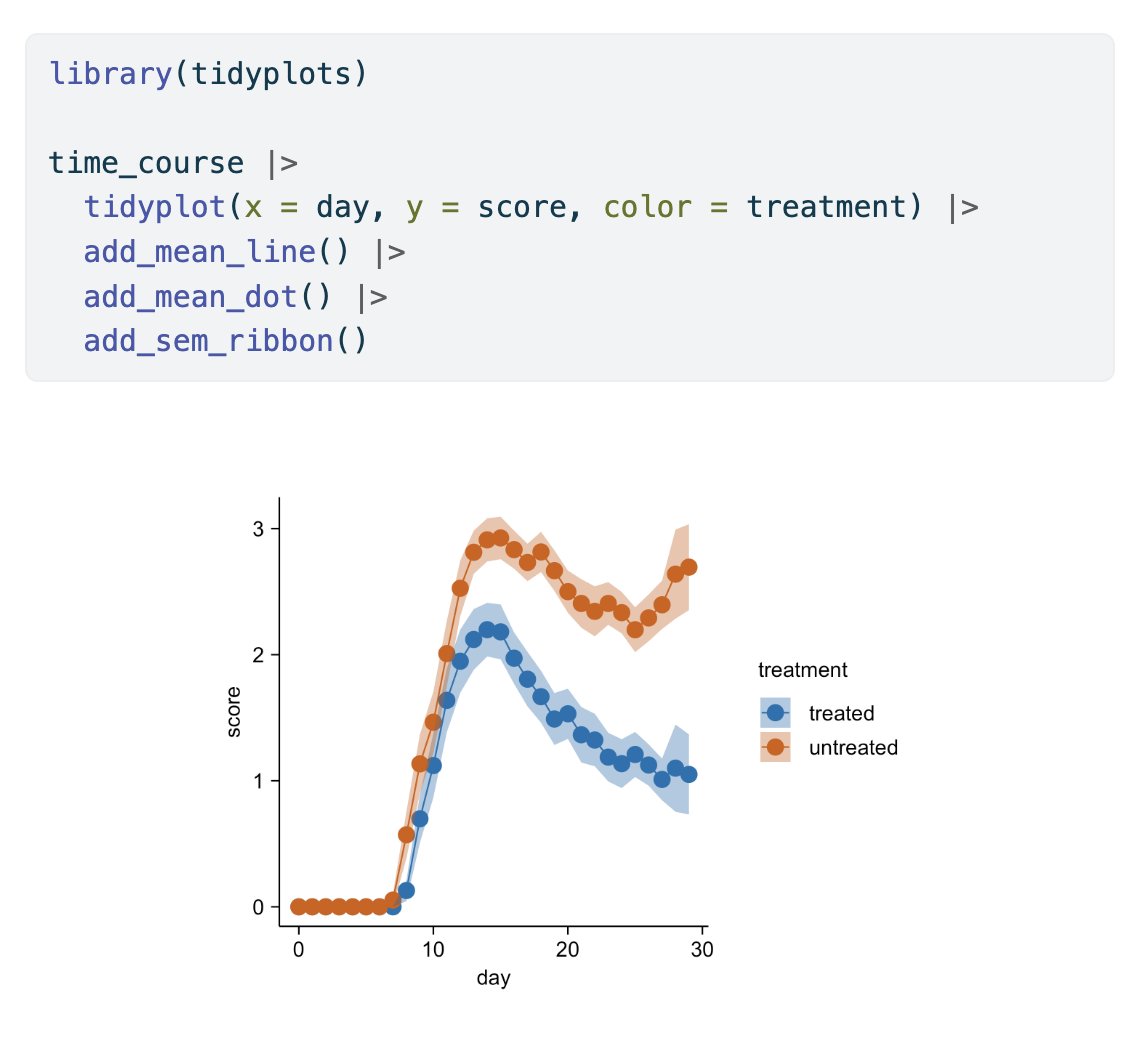
A clear and insightful example of how to visualize time course data effectively using #tidyplots. Great reminder of how visual storytelling can make complex patterns easier to interpret in research and data analysis. Thank you for sharing this, @JanBroderEngler. #rstats…
Thank you for citing #tidyplots 🙏 Marcel S Woo et al. Glia inflammation and cell death pathways drive disease progression in preclinical and early AD. EMBO Molecular Medicine (2025). doi.org/10.1038/s44321… #rstats #dataviz #phd

Tidyplots empowers life scientists with easy code-based data visualization #Tidyplots -- onlinelibrary.wiley.com/doi/10.1002/im…

#tidyplots 美的に見える理由!! これは楽しそうで使ってみたい。 • 洗練された配色 色の組み合わせが素敵 • 一貫性のあるデザイン デザインの統一感が心地良い • ミニマルな要素 伝えたい情報に焦点 • カスタマイズの容易さ 好みに合わせて簡単に調整できそう tidyplots.org
tidyplots.org
Tidyplots – Publication-ready plots for scientific papers
Tidyplots – Publication-ready plots for scientific papers
This is how you can set a default style in #tidyplots 🎨 jbengler.github.io/tidyplots/refe… #rstats #dataviz #phd
Being free and open-source, this is how you can support #tidyplots ❤️ tidyplots.org github.com/jbengler/tidyp… #rstats #dataviz #phd
Exploring datasets effectively starts with smart previews — and this quick look at how to preview subsets in #tidyplots is a great example. A simple yet powerful way to understand your data before diving deeper. Thank you for sharing this insight, @JanBroderEngler. #RStats…
#tidyplots 美的に見える理由!! これは楽しそうで使ってみたい。 • 洗練された配色 色の組み合わせが素敵 • 一貫性のあるデザイン デザインの統一感が心地良い • ミニマルな要素 伝えたい情報に焦点 • カスタマイズの容易さ 好みに合わせて簡単に調整できそう tidyplots.org
tidyplots.org
Tidyplots – Publication-ready plots for scientific papers
Tidyplots – Publication-ready plots for scientific papers
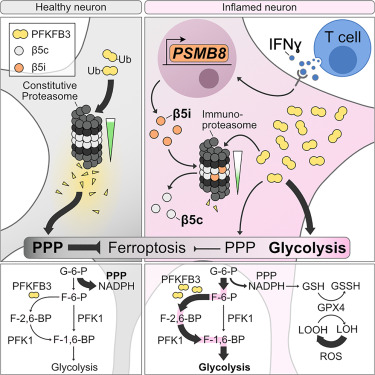
Thank you for citing #tidyplots 🙏 Marcel S. Woo et al. The immunoproteasome disturbs neuronal metabolism and drives neurodegeneration in multiple sclerosis. Cell (2025). cell.com/cell/fulltext/… #rstats #dataviz #phd
This is how you can adjust the plot size in #tidyplots 🔥 All measures are in mm. #rstats #dataviz #phd
Thank you for citing #tidyplots 🙏 Jakub Idkowiak et al. Best practices and tools in R and Python for statistical processing and visualization of lipidomics and metabolomics data. Nature Communications (2025). doi.org/10.1038/s41467… #rstats #dataviz #phd


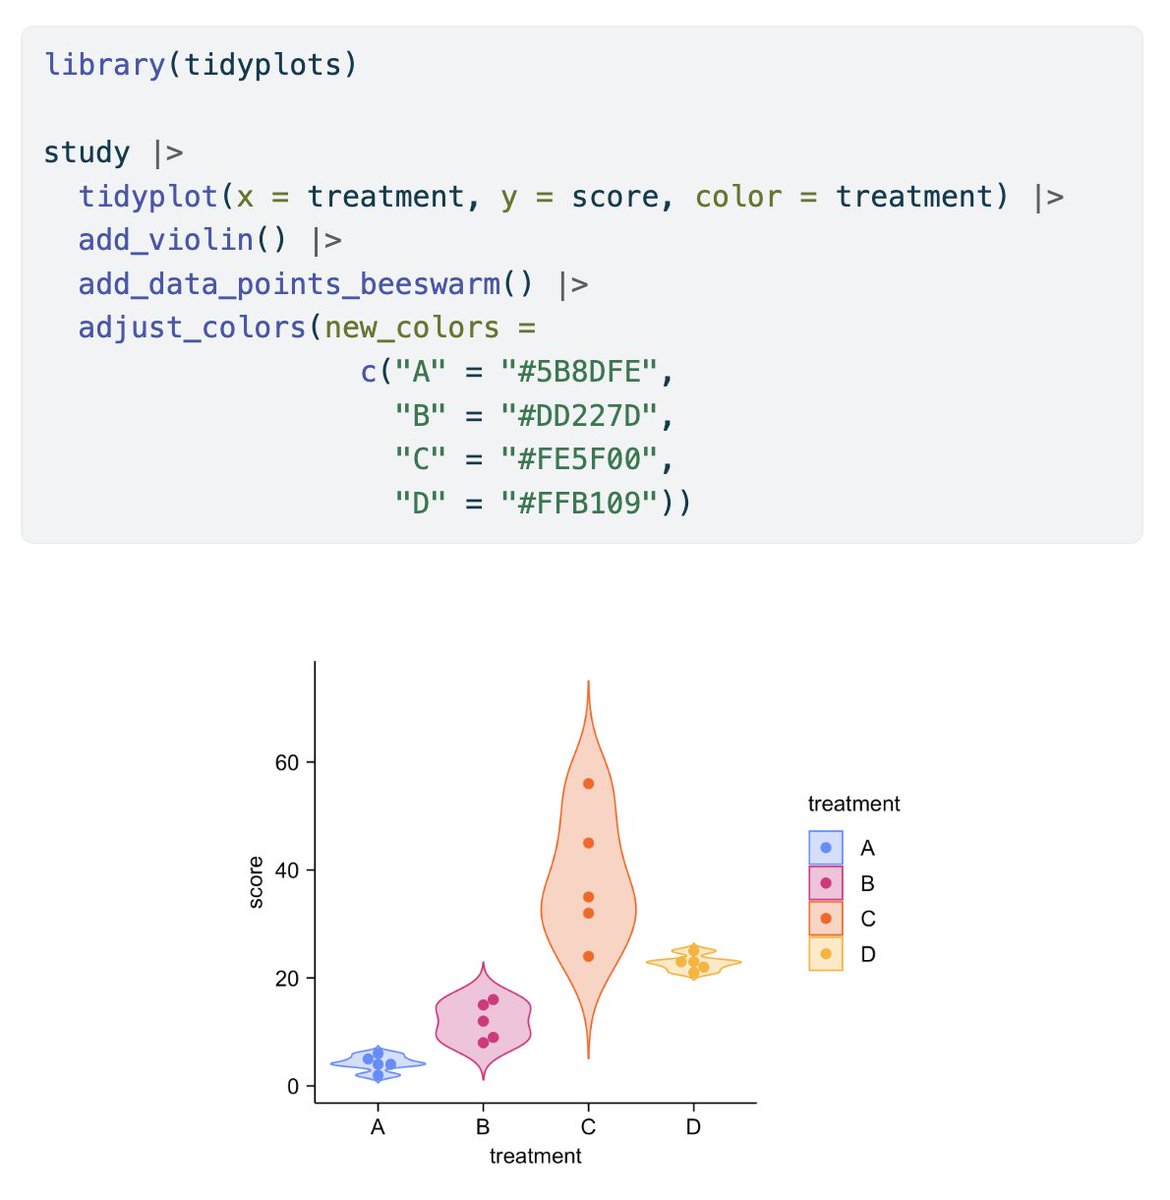
#tidyplots を使ったカテゴリカルデータの可視化。十分に使えそう。
Here are some #tidyplots use cases for proportional data 🔥 Complete with data and code 🚀 tidyplots.org/use-cases/#pro… #rstats #dataviz #phd
Here are some #tidyplots use cases for bioinformatics 🔥 Complete with data and code 🚀 tidyplots.org/use-cases/#bio… #rstats #dataviz #phd
Being free and open-source, this is how you can support #tidyplots ❤️ tidyplots.org github.com/jbengler/tidyp… #rstats #dataviz #phd

This is the anatomy of #tidyplots 🩻 They come in 50 x 50 mm, but can be resized to your linking using `adjust_size()` 🧰 #rstats #dataviz #phd

Here are some #tidyplots use cases for proportional data 🔥 Complete with data and code 🚀 tidyplots.org/use-cases/#pro… #rstats #dataviz #phd
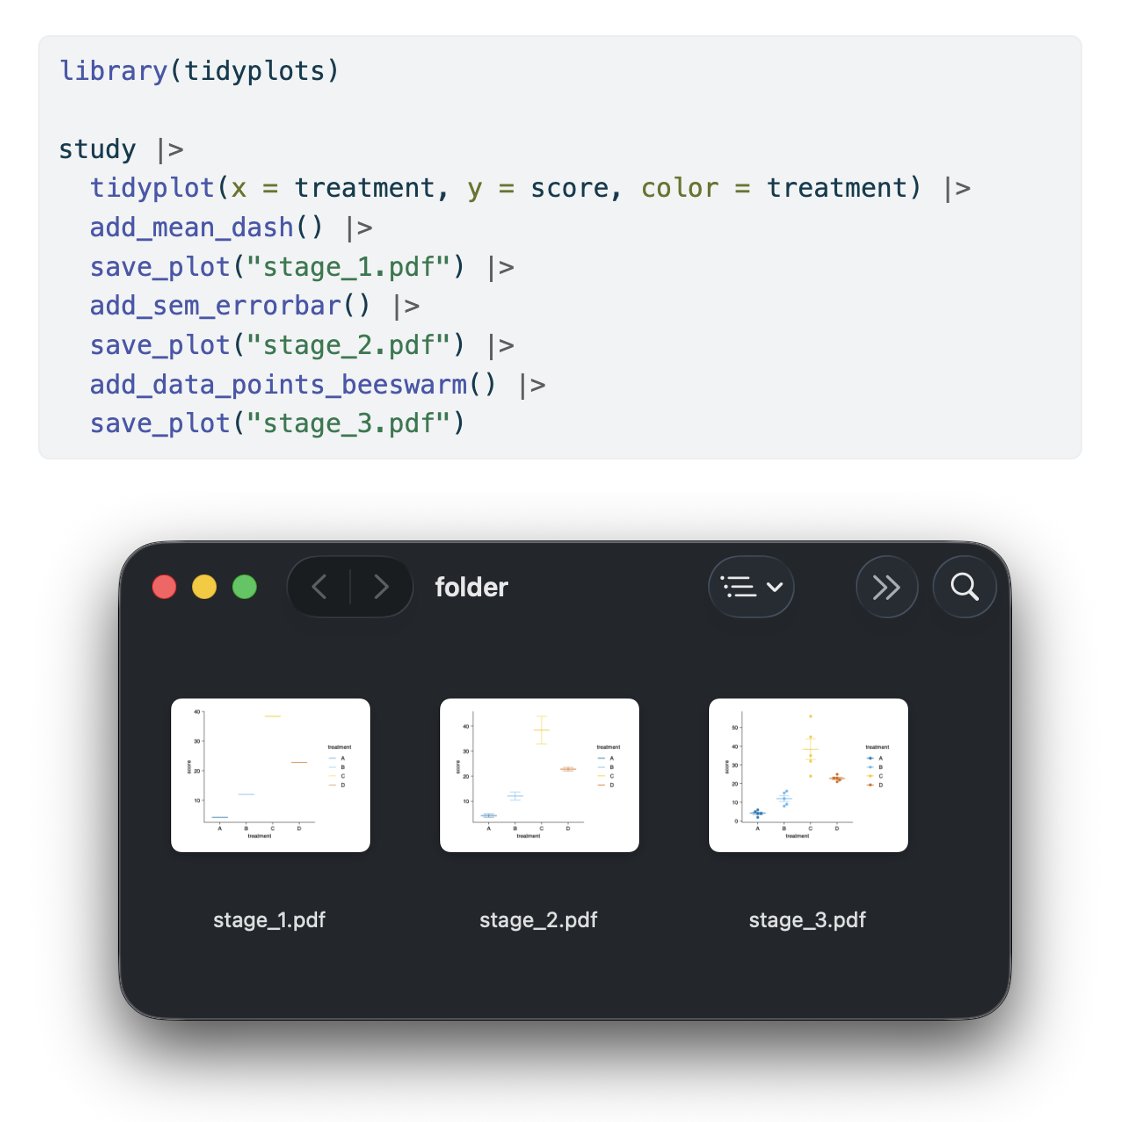
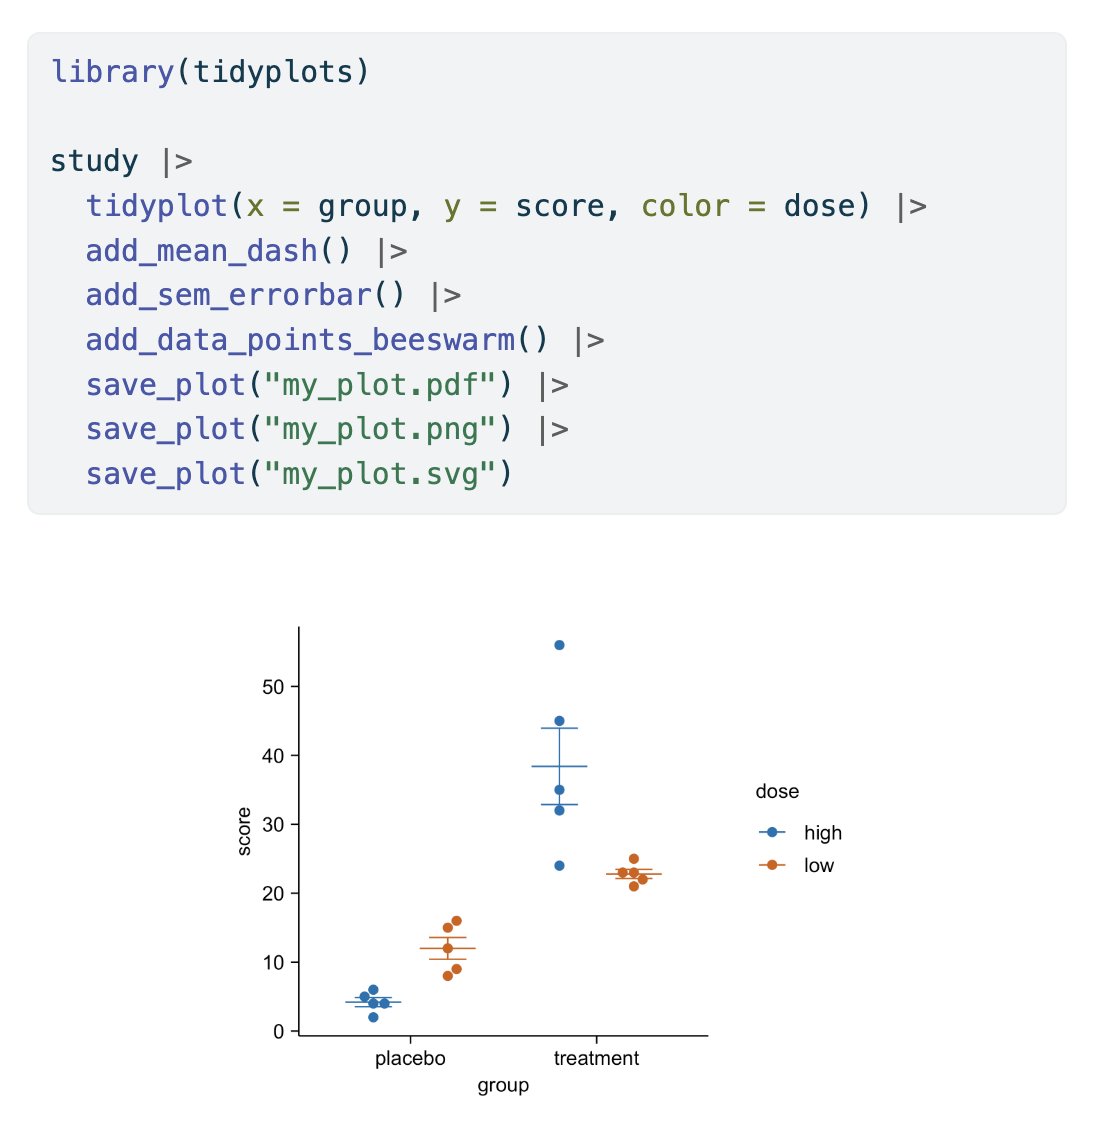
You can save #tidyplots in multiple formats by piping through multiple rounds of `save_plot()` 🤩 #rstats #dataviz #phd
Something went wrong.
Something went wrong.
United States Trends
- 1. #AEWWrestleDream 43.8K posts
- 2. Lincoln Riley 2,203 posts
- 3. Kentucky 24.5K posts
- 4. Stoops 4,461 posts
- 5. Arch 25.4K posts
- 6. Sark 4,236 posts
- 7. Bama 14.7K posts
- 8. #RollTide 7,075 posts
- 9. Notre Dame 14.7K posts
- 10. Texas 168K posts
- 11. Tennessee 51.7K posts
- 12. #UFCVancouver 28.5K posts
- 13. Heupel 2,489 posts
- 14. No Kings 1.7M posts
- 15. #GoIrish 4,879 posts
- 16. Christian Gray N/A
- 17. #HookEm 2,435 posts
- 18. Sam Rivers 16K posts
- 19. Utah 27.4K posts
- 20. Jeremiyah Love 1,894 posts