
Data-Viz
@DanDataViz
Follow & visit http://data-viz.com for all for things related to #DataVisualization 📊
You might like


Learn how to master Figma with our beginner-friendly guide. Create beautiful, collaborative designs for web and mobile with this powerful design tool. #DataVisualization #DataScience data-viz.com/mastering-figm…

A new set of insightful vizzes; appreciating women, celebrating Super Mario Day, diving into the Breaking Bad universe, debating our coffee choices, and a distribution cheat sheet! #DataVisualization #DataScience data-viz.com/data-viz-inspi…


Thrilled to announce the #TableauVisionary leaders of 2023! This group of 50 community leaders inspire us with their Tableau mastery, teaching, and collaboration—and make the #DataFam better for everyone. Learn more about these distinguished leaders. tabsoft.co/3ZdAg5e

A new set of insightful vizzes, from life expectancy and population, to tennis and pizza as well as an important viz on Black American Firsts and the Achievement Gap. #DataVisualization #DataScience data-viz.com/data-viz-inspi…

Week 11 of Data-Viz inspiration. A collection of brilliant and inspiring data visualizations from the last week. #DataVisualization #DataScience data-viz.com/data-viz-inspi…

Learn the pros and cons and discover how to install and use React to design incredible data visualizations. #DataVisualization #DataScience data-viz.com/best-react-cha…

Data visualization is an important tool for presenting and interpreting data in a way that is easy for people to understand. Here are the top ten data visualisation trends. #DataVisualization #DataScience data-viz.com/top-trending-t…

Week 10 of Data-Viz inspiration. A curated collection of unique and inspiring data visualizations from around the web. #DataVisualization #DataScience data-viz.com/data-viz-inspi…

ggplot2 can be a useful and valuable skill for anyone who works with data and wants to create effective and informative visualizations. #DataVisualization #DataScience data-viz.com/beginners-guid…

Week 9 of Data-Viz inspiration. A collection of new and inspiring data visualizations from all over the web. This week's feature is an incredible viz about travel. #DataVisualization #DataScience data-viz.com/data-viz-inspi…

Become a more effective presenter of data with these 11 top tips. #DataVisualization #DataScience data-viz.com/become-a-data-…

Adpot these strategies to enhance your Data Visualizations and effectively communicate key insights. #DataVisualization #DataScience data-viz.com/successful-dat…

The first edition of Data-Viz Inspiration for 2023. This time around, we take a look at a selection of inspiring viz's about Goals, Insurance, Emily in Paris, Maps and Greenhouse Gas. #DataVisualization #DataScience data-viz.com/data-viz-inspi…

Looking to get more value out of your data projects? Struggling to recognise the value? Check out these tips! #DataVisualization #DataScience data-viz.com/maximising-val…

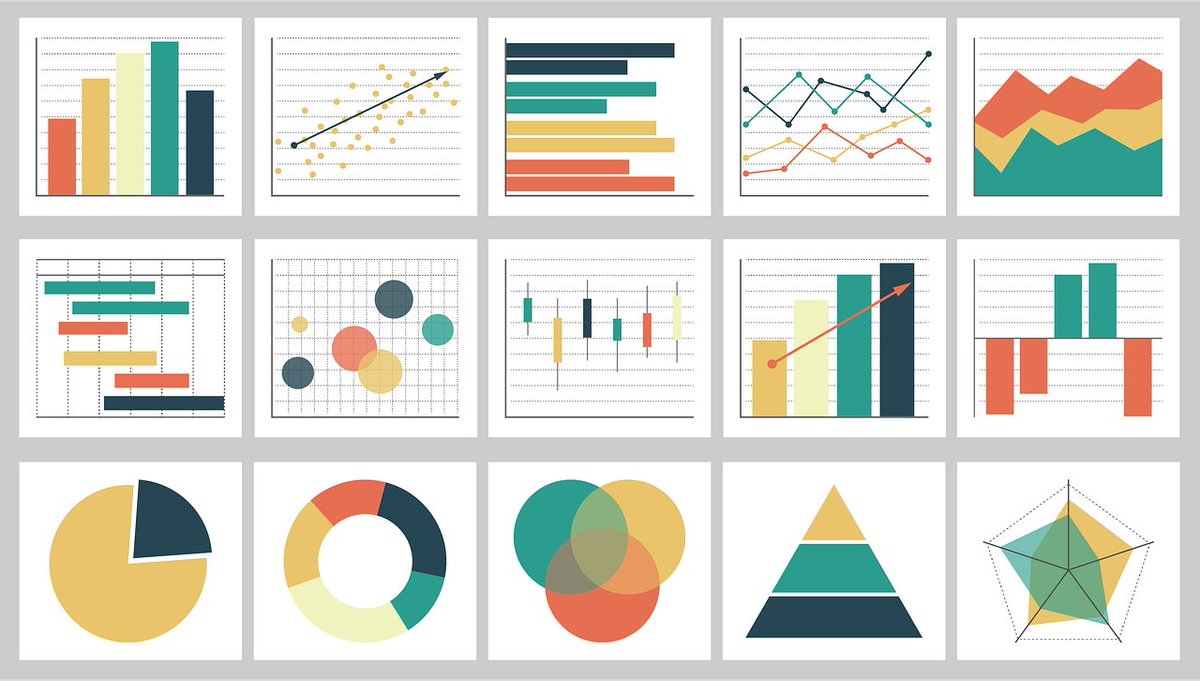
With so many different chart types of charts to choose, it's hard to know which is best for your goal. Here are 32 different chart types to help you decide which to use for your use case. #DataVisualization #DataScience data-viz.com/32-chart-types…
A selection of inspiring data visualizations from more incredible developers. 7th instalment of weekly Data-Viz inspiration! #DataVisualization #DataScience data-viz.com/data-viz-inspi…
There is a high demand for professionals with data analytics skills in various industries. Nail your interview with these top tips. #DataVisualization #DataScience data-viz.com/frequent-data-…

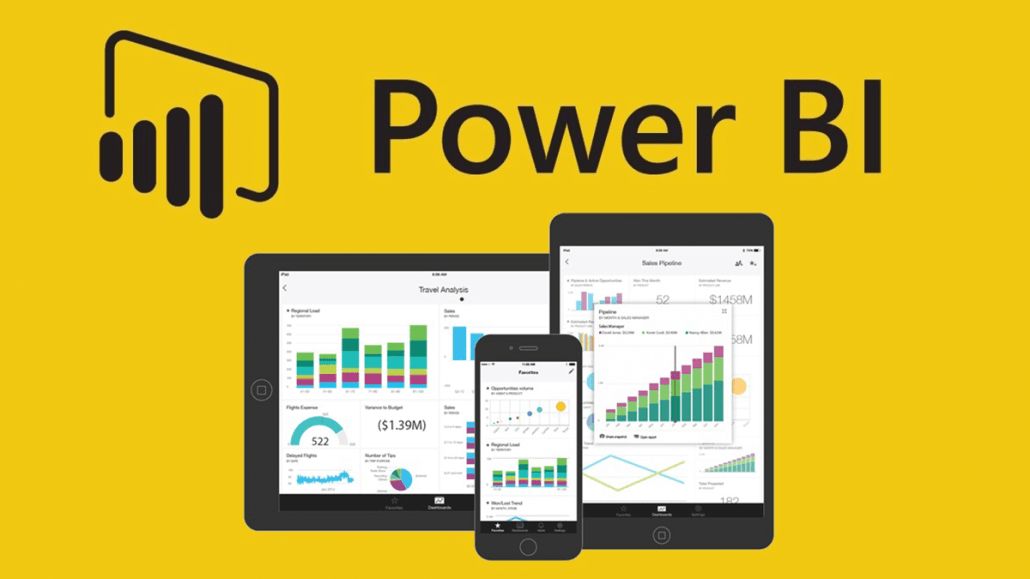
Learn how to access Power BI and unleash its true potential along with its benefits and disadvantages as well as key features! #DataVisualization #DataScience data-viz.com/powerbi-essent…
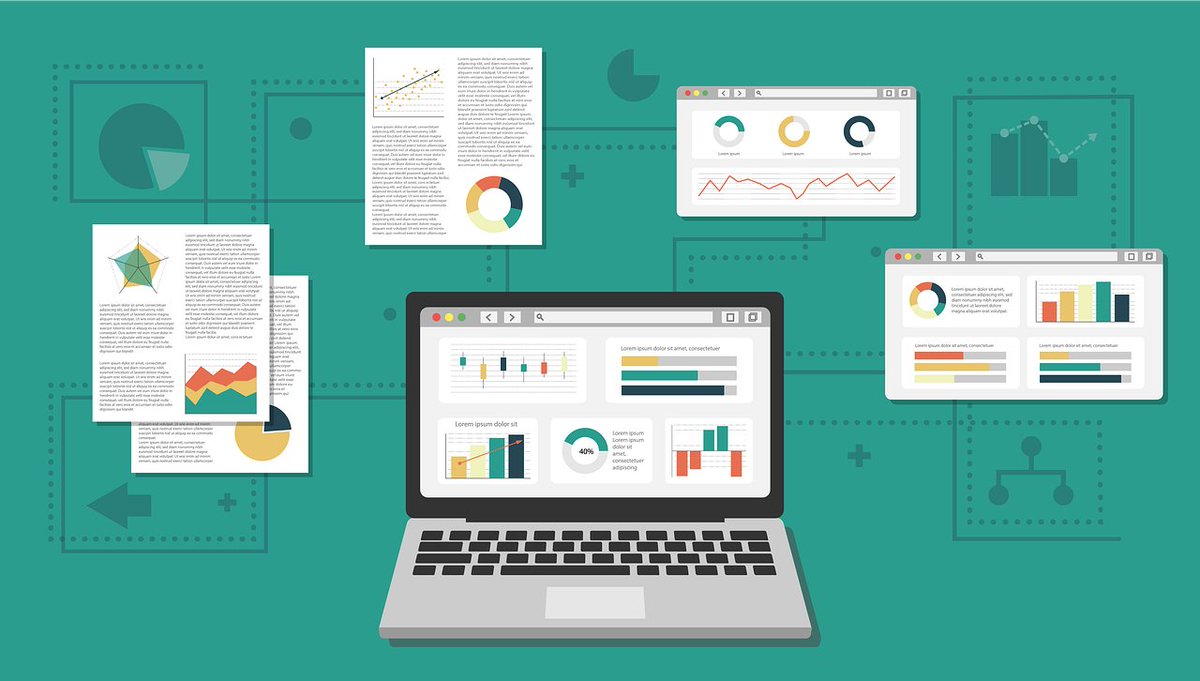
An extensive summary of 20 incredible use cases for Data Visualization. Read this article to improve your understanding. #DataVisualization #DataScience data-viz.com/top-20-data-vi…


United States Trends
- 1. National Guard 196K posts
- 2. Thanksgiving 458K posts
- 3. Arsenal 431K posts
- 4. Liverpool 139K posts
- 5. Slot 116K posts
- 6. Bayern 225K posts
- 7. Frank Ragnow 7,435 posts
- 8. Neuer 22.6K posts
- 9. Blood 163K posts
- 10. Martinelli 27.6K posts
- 11. Konate 16.9K posts
- 12. Anfield 24.5K posts
- 13. Declan Rice 19.6K posts
- 14. Mbappe 116K posts
- 15. Arteta 32.5K posts
- 16. #ARSBAY 8,789 posts
- 17. #COYG 6,700 posts
- 18. Patrick Morrisey 3,986 posts
- 19. Olympiacos 28.2K posts
- 20. Seditious Six 110K posts


Something went wrong.
Something went wrong.