你可能會喜歡


Here's a probability puzzle that breaks everyone's brain: How many people do you need in a room for a >50% chance that at least two of them share a birthday? What's your guess? 100? 150? 183? The answer is shockingly small. [1/5]

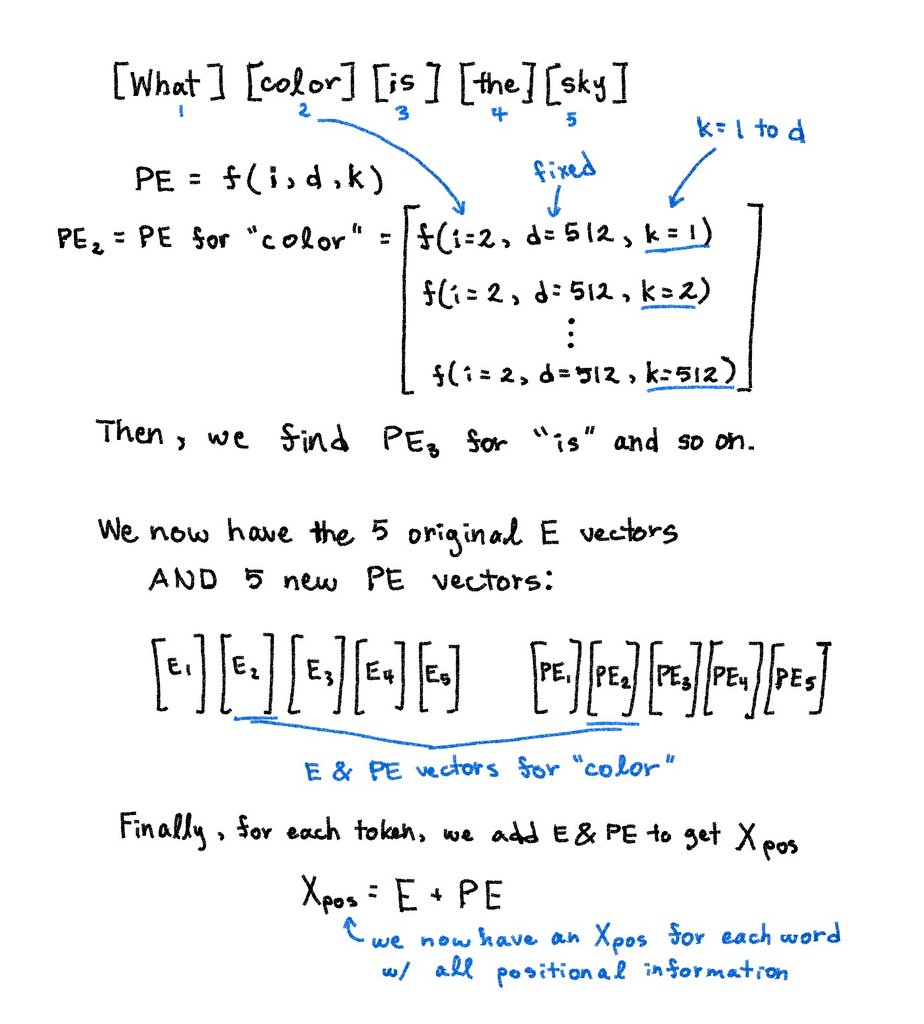
I spent months illustrating how Transformers actually work. Not just what they do, but why they’re built this way. The history, design choices, and intuition behind every layer. From RNNs → Attention → Multi-Head → FFNs → Positional Encoding. Here's everything I wish I…

In machine learning, we use the dot product every day. However, its definition is far from revealing. For instance, what does it have to do with similarity? There is a beautiful geometric explanation behind:


LLM's are just big language models. And language models are pretty easy to understand:

Zero-sum games are where one player's gain is an opponent's loss. This is the core concept behind Generative Adversarial Networks (GANs) in machine learning. A "Generator" network wins by creating fake data that fools a "Discriminator," whose win is catching fakes. This constant,…

The math of LLMs is a fusion of three key areas: 1) Probability: They are massive statistical models that predict the next word based on the probability of what's come before. 2) Linear Algebra: All words and concepts are encoded as high-dimensional vectors (embeddings). The…


Why Do Language Models Hallucinate? disq.us/t/4vrk6k8


Recordeu que si no feu res les vostres dades de X (piulades, likes i altres), l'Elon Musk les fa servir per entrenar el seu Grok, que és la seva joguina d'IA generativa. Cal que ho desactiveu anant a {Configuació i assistència}{Privacitat i seguretat}{Personalització de Grok}


In Germany, a Muslim woman gets furious when she sees two younger girls without hijab. They respond: “This is a public place in Germany. People can kiss, drink, dress, and do whatever they want. If you don’t like it, go somewhere else!”

No.

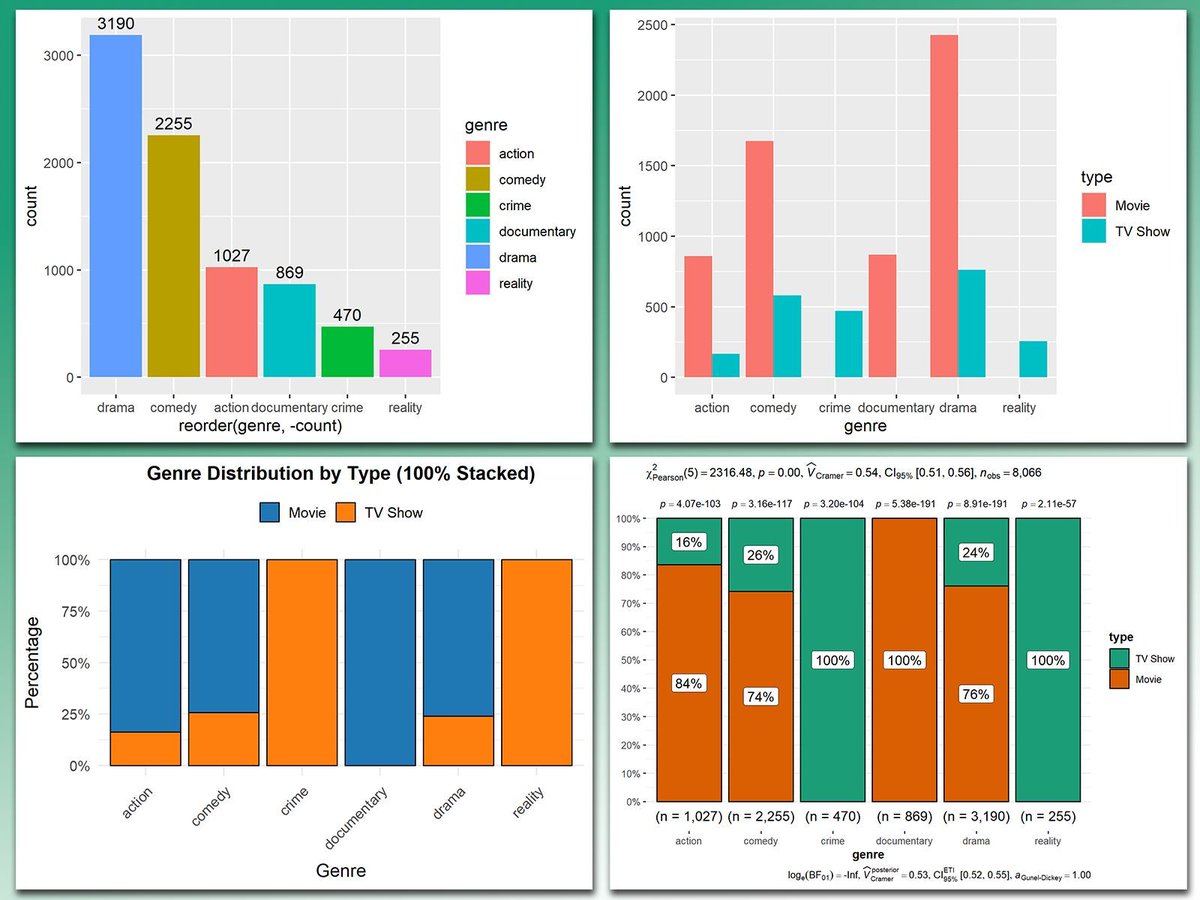
At first glance, bar charts might seem like a simple visualization type. But with a little creativity, they can be enhanced in countless ways to reveal deeper insights and make your data shine. From summarizing counts to comparing proportions, bar charts are a powerful and…


spanishoddata is an R package that provides functions for downloading and formatting Spanish open mobility data released by the Ministry of Transport and Sustainable mobility of Spain (Secretaría de Estado de Transportes, Movilidad y Agenda Urbana 2024). ropenspain.github.io/spanishoddata/

If you ask ChatGPT o1 about its Chain of Thought a few times, OpenAI Support emails you and threatens to revoke your o1 access.


In 1992, Bayer and Diaconis showed that after 7 random riffle shuffles of a deck of 52 cards, every configuration is nearly equally likely

Really happy about seeing this chart of mine in a printed book. @EdwardTufte included my chart on life expectancy vs health expenditure in his latest book!


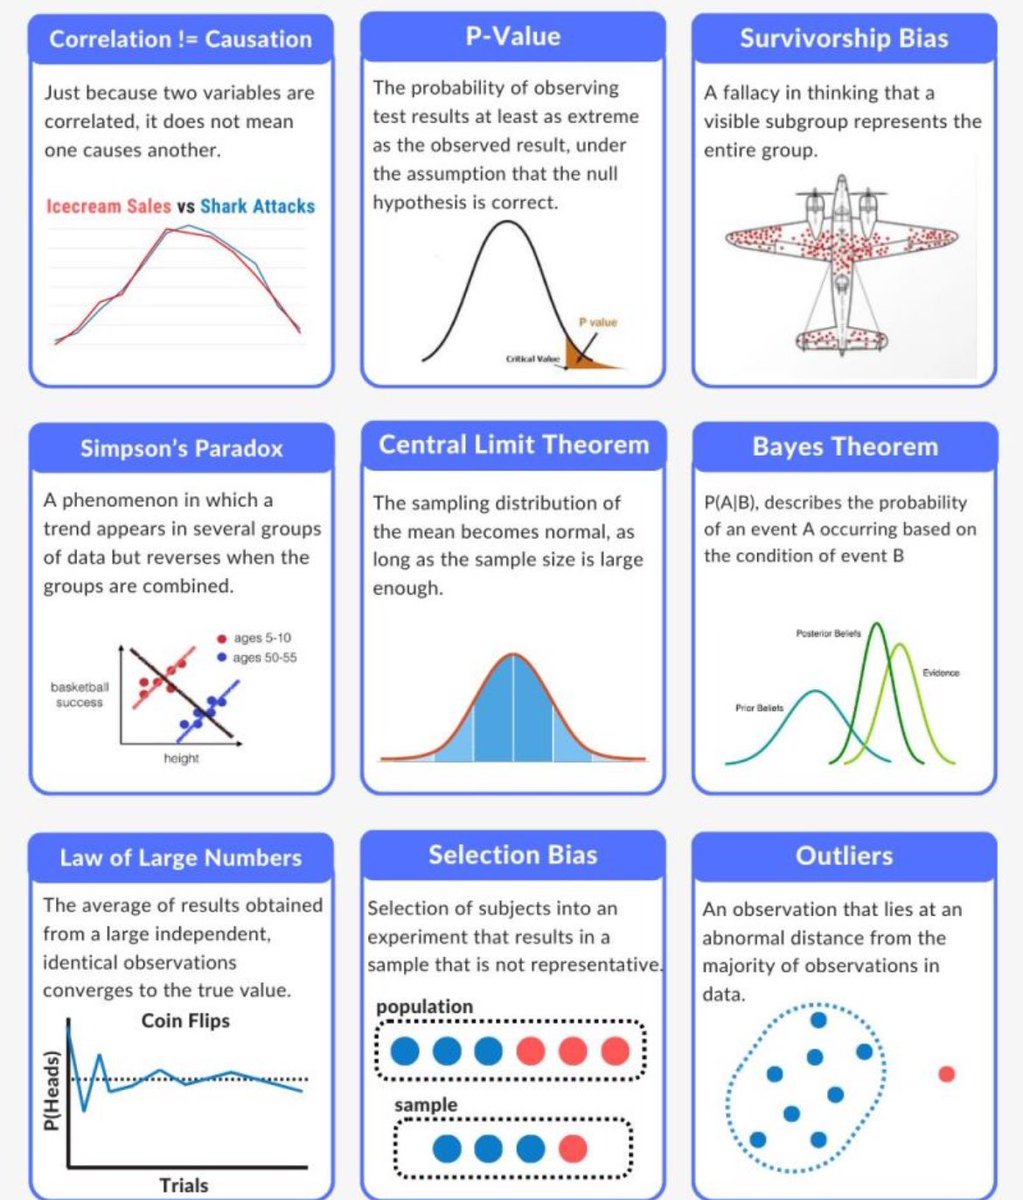
Apophenia: The tendency to see patterns in random data.


United States 趨勢
- 1. #warmertogether N/A
- 2. #NXXT 2,478 posts
- 3. Harvey Weinstein 1,736 posts
- 4. Ben Shapiro 22.1K posts
- 5. Diane Ladd N/A
- 6. #maddiekowalski 2,945 posts
- 7. #BestStockToBuy 1,103 posts
- 8. University of Virginia 1,465 posts
- 9. Gold's Gym 41.7K posts
- 10. #CAVoteYesProp50 2,982 posts
- 11. Shannon Library 1,469 posts
- 12. Laura Dern N/A
- 13. Ndiaye 6,625 posts
- 14. Clemens 1,552 posts
- 15. Murray State 1,207 posts
- 16. Mumdumi 8,169 posts
- 17. Blueface 4,426 posts
- 18. Cardinals 11K posts
- 19. Taliah Scott N/A
- 20. 60 Minutes 170K posts
你可能會喜歡
-
 Data Science Council of America
@DASCA_Insights -
 Cristian Ianculovici
@CrisIanculovici -
 Steve Roemerman
@SDRoem -
 Kazim Bahar
@Kazim_Bahar -
 Alexacene
@AlexaceneEra -
 Dirk Lukaschik
@Dirk_Lukaschik -
 Thomas Poetter p/acc
@ThomasPoetter -
 Paul Gurnett
@quepasachico -
 Prudence
@Kojo_p_ -
 BC
BC
@icecoldBC -
 Paul Viorel
@PaulFogoros -
 Federico Aguggini 🇮🇹
@Fede_Aguggini -
 John Hassman
@JohnHassman -
 Jordi Casas-Roma
@jcasasr
Something went wrong.
Something went wrong.