
D3.js Community
@d3visualization
We ♥ D3.js. Official #D3js community account. Curated by Christophe Viau
You might like


The Vega Project is happy to announce the release of version 5.3.0 of the Vega-Altair Python visualization library. This release has been 4 months in the making and includes enhancements, fixes, and documentation improvements from 11 contributors. Highlights in 🧵

Pretty wild: 38 million people's income on a single chart (2 decades' data!!) Check it out: jaanli.github.io/american-commu… Thank you @recifs and @mbostock for the tips on asynchronous JavaScript!! This new @observablehq framework + @duckdb enables really, really cool new applications.
Woah this is much nicer thanks to @recifs's wizardry with Observable Plot! Updated the Census visuals: jaanli.github.io/american-commu… (& officially sold on the @duckdb -> @getdbt -> @observablehq workflow; scalable to millions of peoples'/households' data & rendered gorgeously ^_^)


Today we’re launching a bold new vision: an open-source static site generator — Observable Framework — for creating fast, beautiful data apps you can host anywhere. Use JavaScript for interactive graphics with Python, R, or any language for data analysis. observablehq.com


Late last night the number of downloaded copies of my books went past 100,000. Nice milestone for the end of the year. All available for free from @leanpub - leanpub.com/u/d3noob


Remember bl.ocks.org? I made a little search engine on @observablehq with almost 38K blocks collected by @enjalot. Since all the data is local, already cleaned-up and cached, you can search by description, color or API. And it's faaast! observablehq.com/@davo/blocks-s…
The Vega Projects now have a charter, steering committee, documented governance, and easier ways for people to become maintainers at github.com/vega/.github.


earth.nullschool.net was launched 10 years ago today! 🎉 At the time, I couldn’t have imagined the longevity and impact this project would have. To all the users and fans over the years: thank you. And with this anniversary, an announcement:


earth.nullschool.net: an animated map of global wind conditions

I've written a blog post on creating large-scale interactive force-directed graphs, with PIXI.js v7 handling the rendering and D3.js for the force simulation abilities. I also compared rendering between PIXI and D3. dianaow.com/blog/pixijs-d3… #dataviz #networkviz #pixijs @PixiJS


The HCI and Visualization group at Autodesk Research (@ADSKResearch) is looking for graduate interns and postdocs to host in Toronto for 2024. We have a focus on HCI+AI, but also software learning, visualization, AR/VR, novel interaction techniques, creativity support, and more!

📣 Data journalism isn't a fad, a prestige play, a loss leader or a "nice to have." Readers want it; More than almost anything else legacy outlets publish. It's become a fundamental piece of the paywall business model. 👇 But you don't have to take it from me. 👇

Bloomberg is expanding its data journalism and visualization teams globally by hiring approximately 40 new data journalists, data visualization reporters, editors and engineers. a thread 🧵…


📣Last chance to apply for our two roles in #dataviz! We're reviewing applications and will begin interviews shortly. Apply by the end of this week to be considered: 📐 Lead Information Designer: infogr8.com/lead-informati… 💻 Creative Technologist: infogr8.com/creative-techn…


New project! Mosaic is a framework for scalable and interoperable visualization that unifies visualization toolkits with scalable visualization methods and query optimizations. uwdata.github.io/mosaic/what-is…
A collection of examples using #d3js and #svelte awesome-svelte-and-d3.netlify.app


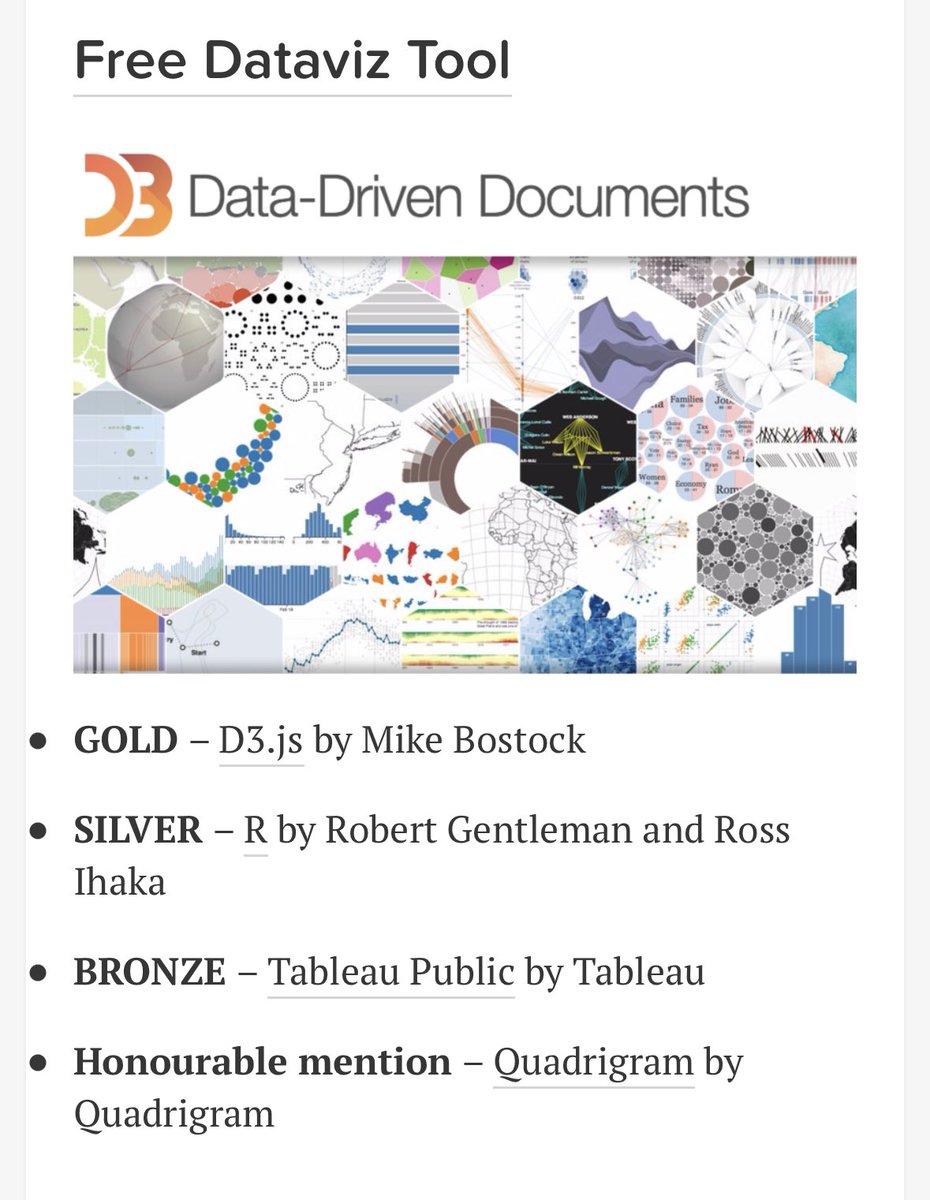
Randomly checking old @infobeautyaward winners and wow, 2015 was quite the year in the free dataviz tools category. informationisbeautifulawards.com/news/116-2015-…


Join us!! SCMP is seeking an experienced and enterprising professional to join its award-winning graphics team. Follow the link corp.scmp.com/job-detail/G3K…


I started a company! it's called Latent Interfaces and I see it as a vehicle for exploring latent spaces by building new kinds of data interfaces. I shared my first update on what we're doing in my newsletter: enjalot.substack.com/p/latent-inter…

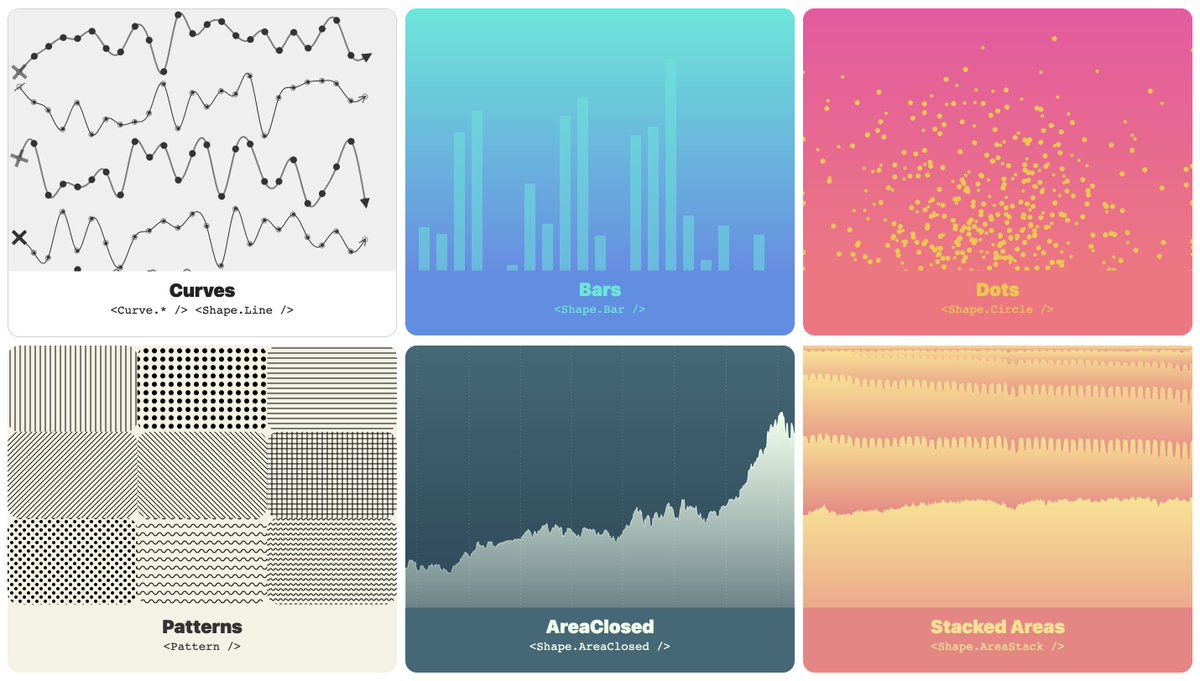
I'm glad to see that airbnb.io/visx/, #d3js viz primitives for #react, is still well maintained since 2017 by @AirbnbEng

We’re back! ⚡️🔥🎊 Le 14 mars, c’est le grand retour du meetup #datavisparis. Nous aurons deux interventions que vous voulez pas rater ! Avec : 🍋 @datacitron 🎨 Florent Lavergne Pour vous inscrire: meetu.ps/e/LThs5/tNWQH/i


United States Trends
- 1. phil 43K posts
- 2. phan 60.8K posts
- 3. Columbus 200K posts
- 4. President Trump 1.22M posts
- 5. Middle East 303K posts
- 6. Thanksgiving 58.7K posts
- 7. #LGRW 1,892 posts
- 8. Cam Talbot N/A
- 9. Yesavage 2,959 posts
- 10. Brian Callahan 12.5K posts
- 11. #IndigenousPeoplesDay 16.5K posts
- 12. Titans 37K posts
- 13. Macron 235K posts
- 14. Azzi 10.6K posts
- 15. HAZBINTOOZ 7,681 posts
- 16. Cejudo 1,469 posts
- 17. #UFC323 5,195 posts
- 18. Cape Verde 25.7K posts
- 19. Vrabel 6,836 posts
- 20. Mike McCoy N/A
You might like
-
 Mike Bostock
@mbostock -
 Nadieh Bremer
@NadiehBremer -
 Shirley Wu
@sxywu -
 Cole Knaflic
@storywithdata -
 Federica Fragapane
@fedfragapane -
 IEEE VIS
@ieeevis -
 Curran Kelleher
@currankelleher -
 Nathan Yau
@flowingdata -
 Observable
@observablehq -
 Jason Davies
@jasondavies -
 Valentina D'Efilippo
@defilippovale -
 Jon Schwabish
@jschwabish
Something went wrong.
Something went wrong.