
Fun With Data
@funwithdata_ca
We’re a team of data enthusiasts and storytellers. Our goal is to tell engaging stories that ignite interest in data.

Fintech, big tech, and banks are reshaping finance—sometimes competing, often collaborating. Public policy must keep pace, Aldasoro, Frost, and Shreeti write in F&D magazine. imf.org/en/Publication…

We've been diving into Cole Knafflic's book Storytelling With Data to improve our charts. Here are our 10 takeaways. Shout out to @storywithdata for this incredible resource. Read more here➡️bit.ly/chart-design-t…


Hey friends! We're working on an article comparing the salaries of members of provincial legislatures across Canada. Does anyone know where we can find the base salary of #Ontario MPPs and the top-ups awarded to ministers, opposition leaders, and others? #DataAnalytics

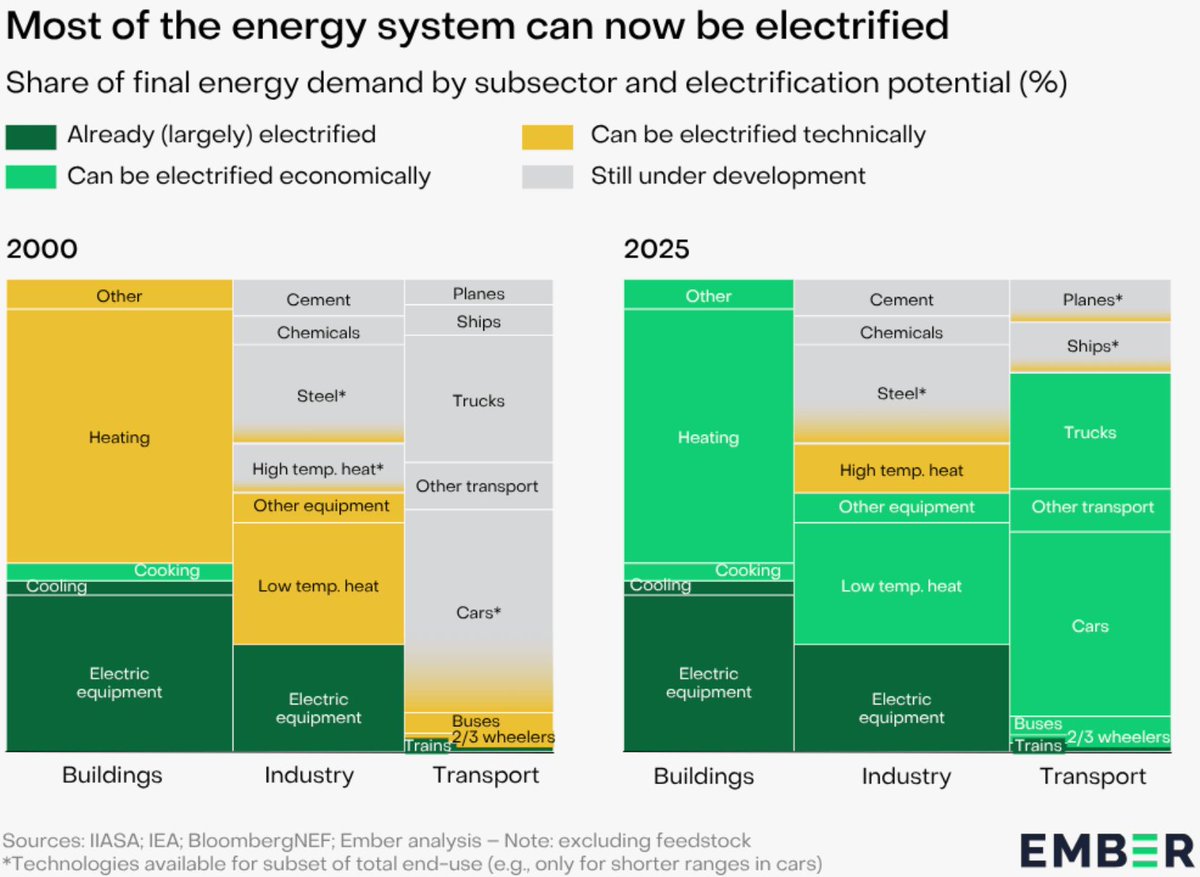
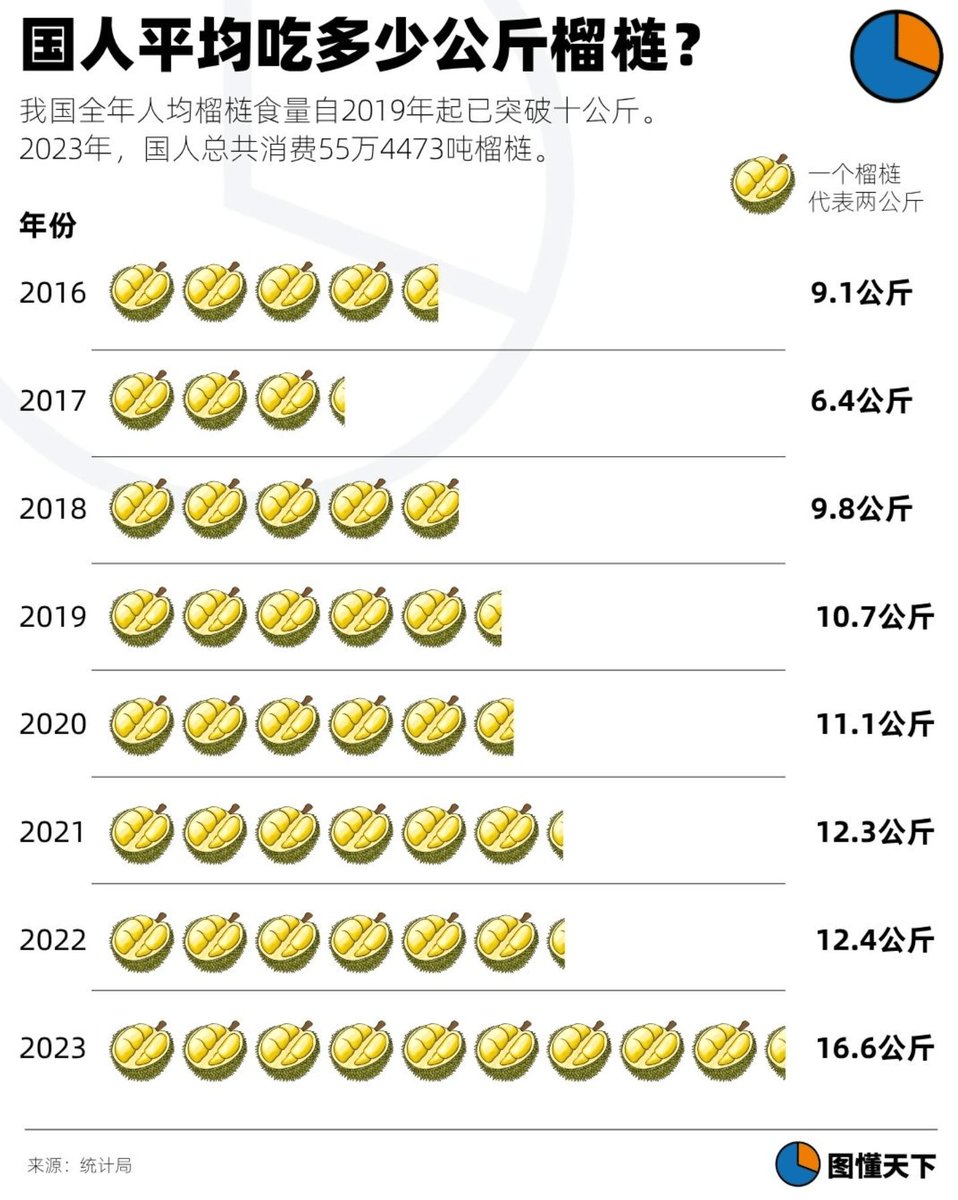
📊 This week's Data Vis Dispatch brings you a healthy mix of charts and maps, covering topics like clean energy, construction, or durians. 🏗️ ☀️ datawrapper.de/blog/data-vis-…


Envisioning how AI can advance human development can inspire the general direction to aim towards, leaving flexibility to adapt to unique national and local contexts to find ways for AI to be made to work for people. Read more: wrld.bg/7Vof50Wu6VT

Qatar tops the list of the fastest-growing nations between 2005 and 2024, while Bosnia experienced the steepest decline. Explore how global population growth is reshaping the world. bit.ly/global-populat…

We regularly use data produced by @worldbankdata. We've wondered how the World Bank classifies countries by income. @OurWorldInData provides an excellent overview here ➡️bit.ly/3GVg7NP
ourworldindata.org
How does the World Bank classify countries by income?
The World Bank classifies countries into four income groups based on average income per person. This article explains how these groups are defined.
How much electricity does Canada export to the United States? Dig into the facts here. #CanadaFacts funwithdata.ca/canada-facts/e…

How can you combine the detail of a locator map with the data-driven power of a symbol map? All it takes is a little arithmetic! 🧮 Michi from our support team creates a map of the London tube and shows you how to create symbol-style locator maps too: datawrapper.de/blog/rescale-l…

What are housing starts and why does it matter? Our team digs into why housing starts are a closely followed economic metric and explores housing construction trends across Canada. bit.ly/what-are-housi… #Data #Canada
Shout out to @storywithdata! What an achievement!

Fun news: #DaphneDrawsData is on the Info is Beautiful Awards Longlist! informationisbeautifulawards.com/showcase/7195-… @DataVizSociety @infobeautyaward

In 2023, Canada was the top source of crude oil imported by the United States, accounting for about 60% of its total crude oil imports. Between 2013 and 2023, crude oil imports into the United States from Canada increased by 33%. bit.ly/crude-oil-expo… #canada #Oil

In 2023, Canada’s GDP reached $2.38 trillion, up 1.2% from 2022. The three sectors that contributed the most to Canada’s GDP were real estate and rental and leasing; manufacturing; and health care and social services. bit.ly/GDP-of-Canada #canadafacts #GDP

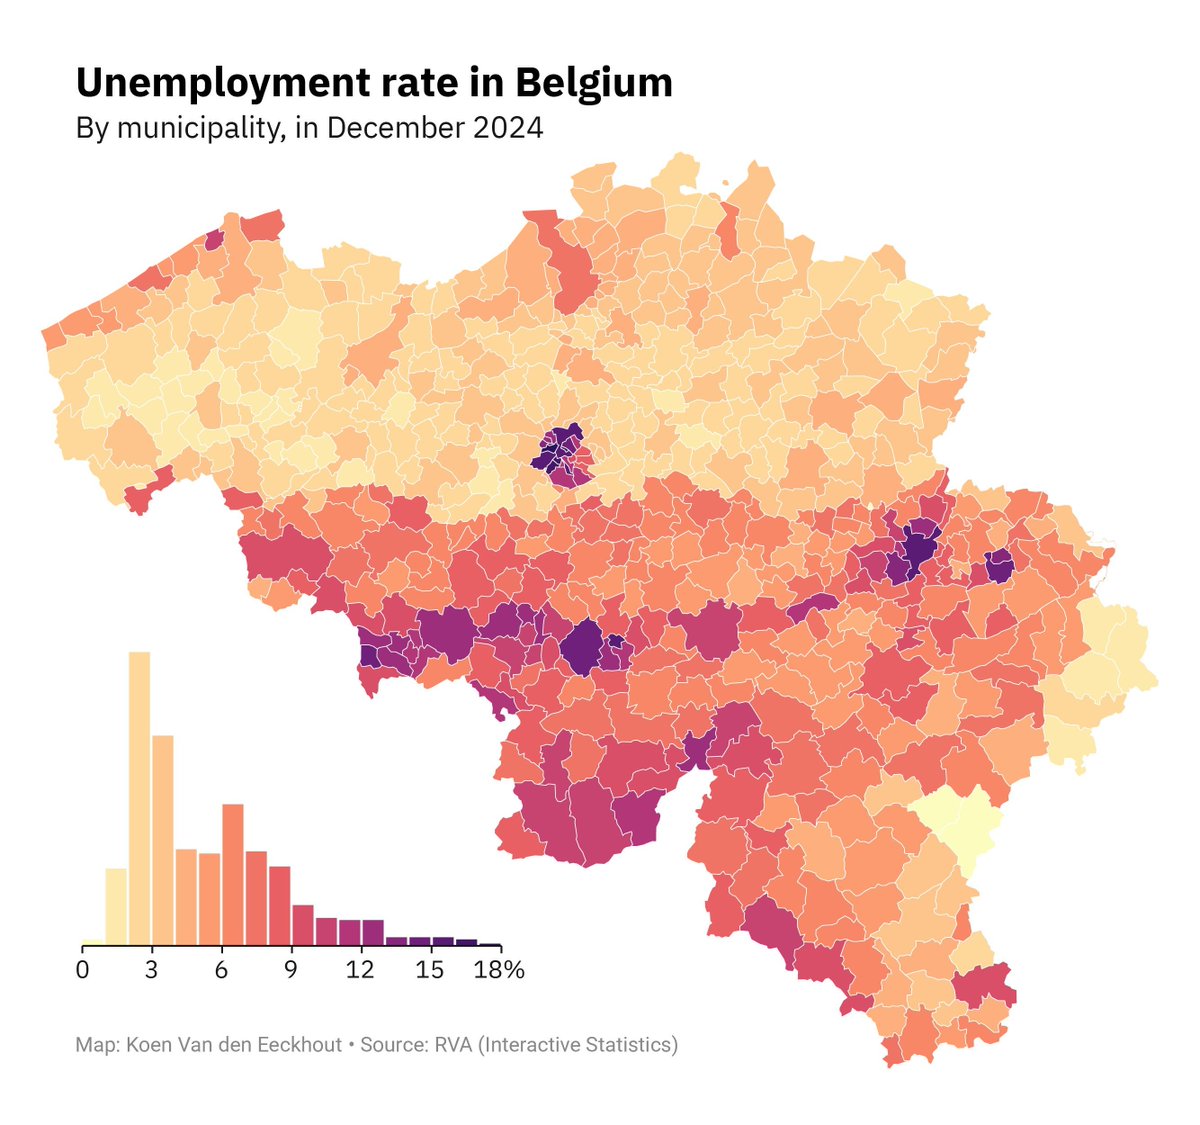
What a wonderful idea! Never thought of using the legend as a histogram. Thanks for sharing this technique! Time to explore how we can incorporate this into future choropleth maps!

Here's a cool, simple technique I learned from Joey @Cherdarchuk: in a choropleth map, your legend can double as a histogram - showing both the colour coding ánd the data distribution. #maps #dataviz
Solo living has become the most common arrangement for households in the United States— Households in the United States have changed significantly over the last 60 years. In 1960, 43% of households were couples with children, but this had dropped to 24% by 2015. Once a…

Interested in learning more about government finances? We dig into the Canadian government's finances to learn about how much it spends annually, and what it spends the money on. Here's what we found: bit.ly/federal-govern… #Canada #finance #economics

🗺️ Interested in maps? Read "How to Lie with Maps" with us, a classic on projections, symbols, and the subtle art of manipulation. 📝 Join the written online discussion on March 31! More info on @datavisclub and our blog: blog.datawrapper.de/how-to-lie-wit…

In every country in the world, women tend to live longer than men— You can see this in the chart, which shows the average life expectancy of women on the vertical axis and the life expectancy of men on the horizontal axis, both for 2023. Each dot is one country. As you can see,…

In 2022, Canada's median after-tax household income was $70,500, a decline of 3.4% or $2,500 from $73,000 in 2021. We look at how median after-tax household income has changed over the years. bit.ly/median-househo…


United States Trends
- 1. #FanCashDropPromotion 1,475 posts
- 2. Good Friday 56.2K posts
- 3. #FridayVibes 4,543 posts
- 4. #PETITCOUSSIN 16.7K posts
- 5. Talus Labs 25.9K posts
- 6. #HONGJOONG_FASHION_SHOW 4,071 posts
- 7. Publix 1,837 posts
- 8. #FridayFeeling 2,801 posts
- 9. elise 10.3K posts
- 10. Happy Friyay 1,340 posts
- 11. Tammy Faye 3,463 posts
- 12. Sydney Sweeney 105K posts
- 13. RED Friday 4,100 posts
- 14. Dizzy 7,058 posts
- 15. Finally Friday 4,375 posts
- 16. John Wayne 1,680 posts
- 17. Kehlani 17.9K posts
- 18. Happy N7 1,583 posts
- 19. Hochul 14.7K posts
- 20. Out The Window 12.1K posts
Something went wrong.
Something went wrong.