
내가 좋아할 만한 콘텐츠


Join us Dec 9 at 11am EST for a focused, technical session on what’s new and what’s coming next in Plotly Studio! ✨ We’ll cover: • Newly released features • In-progress development • User challenges You’ll hear directly from the team building Plotly Studio, including…

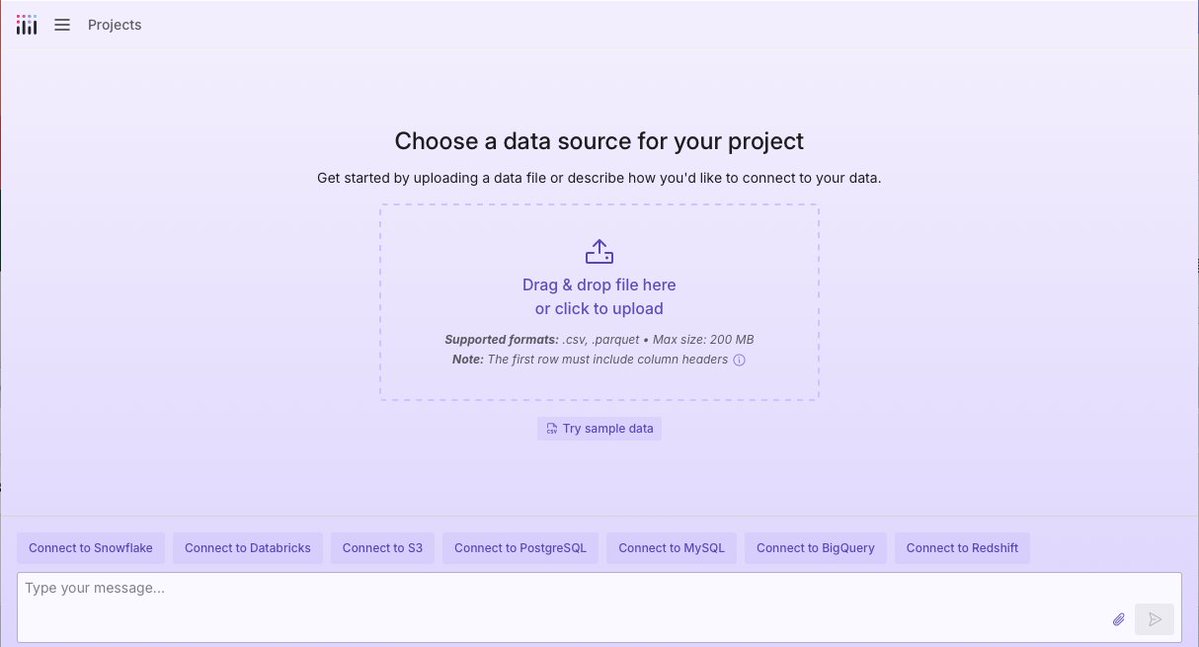
New in Plotly Studio: Enterprise-Grade Data Connections! Join us Dec 16 at 11am EST for a live demo showing how Plotly Studio makes connecting, refreshing, and preparing your data faster and smarter. 🔌 Connect directly to warehouses, databases, and cloud sources ⚡ Perform…
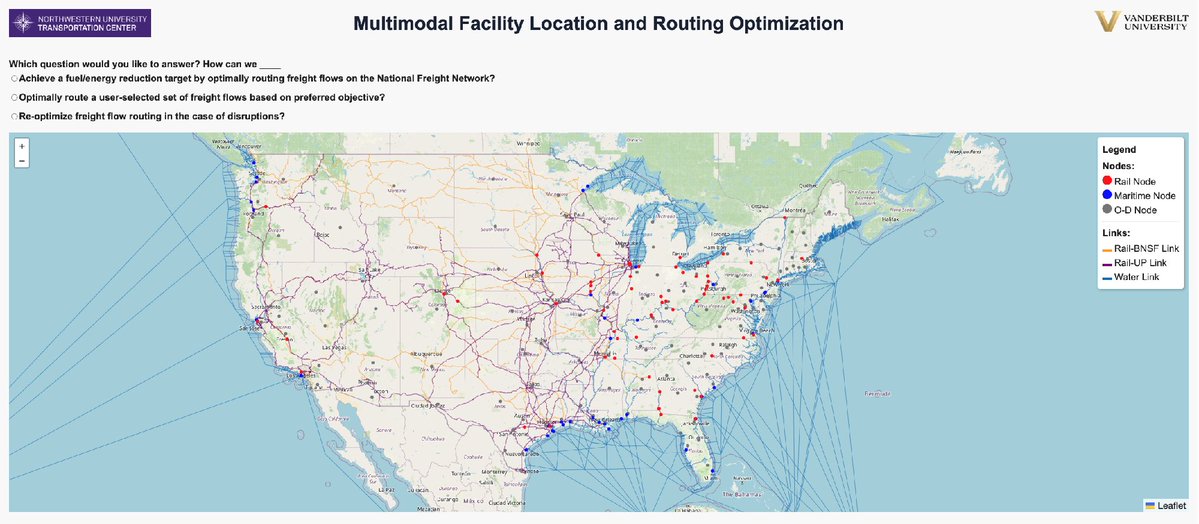
🚛📊 Northwestern University's Transportation Center just launched the IMAGINED Dashboard (Beta) — a powerful Dash app for modeling and optimizing the future of U.S. freight. Explore interactive tools for: • Freight flow forecasting • Logistics routing & cost/emissions…
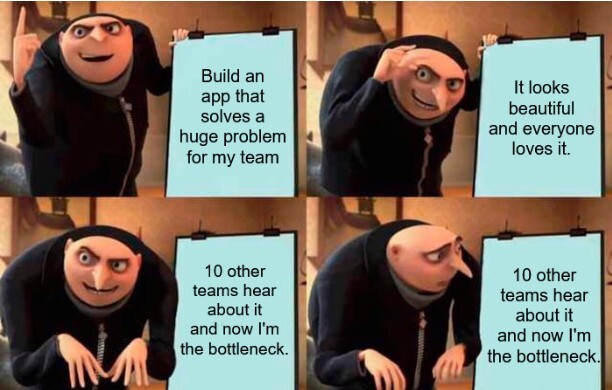
Your analysis solves a real problem for your team. Then ten other teams hear about it and want their own version. Suddenly you're the bottleneck. Scaling from one application to many requires infrastructure that can handle it without turning you into a platform engineer. The…
Join us Dec 16 at 11am EST for a deep dive into what’s new in Plotly Studio. 📊🚀 We’re rolling out upgrades across data connectivity, workflow, specs, chart exploration, and in-app docs — all designed to make vibe analytics faster, more reliable, and easier to scale. Expect a…

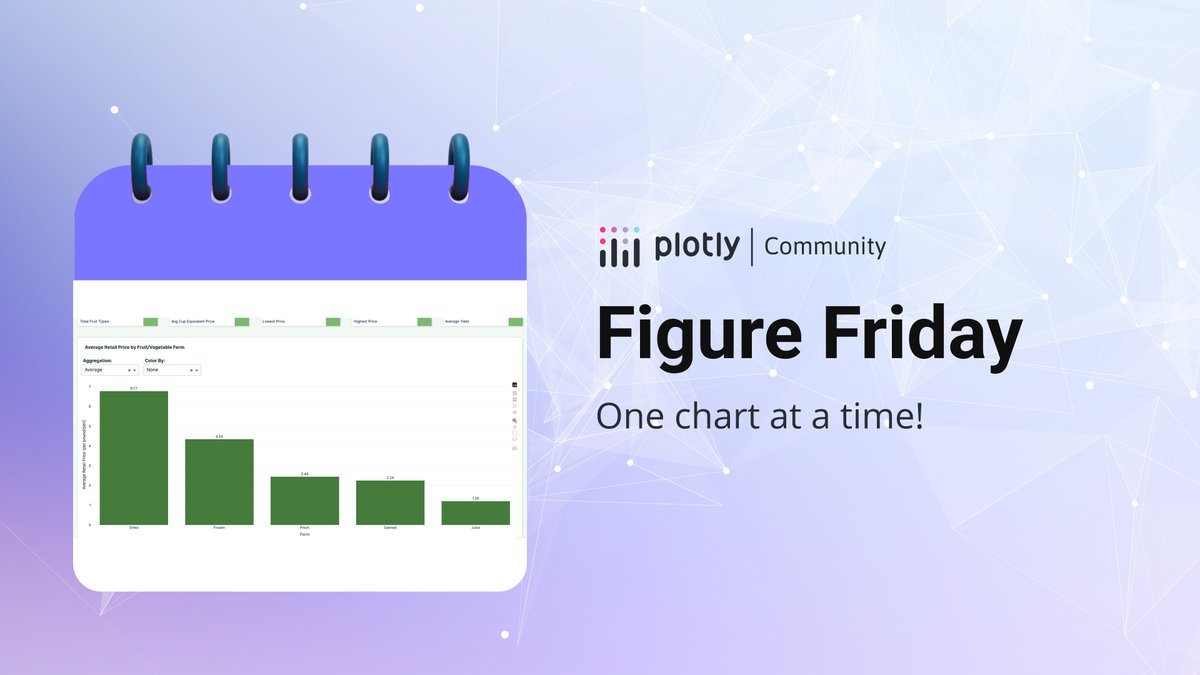
🍎🥦How much does it really cost U.S. households to eat enough fruits and vegetables? This week’s #FigureFriday dataset digs into retail prices across forms, varieties, and more — and we want to see what you can create with it in Plotly + Dash, and Plotly Studio. Join us in the…
You spend weeks building an interactive application that answers important questions. Then deployment becomes its own project. You're suddenly debugging infrastructure instead of refining your analysis. The AI that helped you write the Dash app can't help you figure out why your…

Our November Newsletter is here! 🍁 This month, we’re diving into AI-powered analytics, new Plotly Studio upgrades, product insights, community events, and more. ✨ Highlights include: • Upcoming webinar on what’s new in Plotly Studio • The State of Vibe Analytics report •…

🌌 Incredible work from all teams in the 13th Global Trajectory Optimisation Competition (GTOC), run by the NASA Jet Propulsion Laboratory (@NASAJPL)! A huge number of participants chose Plotly to chart their interplanetary trajectories — including the winning team. Here’s…

The latest Plotly Studio release introduces ✨ Explore mode ✨, a new feature that analyzes your dataset and automatically suggests high-value visualizations, comparisons, and even computational tools and custom calculators based on your data. All chart suggestions are tailored…
You asked, we delivered. Plotly Studio just shipped a wave of new upgrades — and we’re showing them off LIVE. 🙌 Join us Dec 16 at 11am ET for a demo-heavy, technical deep dive into the latest features powering the next generation of vibe analytics. What’s new: • Enterprise…

❄️ ‘Tis the season to build smarter data apps! Come join us in Dallas and Montreal for festive, hands-on workshops in AI-assisted data exploration with Plotly Studio. Dive into real city datasets, create dazzling interactive visualizations with the Plotly Graphing Library, and…
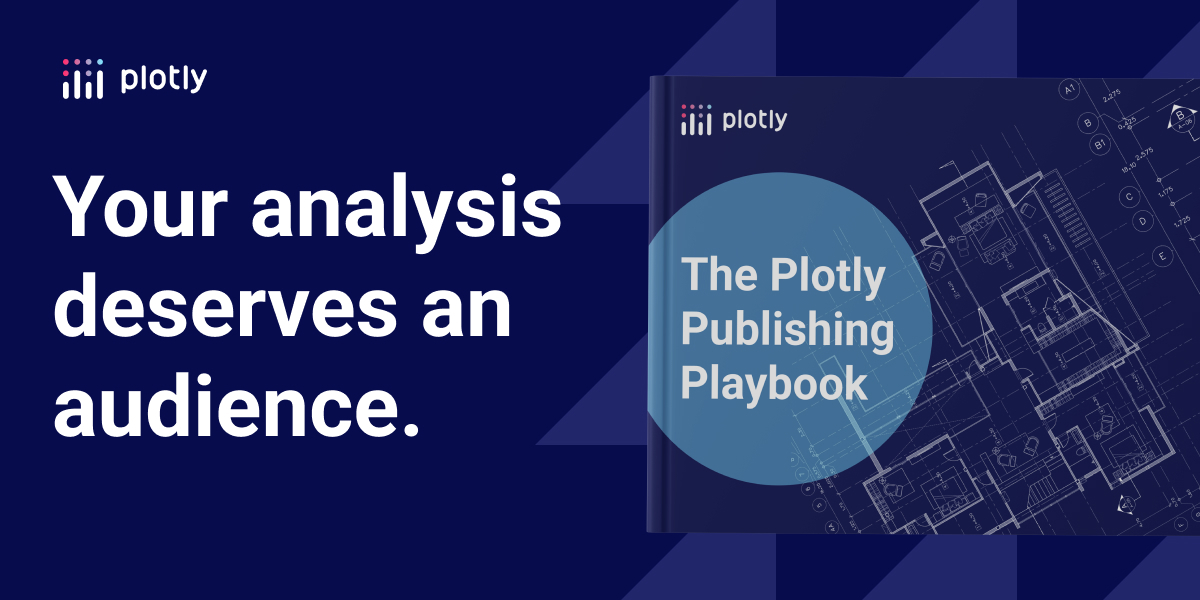
Your data analysis deserves an audience that can actually use it. Screenshots and PDF exports strip away what makes your work valuable. The Plotly Publishing Playbook shows how you can publish interactive data apps at any scale. Download: plotly.com/resources/publ…
💡 Missed our live webinar this week? We pulled together the key moments from our State of Vibe Analytics webinar with Plotly Head of Marketing John Allwright and MIT Research Fellow Michael Schrage, covering the rise of AI-assisted code generation and what it means for data…
💡 Data analytics is moving from being code-heavy to natural language and AI. This new mode brings insights to a far wider audience. Plotly CPO Chris Parmer discussed how Plotly Studio is leading this shift on the Policy Viz Podcast with Jon Schwabish (@jschwabish). Listen now:…

Join Plotly this December in Dallas and Montreal for hands-on sessions in AI-assisted data exploration using Plotly Studio, our AI-native platform for building production-ready data apps. Work with real city datasets, build interactive visualizations with the Plotly Graphing…

⏰ Tomorrow’s the day! Join us tomorrow at 11 AM EST for The State of Vibe Analytics. Hear insights from hundreds of developers, data scientists, and analysts on how AI is reshaping analytics workflows. Discover adoption trends, industry patterns, and how teams are using AI to…

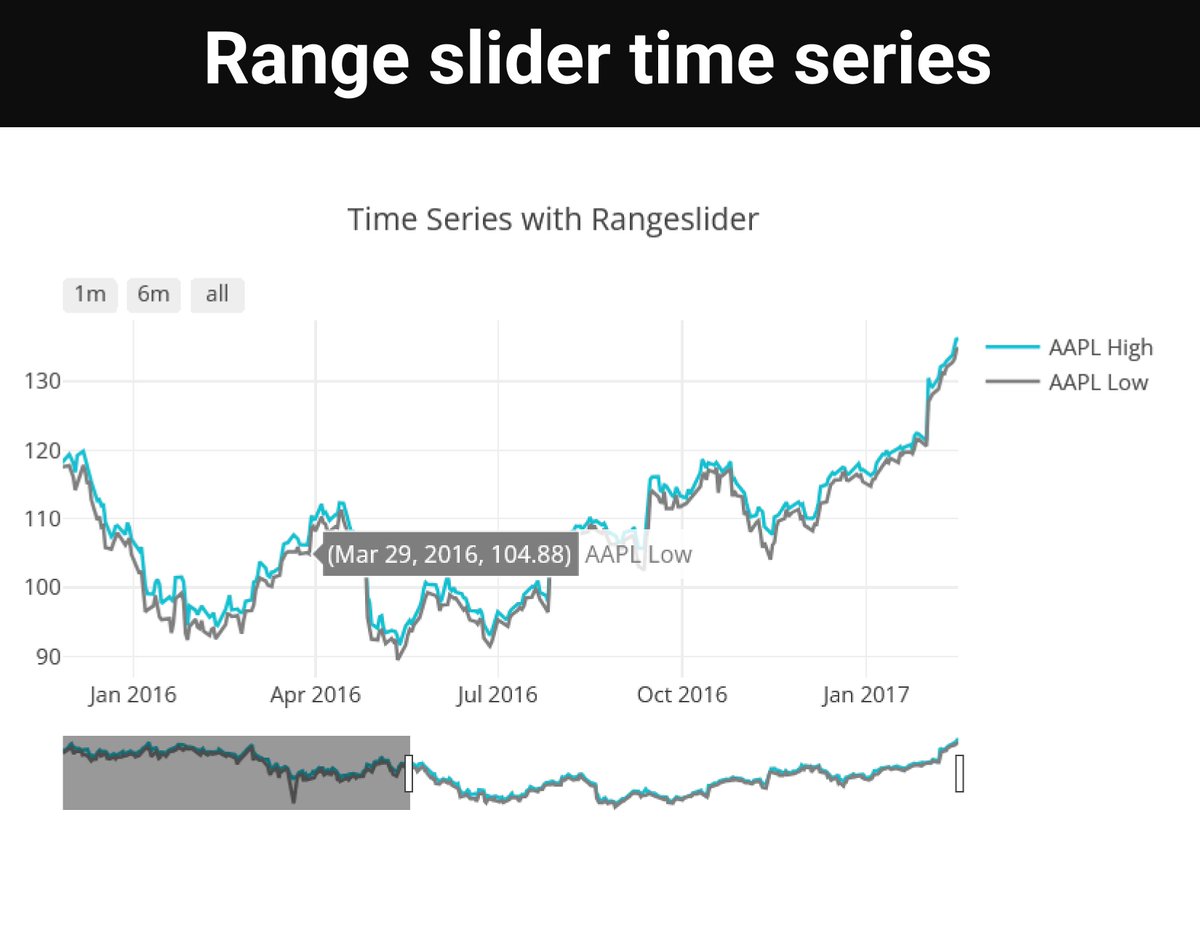
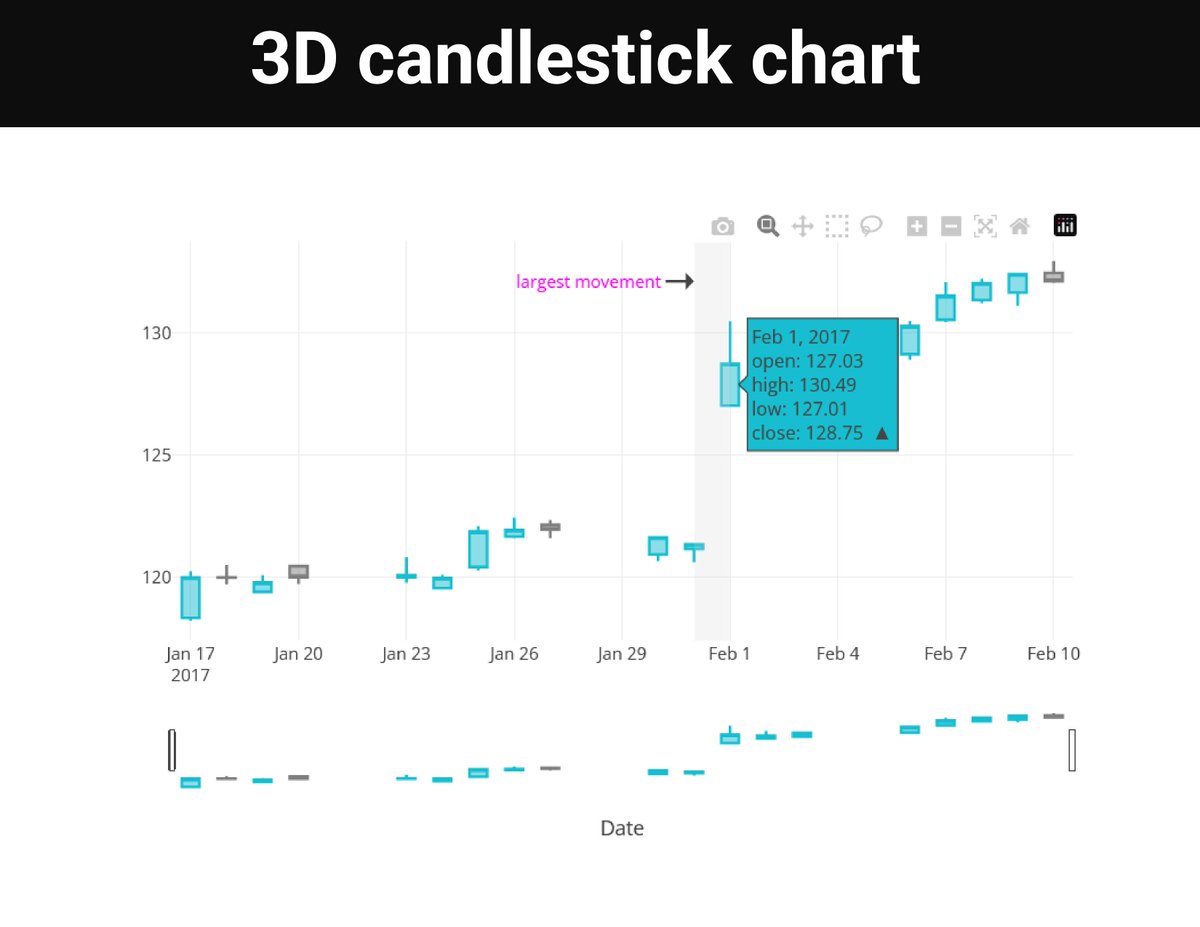
🎂 Happy 10th birthday, Plotly.js! Scroll to see 10 stunning charts that defined a decade of web data visualization. Plotly.js is the powerful, open-source charting library that drives high-performance, interactive visuals for Plotly Studio, and the whole Plotly Python/R…


United States 트렌드
- 1. The BONK 34.9K posts
- 2. FINALLY DID IT 261K posts
- 3. Jalen 73.6K posts
- 4. Eagles 116K posts
- 5. Chargers 84.8K posts
- 6. Herbert 33.3K posts
- 7. AJ Brown 10.2K posts
- 8. Piers 82.2K posts
- 9. #BoltUp 4,641 posts
- 10. #WWERaw 50.1K posts
- 11. Tony Jefferson 3,077 posts
- 12. Saquon 11.5K posts
- 13. LA Knight 10.7K posts
- 14. Patullo 6,995 posts
- 15. Cameron Dicker 1,918 posts
- 16. Sirianni 5,651 posts
- 17. #Dragula N/A
- 18. 4 INTs 3,510 posts
- 19. Tanner McKee 1,639 posts
- 20. Fuentes 116K posts


Something went wrong.
Something went wrong.