
Plotly
@plotlygraphs
Put data & AI into action by creating scalable, interactive data apps for your business with Dash.
Potrebbero piacerti


What’s the 𝘷𝘪𝘣𝘦 in analytics today? 👀✨ We asked hundreds of developers, data scientists, and analysts how they’re using AI for data visualization and analysis — and the results are fascinating. 💡 Join us Nov 18 @ 11AM EST to uncover: • How teams are integrating AI into…

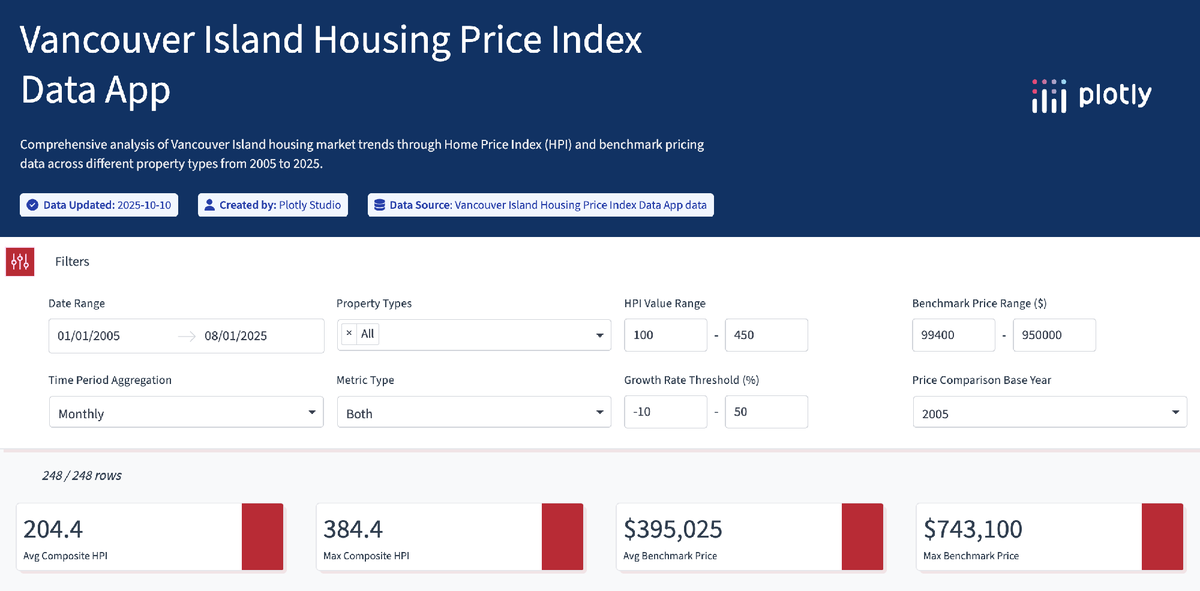
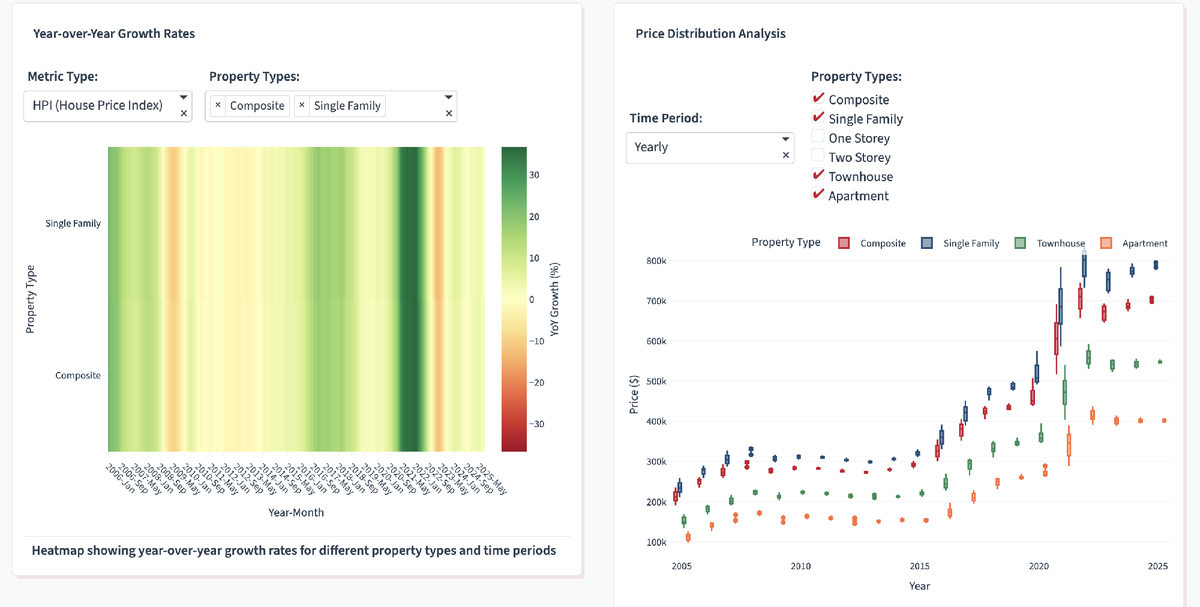
Vancouver Island’s real estate market, visualized. 🏠🇨🇦 Using Plotly Studio, Rob Calvin created an interactive app that analyzes the Home Price Index from 2005 to 2025, displaying the change in housing prices, year-over-year growth rates, and benchmark price evolution across…

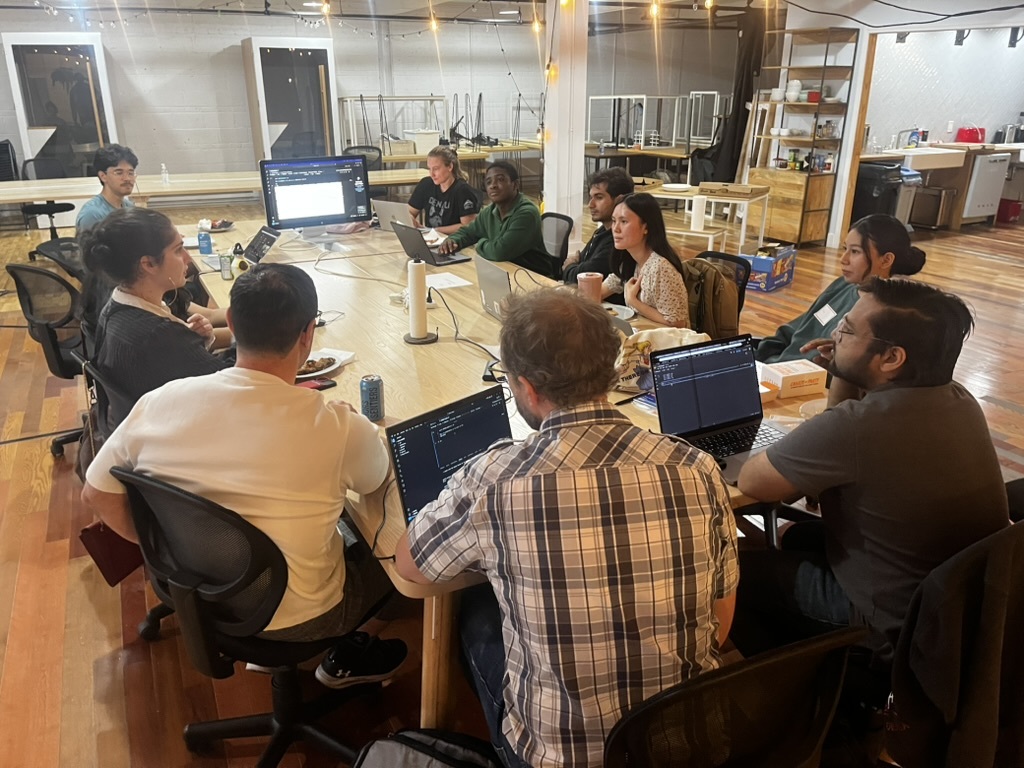
We just celebrated the Plotly Analytics Vibe-a-Thon winners and wow, the talent in this community is unreal. 😱 1,500+ participants from 35 countries submitted 200+ data apps built almost entirely with plain English prompts in Plotly Studio. No code. Just datasets, transformed…

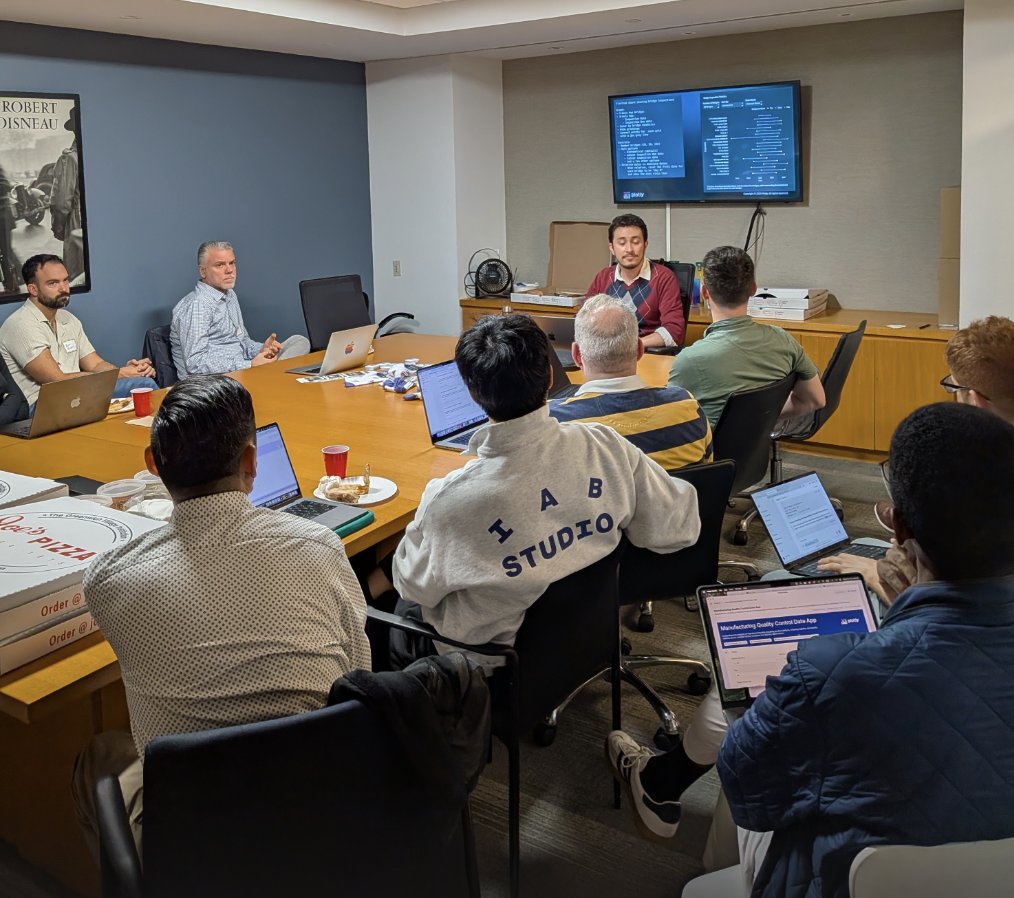
The best part of building with data? The people behind it. That’s why we’re bringing Plotly to cities around the world! 📊🌍✨ Upcoming stops, all happening at 6-8PM local time: 🇺🇸 Los Angeles — Today! luma.com/1i7o2cjx 🇨🇱 Santiago, Chile — Oct 29 luma.com/0dbja6oe…
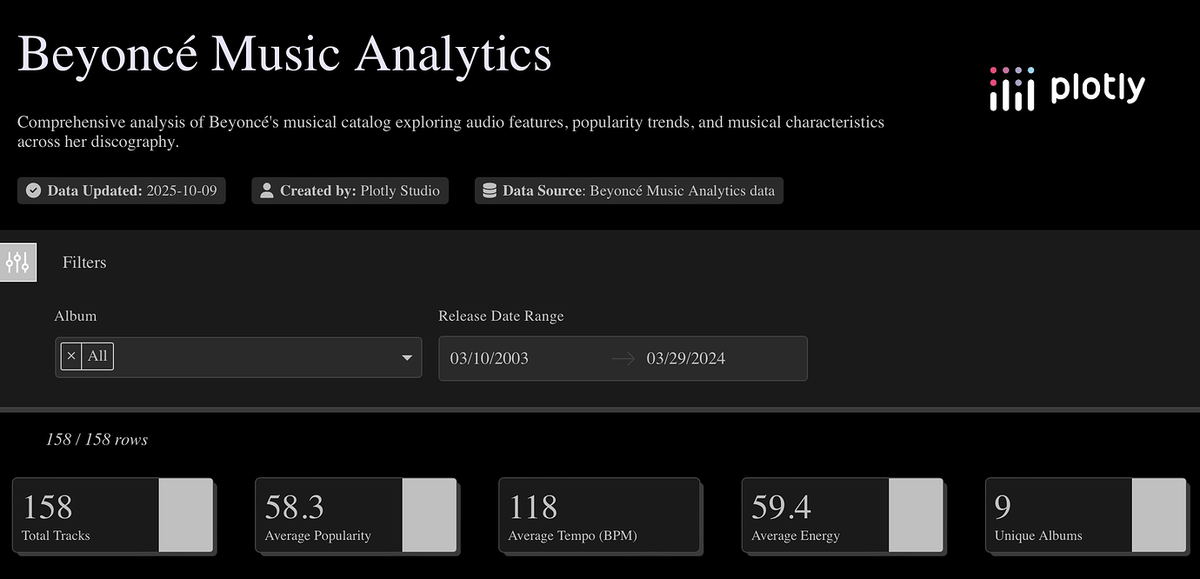
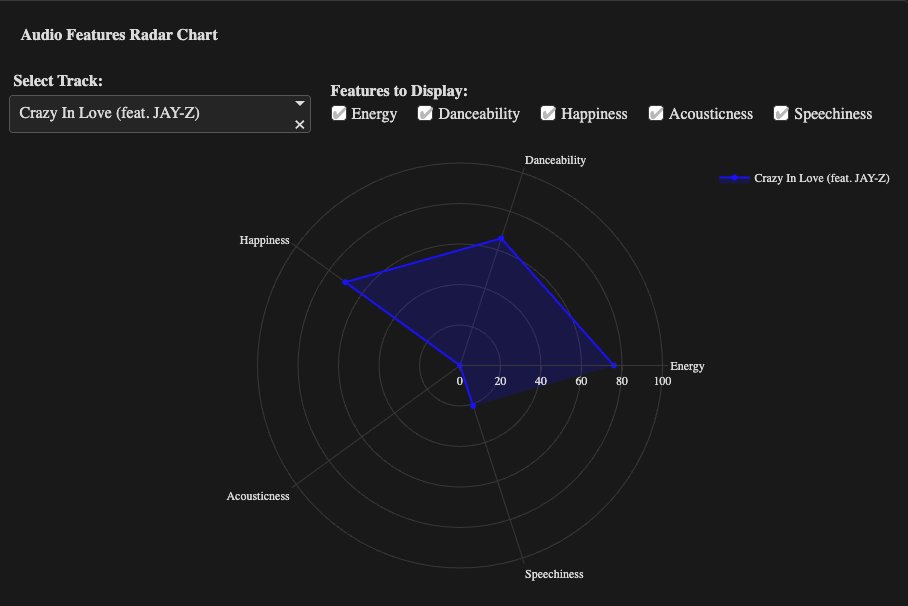
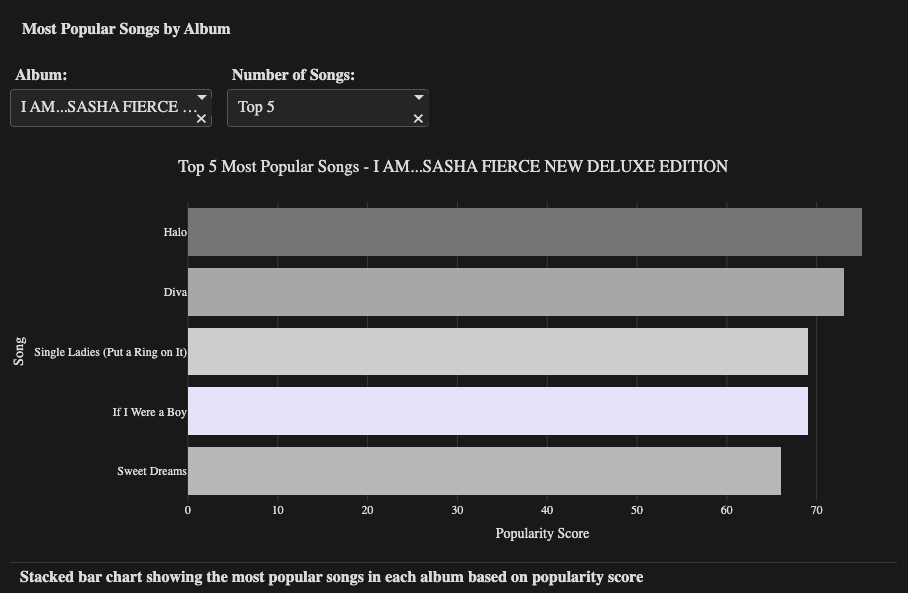
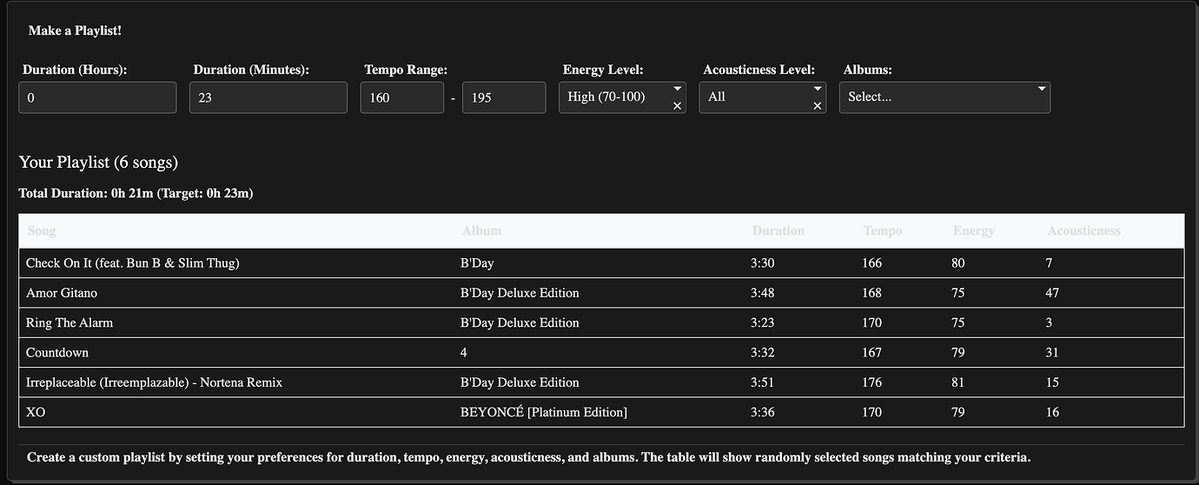
What runs the world? Data. 👑 Plotly’s Sam Tripp used Plotly Studio to analyze Beyoncé’s entire discography, tracking everything from tempo to “danceability” and energy levels across albums like RENAISSANCE and COWBOY CARTER. Check out how Sam created the ultimate Beyoncé…
We’re going live in a couple of hours! ⚡ Don’t miss 𝗔𝗻𝘆 𝗔𝗽𝗽, 𝗔𝗻𝘆 𝗦𝗰𝗮𝗹𝗲: 𝗧𝗵𝗲 𝗣𝗹𝗼𝘁𝗹𝘆 𝗣𝘂𝗯𝗹𝗶𝘀𝗵𝗶𝗻𝗴 𝗣𝗹𝗮𝘆𝗯𝗼𝗼𝗸, a live webinar on how to take data apps from localhost to production with the right publishing strategy. Hear directly from Erik,…

We’re excited to welcome Thomas Weber, Research Fellow at the European Molecular Biology Laboratory (EMBL), to our October Plotly Community Hangout! 🎙️ Thomas will showcase Depictio — a platform that turns complex bioinformatics outputs into interactive Dash apps, connecting…
What’s new in Plotly Studio? ✨ Since launching in September, we’ve shipped updates based on your feedback to make your data apps faster, more reliable, and fully under your control. Highlights include: • Export your code and take your app to any IDE or host • Faster, more…

⏰ The countdown is on! Tomorrow, we’ll share our strategic framework for getting data apps from prototype to production — faster, smarter, and at any scale. 💡 What you’ll learn: • When to choose SaaS vs. on-prem deployments • How to accelerate publishing workflows securely…

Plotly is proud to sponsor The AI Collective x McHacks: Back to School event at McGill University this week! 🎓🤖 Join us in Montréal on Wednesday, October 22 (6–8 PM EDT) for an evening of data, AI, and collaboration as we explore what’s next in artificial intelligence. 🎤…

It's not AI 𝘰𝘳 analytics. 𝗔𝗜 𝗲𝗻𝗮𝗯𝗹𝗲𝘀 𝗺𝗼𝗿𝗲 𝗮𝗻𝗱 𝗯𝗲𝘁𝘁𝗲𝗿 𝗮𝗻𝗮𝗹𝘆𝘁𝗶𝗰𝘀. On this Insight Jam episode, our expert panel — Chris Parmer (Plotly), Michael Fauscette (Arion Research), and Steve Croce (Anaconda) — all landed on the same conclusion: Stop…
The question isn't "AI or analytics" — it's how AI enables more analytics. 📊🚀 Here’s how Plotly’s Chris Parmer reframes it: Analytics is the end goal (decision-making, visualization, understanding). AI is the means to get more people there. The mindset shift: Don't think "AI…
We’re sharing the secret sauce to take your data apps from “it works on my laptop” to “live in production”. 👇 Join Erik, Nathan, and John as they break down 𝗧𝗵𝗲 𝗣𝗹𝗼𝘁𝗹𝘆 𝗣𝘂𝗯𝗹𝗶𝘀𝗵𝗶𝗻𝗴 𝗣𝗹𝗮𝘆𝗯𝗼𝗼𝗸, your guide to getting data apps from prototype to production…

The Plotly Roadshow is coming to Los Angeles! 🌴 Join us next week on Oct 23 in Santa Monica for an inside look at the latest in the Plotly ecosystem: ✨ The latest in the Plotly ecosystem (Dash, Dash Enterprise & more) 🤖 A sneak peek at our NEW Agentic-AI analytics app, Plotly…

AI on the input side? Powerful. AI interpreting outputs? Proceed with caution. ⚠️ Plotly’s Chris Parmer shares a key insight: While AI excels at helping you create analytics (describing what you want, generating code), using it to interpret results is where hallucination becomes…
A global Plotly takeover 🌎✨ From Toronto to London (just off-screen 😉), our community and Roadshow events are bringing data enthusiasts together around the world. Check out the full lineup and join us at an upcoming Plotly event! 🔗 luma.com/Plotly?k=c Sign up for our…

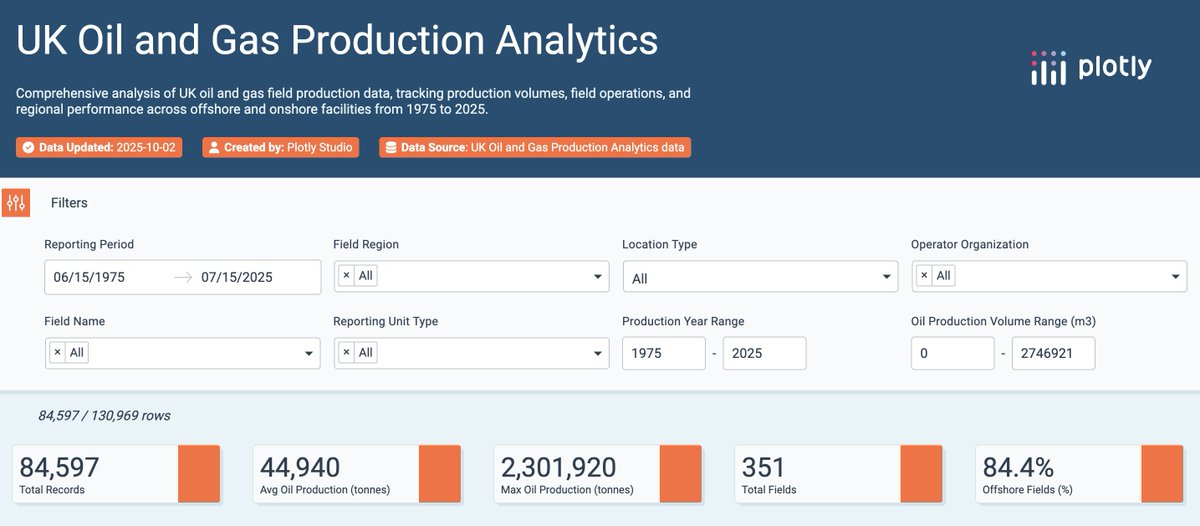
⛽ When a UK oil & gas production dataset was too large for standard web tools to handle, Plotly Studio processed it in seconds. Plotly’s Runqi Han uploaded 50 years of hydrocarbon field data (1975-2025) and used AI prompts to generate a comprehensive interactive dashboard, no…
AI isn't just being "bolted on" to existing platforms; it's changing how analytics tools get built. ⚒️ Plotly’s Chris Parmer explains the emerging shift: New platforms are being built AI-first, enabling "vibe analysis", work in natural language while AI generates code under the…


United States Tendenze
- 1. Halo 119K posts
- 2. PlayStation 55.5K posts
- 3. $BIEBER 1,294 posts
- 4. Xbox 69.2K posts
- 5. #WorldSeries 52.6K posts
- 6. #HitTheBuds 2,571 posts
- 7. Jasper Johnson N/A
- 8. #CashAppPools 1,667 posts
- 9. Purdue 3,517 posts
- 10. Cole Anthony N/A
- 11. Reagan 230K posts
- 12. Ashley 159K posts
- 13. Rajah N/A
- 14. Combat Evolved 5,033 posts
- 15. Megan 72.7K posts
- 16. Master Chief 7,124 posts
- 17. Kensington 6,742 posts
- 18. End of 1 13.5K posts
- 19. Layne Riggs N/A
- 20. Tish 19.4K posts
Potrebbero piacerti
-
 Streamlit
@streamlit -
 Kaggle
@kaggle -
 MmoGah.com
@MmoGah_com -
 PyData
@PyData -
 Yan Holtz
@R_Graph_Gallery -
 ali borman علي برمان
@aliborman -
 NumPy
NumPy
@numpy_team -
 Travis Oliphant
@teoliphant -
 Reignman_Xrp
@_REIGNMAN_ -
 IPPBX
IPPBX
@Ippbxusa -
 Anaconda
@anacondainc -
 FAUZIA A. A. ARSHI
@fauziaarshi -
 NumFOCUS
@NumFOCUS -
 A.I.D.A.
@aidassociazione -
 Matplotlib
@matplotlib
Something went wrong.
Something went wrong.