#chartinglibraries resultados da pesquisa

Ejlskov: Pioneering Sustainable Environmental Remediation with TeeChart Integration Blog post: steema.com/wp/blog/2025/1… #chartinglibraries #datavisualization #Environmentaldataanalysis #Groundwatermonitoring #soilcontamination #sustainableremediationtechnology

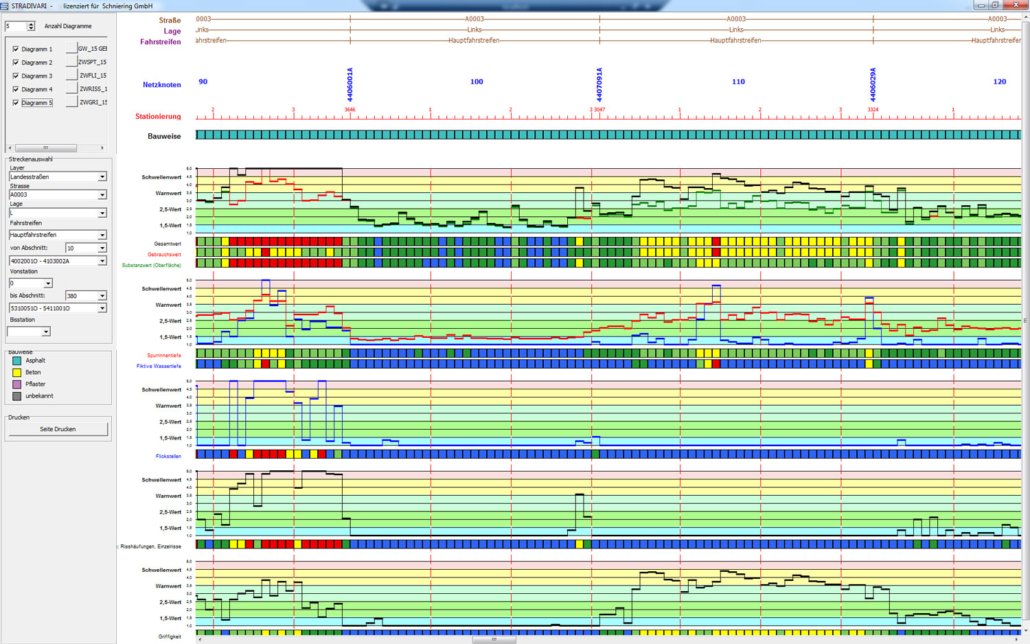
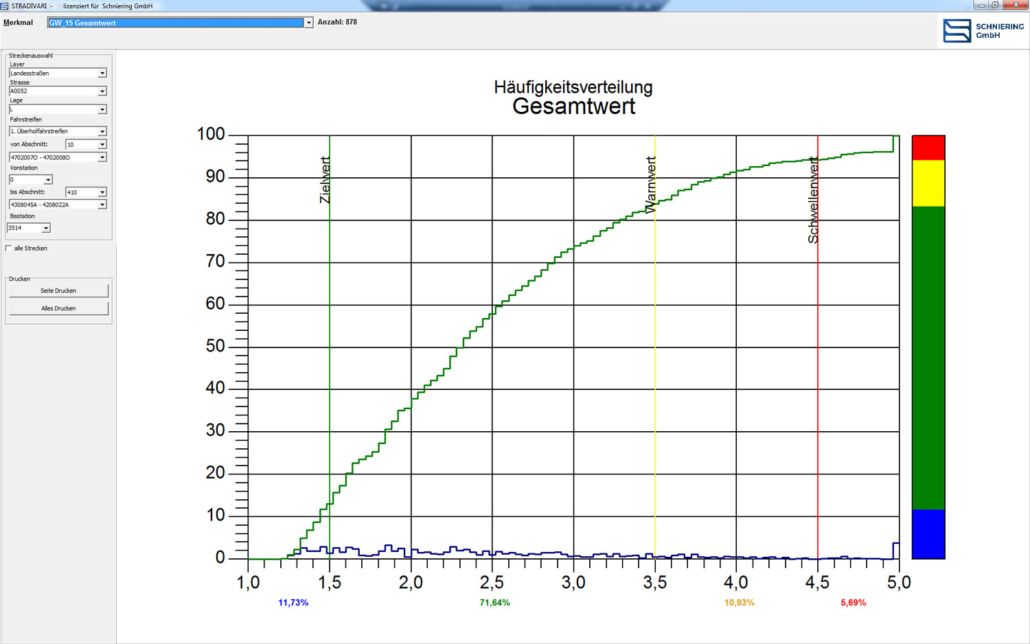
Schniering Uses TeeChart Pro to Power STRADIVARI® Road Analysis Software Blog post: steema.com/wp/blog/2025/1… #charting #chartinglibraries #charts #datavisualization #pavementanalysissoftware #roadconditionmonitoring #roadsurveyanalysis
How Kontron AIS & TeeChart for .NET Power Smart Industry Blog post: steema.com/wp/blog/2025/1… #chartinglibraries #datavisualization #industrialautomation #performancemonitoring #dotnet #dataanalytics #smartfactories

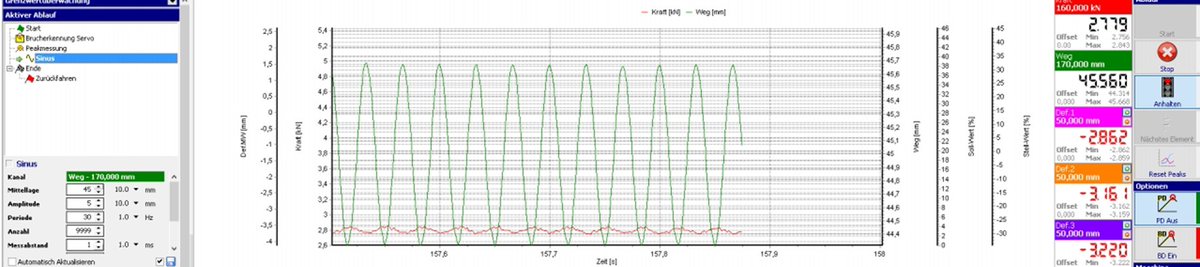
DOLI Elektronik: Visualizing Precision Testing with TeeChart Blog post: steema.com/wp/blog/2025/1… #chartinglibraries #datavisualization #engineeringsoftware #materialstesting #measurementcontrol #precisiontesting #realtimecharts #testautomation

How TeeChart for .NET Helps Walter + Bai Visualize the Strength of Materials Blog post: steema.com/wp/blog/2025/1… #charting #chartinglibraries #datavisualization #dataacquisition #dataanalysis #forcemeasurement #materialstesting #dotnet #datamonitoring #torsiontesting
TeeChart in GeoLogismiki’s Geotechnical Suite Blog post: steema.com/wp/blog/2025/1… #boreholelog #chartinglibraries #datavisualization #geotechnicalsoftware #stratigraphyvisualization #contourplots #time-seriesmonitoring


Schniering 使用 TeeChart Pro 為 STRADIVARI® 道路分析軟體提供動力 部落格文章:lnkd.in/djbjAEvH #charting #chartinglibraries #charts #datavisualization #pavementanalysissoftware #roadconditionmonitoring #roadsurveyanalysis linkedin.com/posts/steema-s…

ApexCharts.js charting library for interactive charts. #chartinglibraries #charts #datavisualization #frontend #interactiondesign #interactivediagrams #javascript #JavaScriptchartlibrary #JavaScriptcharts #js #JSframeworks #JSlibraries #UI #webdevelopment syndicode.com/2019/10/14/ape…

How VAL-CO Uses TeeChart to Visualize Smart Farming Blogpost: steema.com/wp/blog/2025/0… #chartinglibraries #farming #datavisualization #environmentalmonitoring #farmmanagement #agriculturalsustainability
TeeChart integrated in Bentley’s Systems’ Software. Blogpost: steema.com/wp/blog/2025/0… #charting #chartinglibraries #charts #datamonitoring #datavisualization #interactivecharts #realtimedata

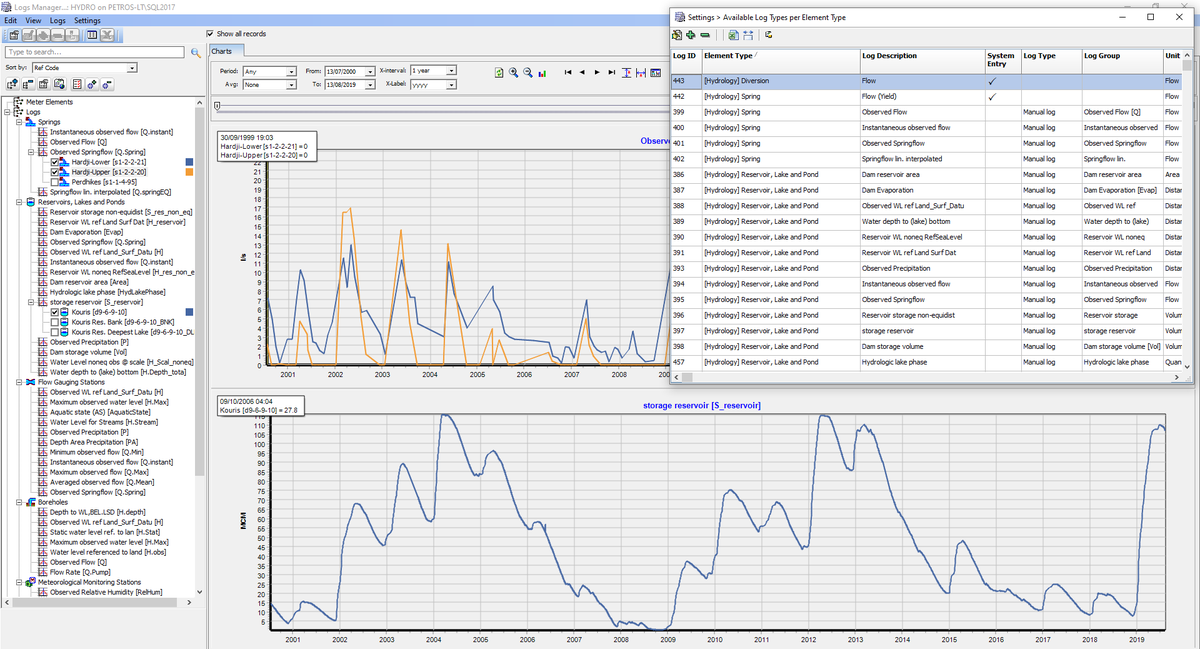
TeeChart Integration in Hydro-Comp’s EDAMS: A Data Visualization Solution for Utilities Blogpost: steema.com/wp/blog/2025/0… #chartinglibraries #datavisualization #utilitymanagement #realtimemonitoring #operationalefficiency
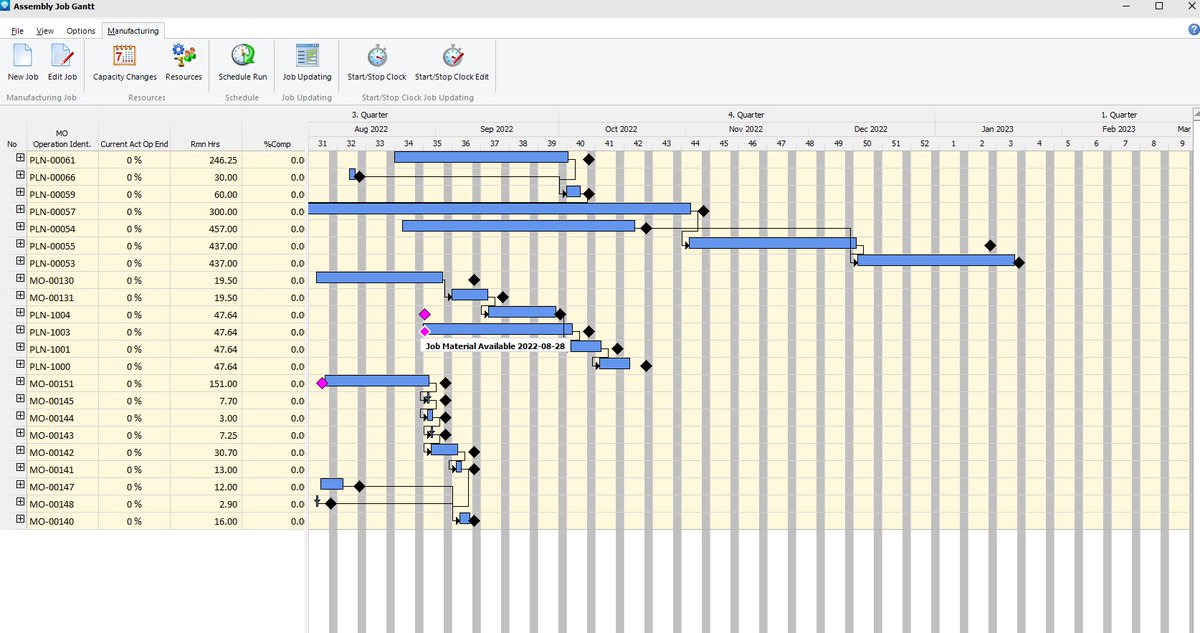
Powering Precision in Manufacturing Intelligence: Dynafact DMS with TeeChart BlogPost: steema.com/wp/blog/2025/0… #chartinglibraries #datavisualization #industrialanalyticssoftware #productiondashboards #interactivemanufacturingdashboards

Choosing the best charting 📊 library from numerous #JavaScript charting libraries available in the market can be confusing. Read on to compare JavaScript #chartinglibraries and choose the right one for you 👉👉 bit.ly/3CjNzJ3 #Javascriptcharts #JScharts #Java #Django

TeeChart for .NET at Diablo Analytical: Real-Time Charting for Mass Spectrometry & Gas Analysis Blogpost: steema.com/wp/blog/2025/0… #analyticalinstrumentation #chartinglibraries #dataanalytics #datavisualization #industrialanalytics #massspectrometry #dotnet


🤔 Do you want to grasp all the essential aspects one should consider while evaluating #chartinglibraries 📊? This white paper highlights the factors you should evaluate when choosing a charting component for your #software product 👉👉 bit.ly/3B4axTD #fusioncharts

📉Customize your charts with variable canvas heights in FusionTime! See how adjusting the canvas can improve data presentation. Check out the example:👉 bit.ly/3yN5UPE #DataVisualization #WebDevelopment #ChartingLibraries
📊 Explore the strengths of top charting libraries: FusionCharts, Highcharts, and amCharts. Find the one that elevates your app development. 👇👇 bit.ly/49kHYAk #FusionCharts #DataVisualization #ChartingLibraries #Highcharts #amCharts
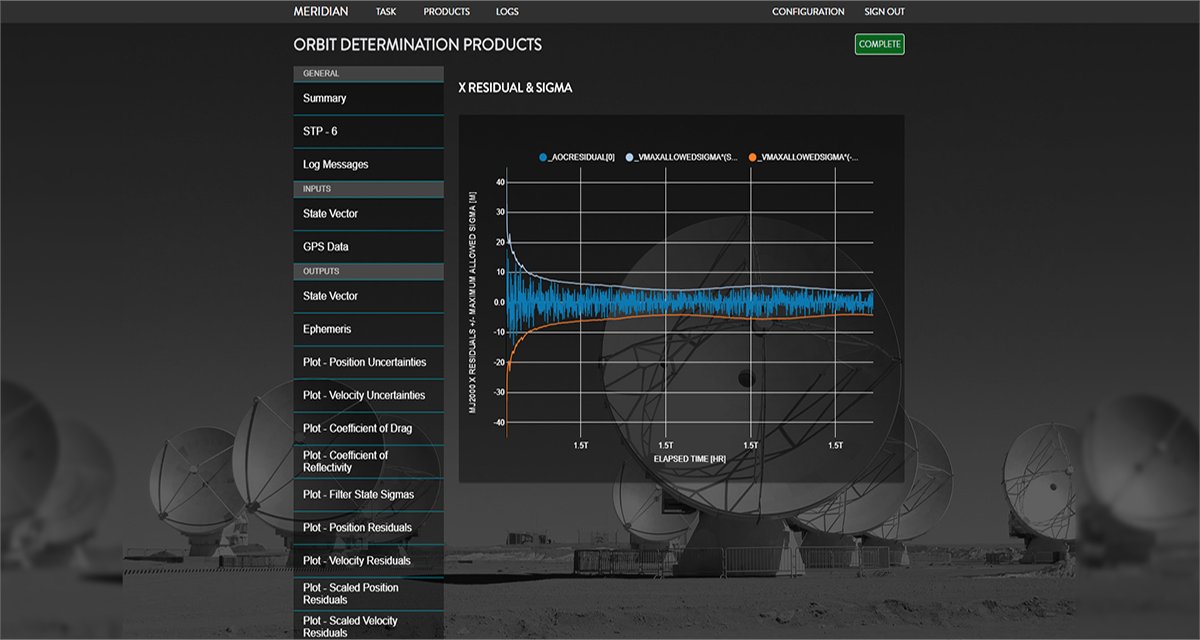
TeeChart’s Impact on a.i. solutions’ Space Software Blogpost: steema.com/wp/blog/2025/0… #chartinglibraries #datavisualization #charts #interactive #graphs #realtimedata #datamonitoring #spacesoftware #satellitetelemetry

Hey Pythonistas! Frustrated with slow #chartinglibraries? Meet #LightningChart Python – a game-changer in #datavisualization! Lightning-fast performance with GPU acceleration and WebGL rendering. Try our #free beta now! hubs.la/Q02nVGGW0

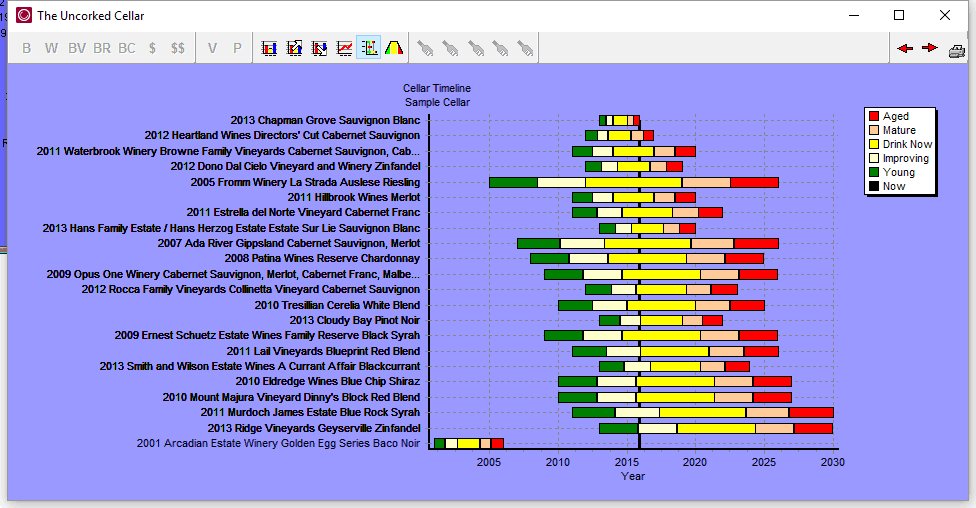
Visualizing the Vintage: How Uncork Uses TeeChart to Transform Wine Data Blogpost: steema.com/wp/blog/2025/0… #chartinglibraries #datavisualization #Vintagetrackingsoftware #Winecellaranalytics #wine #winecellarmanagement
DOLI Elektronik: Visualizing Precision Testing with TeeChart Blog post: steema.com/wp/blog/2025/1… #chartinglibraries #datavisualization #engineeringsoftware #materialstesting #measurementcontrol #precisiontesting #realtimecharts #testautomation

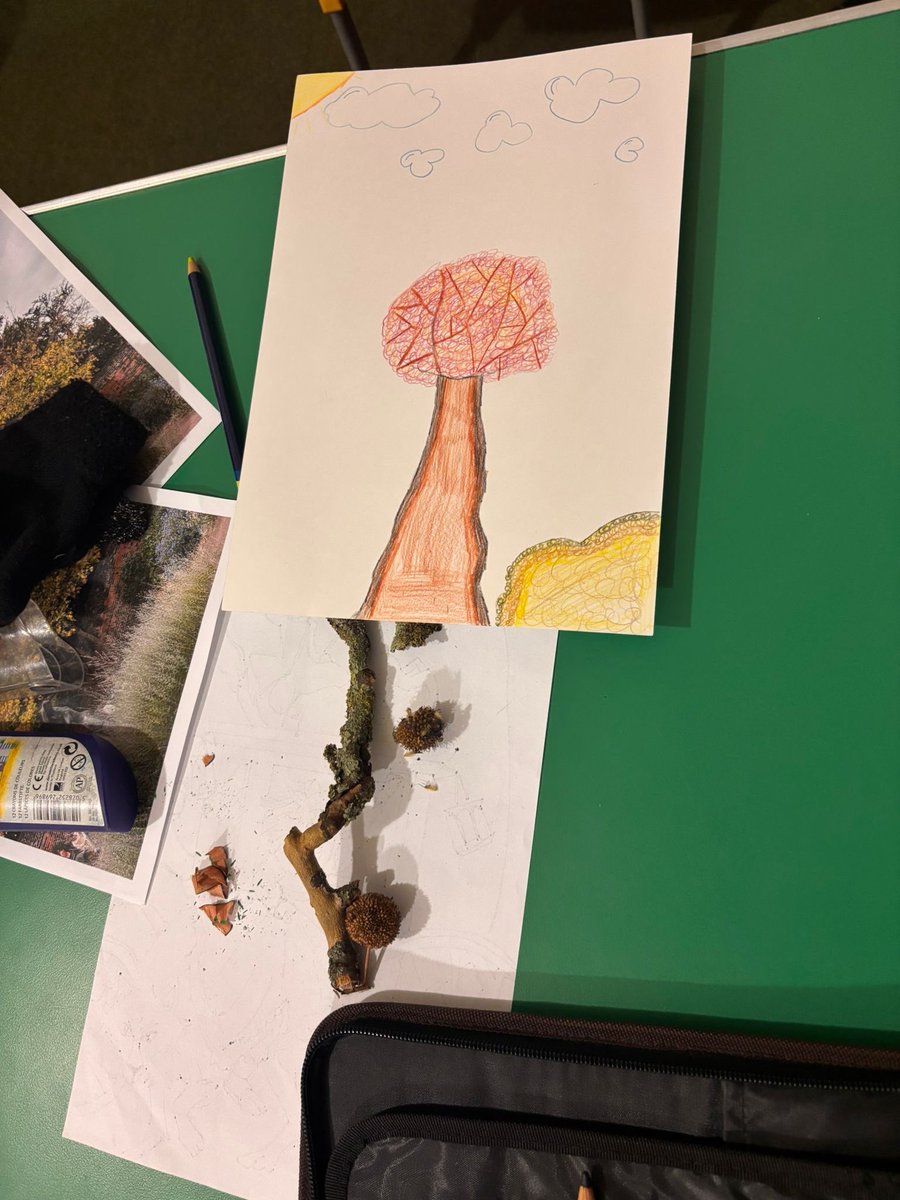
On Saturday we were inspired by the natural world at #CharltonLibrary! 🍁 Inspired by #NationalTreeWeek, library users took part in an all age drawing workshop, with all materials provided. Using shade, tone, colour and shape to create drawings all about trees! 🌳


Ejlskov: Pioneering Sustainable Environmental Remediation with TeeChart Integration Blog post: steema.com/wp/blog/2025/1… #chartinglibraries #datavisualization #Environmentaldataanalysis #Groundwatermonitoring #soilcontamination #sustainableremediationtechnology
TeeChart in GeoLogismiki’s Geotechnical Suite Blog post: steema.com/wp/blog/2025/1… #boreholelog #chartinglibraries #datavisualization #geotechnicalsoftware #stratigraphyvisualization #contourplots #time-seriesmonitoring
How TeeChart for .NET Helps Walter + Bai Visualize the Strength of Materials Blog post: steema.com/wp/blog/2025/1… #charting #chartinglibraries #datavisualization #dataacquisition #dataanalysis #forcemeasurement #materialstesting #dotnet #datamonitoring #torsiontesting
Schniering 使用 TeeChart Pro 為 STRADIVARI® 道路分析軟體提供動力 部落格文章:lnkd.in/djbjAEvH #charting #chartinglibraries #charts #datavisualization #pavementanalysissoftware #roadconditionmonitoring #roadsurveyanalysis linkedin.com/posts/steema-s…
Schniering Uses TeeChart Pro to Power STRADIVARI® Road Analysis Software Blog post: steema.com/wp/blog/2025/1… #charting #chartinglibraries #charts #datavisualization #pavementanalysissoftware #roadconditionmonitoring #roadsurveyanalysis
How Kontron AIS & TeeChart for .NET Power Smart Industry Blog post: steema.com/wp/blog/2025/1… #chartinglibraries #datavisualization #industrialautomation #performancemonitoring #dotnet #dataanalytics #smartfactories
TeeChart for .NET at Diablo Analytical: Real-Time Charting for Mass Spectrometry & Gas Analysis Blogpost: steema.com/wp/blog/2025/0… #analyticalinstrumentation #chartinglibraries #dataanalytics #datavisualization #industrialanalytics #massspectrometry #dotnet
Powering Precision in Manufacturing Intelligence: Dynafact DMS with TeeChart BlogPost: steema.com/wp/blog/2025/0… #chartinglibraries #datavisualization #industrialanalyticssoftware #productiondashboards #interactivemanufacturingdashboards
How VAL-CO Uses TeeChart to Visualize Smart Farming Blogpost: steema.com/wp/blog/2025/0… #chartinglibraries #farming #datavisualization #environmentalmonitoring #farmmanagement #agriculturalsustainability
Visualizing the Vintage: How Uncork Uses TeeChart to Transform Wine Data Blogpost: steema.com/wp/blog/2025/0… #chartinglibraries #datavisualization #Vintagetrackingsoftware #Winecellaranalytics #wine #winecellarmanagement
TeeChart’s Impact on a.i. solutions’ Space Software Blogpost: steema.com/wp/blog/2025/0… #chartinglibraries #datavisualization #charts #interactive #graphs #realtimedata #datamonitoring #spacesoftware #satellitetelemetry
TeeChart Integration in Hydro-Comp’s EDAMS: A Data Visualization Solution for Utilities Blogpost: steema.com/wp/blog/2025/0… #chartinglibraries #datavisualization #utilitymanagement #realtimemonitoring #operationalefficiency
.NET Devs, your charting just got smarter! #LightningChart .NET v12.2.1 brings: 👉.NET 8.0 compatibility 👉HERE map rendering upgrades 👉New trader tools & drawing capabilities 📊Release notes: hubs.la/Q03dQ6Qs0 🔧Free Trial: hubs.la/Q03dQ6hv0 #ChartingLibraries
lightningchart.com
LightningChart .NET 12.2.1 has been released!
LightningChart .NET 12.2.1 has been released with a .NET target framework 8.0, improved HERE maps, MeshModel performance, and more.
TeeChart integrated in Bentley’s Systems’ Software. Blogpost: steema.com/wp/blog/2025/0… #charting #chartinglibraries #charts #datamonitoring #datavisualization #interactivecharts #realtimedata

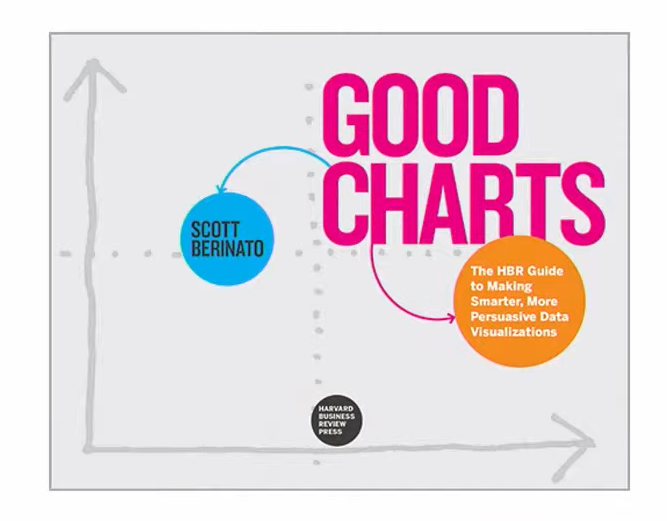
หนังสือที่คนทำ Presentation & Data Analytics มีไว้เพื่อออกแบบ Chart ให้เข้าใจง่าย สื่อสารได้ถูกจุด อันนี้ของ Harvard Business Review จริงๆมีอีกหลายเล่ม แต่เล่มนี้เขียนละเอียด
📉Customize your charts with variable canvas heights in FusionTime! See how adjusting the canvas can improve data presentation. Check out the example:👉 bit.ly/3yN5UPE #DataVisualization #WebDevelopment #ChartingLibraries
Hey Pythonistas! Frustrated with slow #chartinglibraries? Meet #LightningChart Python – a game-changer in #datavisualization! Lightning-fast performance with GPU acceleration and WebGL rendering. Try our #free beta now! hubs.la/Q02nVGGW0

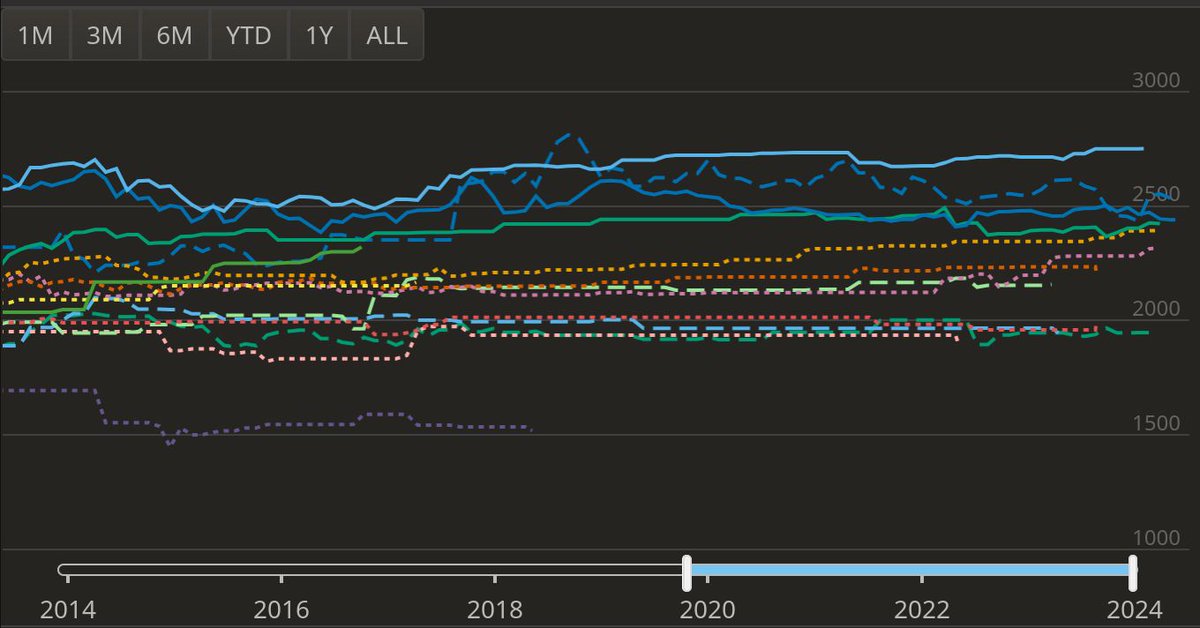
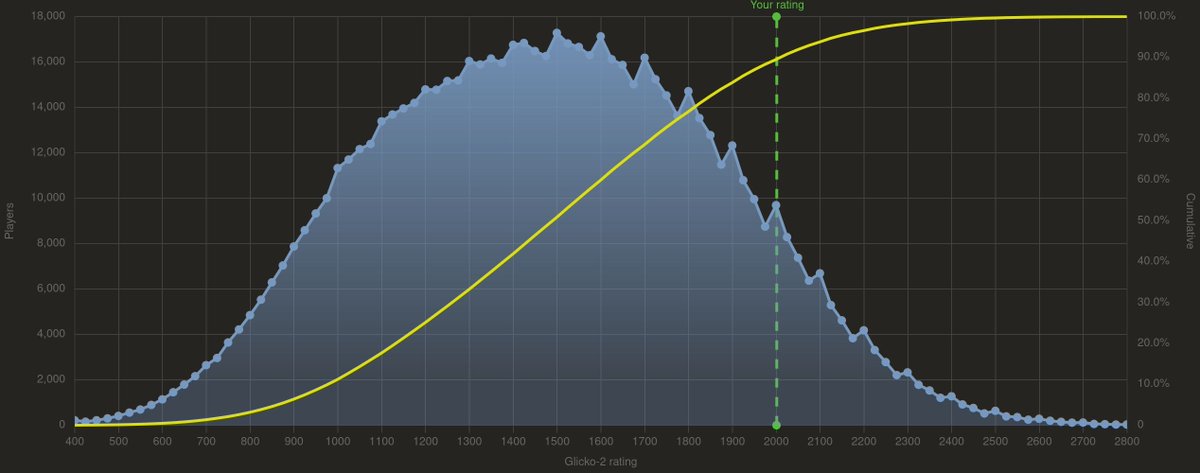
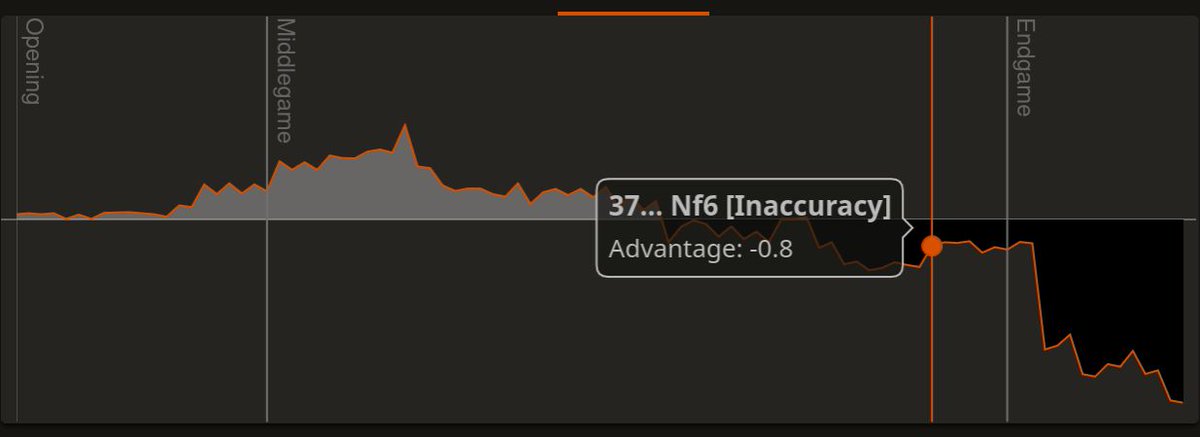
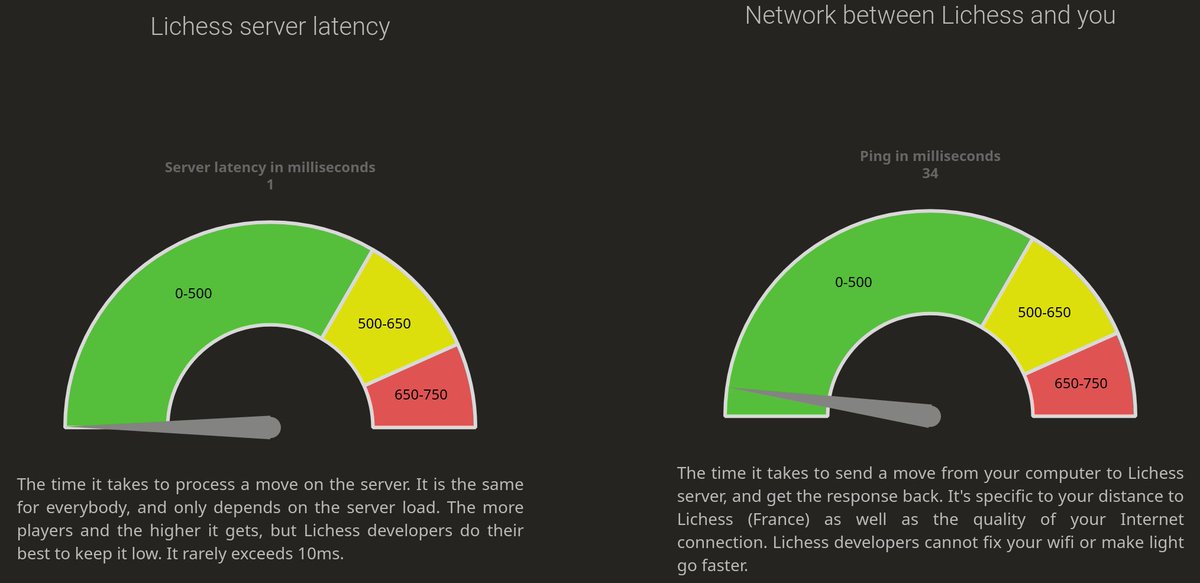
All our charts are now powered by @chartjs , a charting library that's open source (like Lichess). Previously, we were reluctantly using a closed source library. Many thanks to the Lichess user ItsGam3Tyme for this great contribution!
DOLI Elektronik: Visualizing Precision Testing with TeeChart Blog post: steema.com/wp/blog/2025/1… #chartinglibraries #datavisualization #engineeringsoftware #materialstesting #measurementcontrol #precisiontesting #realtimecharts #testautomation
Something went wrong.
Something went wrong.
United States Trends
- 1. rUSD N/A
- 2. #DMDCHARITY2025 815K posts
- 3. #TusksUp N/A
- 4. #AEWDynamite 21K posts
- 5. #TheChallenge41 2,230 posts
- 6. Diddy 76K posts
- 7. #Survivor49 2,923 posts
- 8. seokjin 158K posts
- 9. Earl Campbell 2,169 posts
- 10. Free Tina 13.9K posts
- 11. Yeremi N/A
- 12. Steve Cropper 6,679 posts
- 13. Jamal Murray 7,527 posts
- 14. Monkey Wards N/A
- 15. Milo 12.9K posts
- 16. Achilles 5,493 posts
- 17. Californians 6,644 posts
- 18. Ryan Nembhard 3,863 posts
- 19. fnaf 2 17K posts
- 20. Rizo N/A