#dataanalyticswithlabanoacademy 搜尋結果

Day 10/10 Final Dashboard👌. Wrapping up my exhilarating Excel boot camp at Labano Academy, my heart is brimming with joy! 🌟 The countless formulas, and pivot tables have transformed mere cells into powerful tools. #DataAnalyticsWithLabanoAcademy, #LabanoDataAnalysis, #Easy_p5


I promise, the journey would be worth the while #DataAnalyticsWithLabanoAcademy,#LabanoDataAnalysis, #Easy_p5 Labano Academy, Israel Afolabi


Data Analysis and Visualization Bootcamp with our Cohort 7 students begins today! #DataAnalyticsWithLabanoAcademy


Day 5: Creating Charts 10Days Microsoft Excel BootCamp Chart, "Product by Sales",relatnship btw prod. types to cumm.Sales Strength: Food&Beverages_Fund more,diversify Weakness: Health&Beauty_Advertise,human capital #DataAnalyticsWithLabanoAcademy, #LabanoDataAnalysis, Easy_p5


Day 8 of 10 of Data Analysis Excel Boot Camp #DataAnalyticsWithLabanoAcademy, #LabanoDataAnalysis, #Easy_p5 #DataAnalysis


This will be fun and educative, stay tuned #DataAnalyticsWithLabanoAcademy, #LabanoDataAnalysis, #Easy_p5,@richakin2000


Day 6 of Day 10 ✅created a Pivot Table! It's for organizing and analyzing data efficiently. ✅Below is the table #DataAnalyticsWithLabanoAcademy, #LabanoDataAnalysis, Easy_p5. Labano Academy, Israel Afolabi

Day 4 Used conditional formatting in Excel to highlight prices above 500 with a vibrant green #DataAnalyticsWithLabanoAcademy, #LabanoDataAnalysis, #Easy_p5


=INDEX() returns the value of a cell in a table based on the column and row number. The screenshot shows the formula and the result, Using COGS as subject. #DataAnalyticsWithLabanoAcademy, #LabanoDataAnalysis, #microsoftexcel #dataanalysisskills

Day 5 of 10days Bootcamp ✅I created a pivot table to get the accurate value ✅ I created a bar chat to show the relationships between total sales and product line #DataAnalyticsWithLabanoAcademy #LabanoDataAnalysis, Easy_p5 Labano Academy, Israel Afolabi Labano ACADEMYCOHORT7


Day 4 of 10 days Bootcamp ✅I calculated the mean, median and mode of Totalsales value ✅I to use the mode value $829 for conditional formatting the highlight in greencolor ✅Below is my screenshot data using #DataAnalyticsWithLabanoAcademy #LabanoDataAnalysis, Israel Afolabi


Day 10 of 10! YES!!! We did it!! Excited to share my latest visualization in Microsoft Excel. I've mastered the art of customized chart appearance, labels, and colors, taking my data visualizations to the next level. #DataAnalyticsWithLabanoAcademy, #LabanoDataAnalysis

Day 3 of the 10-Day Excel Bootcamp at Labano Academy 📊🚀 I calculated the total sales and found the AOV (average order value). #DataAnalyticsWithLabanoAcademy | #LabanoDataAnalysis| #Easy_p5

Day 7 I dove deep into a complex dataset using three powerful Excel functions: INDEX, MATCH and VLOOKUP to extract specific data from the dataset. #DataAnalyticsWithLabanoAcademy, #LabanoDataAnalysis, #Easy_p5


Day 9 Implemented data validation to ensure that only whole numbers can be entered for product quantities, preventing any invalid entries. #DataAnalyticsWithLabanoAcademy, #LabanoDataAnalysis, #Easy_p5

Day 2 #DataAnalyticsWithLabanoAcademy #LabanoDataAnalysis #Easy_p5 📊 Raw vs. Cleaned Data 📈 📥 Raw Dataset: Contains duplicates 🔄 Messy date and time formats ⏰ Blank cells 🚫 Missing values 🙇♂️ 🧹 Cleaned Dataset: ✅ Duplicates removed ✅ Date and time reformatted ✅ Blanks

Day 5 Created a bar chart to analyze product-wise sales distribution. The highest sales were found in F&B, which cost $56,144.84. On the other hand, the lowest sales were seen in H&B, generating $49,193.74. #DataAnalyticsWithLabanoAcademy, #LabanoDataAnalysis, #Easy_p5


Dear Data Analyst/Scientist. Read these books and you'll be miles ahead in your Data journey. To get it: 1. Follow me (so I can DM you) 2. Like and retweet 3. Reply with "Data"


Data Analytics from Zero to Expert Free Course 😲 A Udemy Complete Paid Course for Free. This Course covers; - Excel - SQL - Python - Tableau → Many more.. To get it simply Dm 24 hours 1. Follow (so that I can DM) 2. Like & Repost (Must) 3. Type "Learn" to get Link in DM 🧲


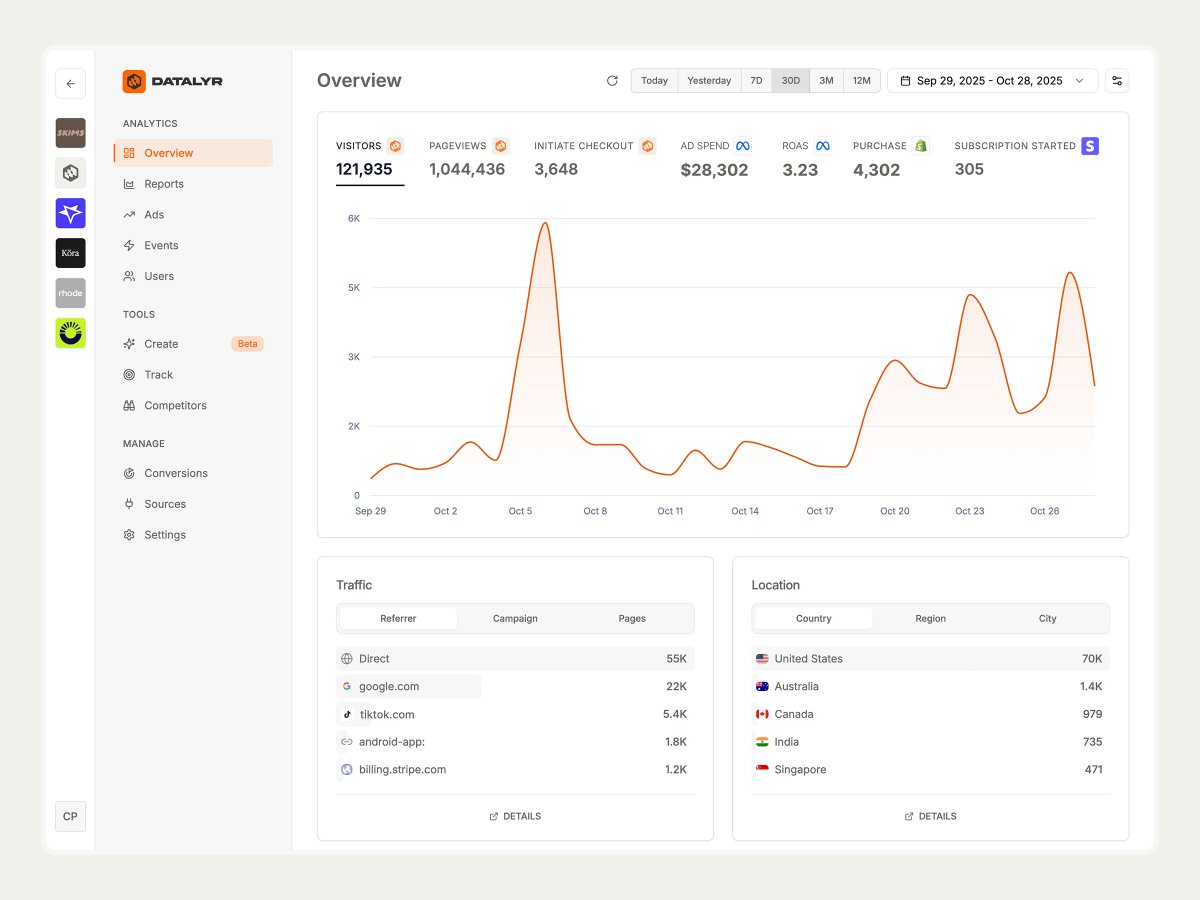
Hi👋 I’m Adeyemo, a Data & Business Analyst helping teams make faster, smarter decisions through clear dashboards. These visuals? They don’t just look good, they work. Because when data tells a clear story, leaders act with confidence. #DataAnalytics #BusinessIntelligence


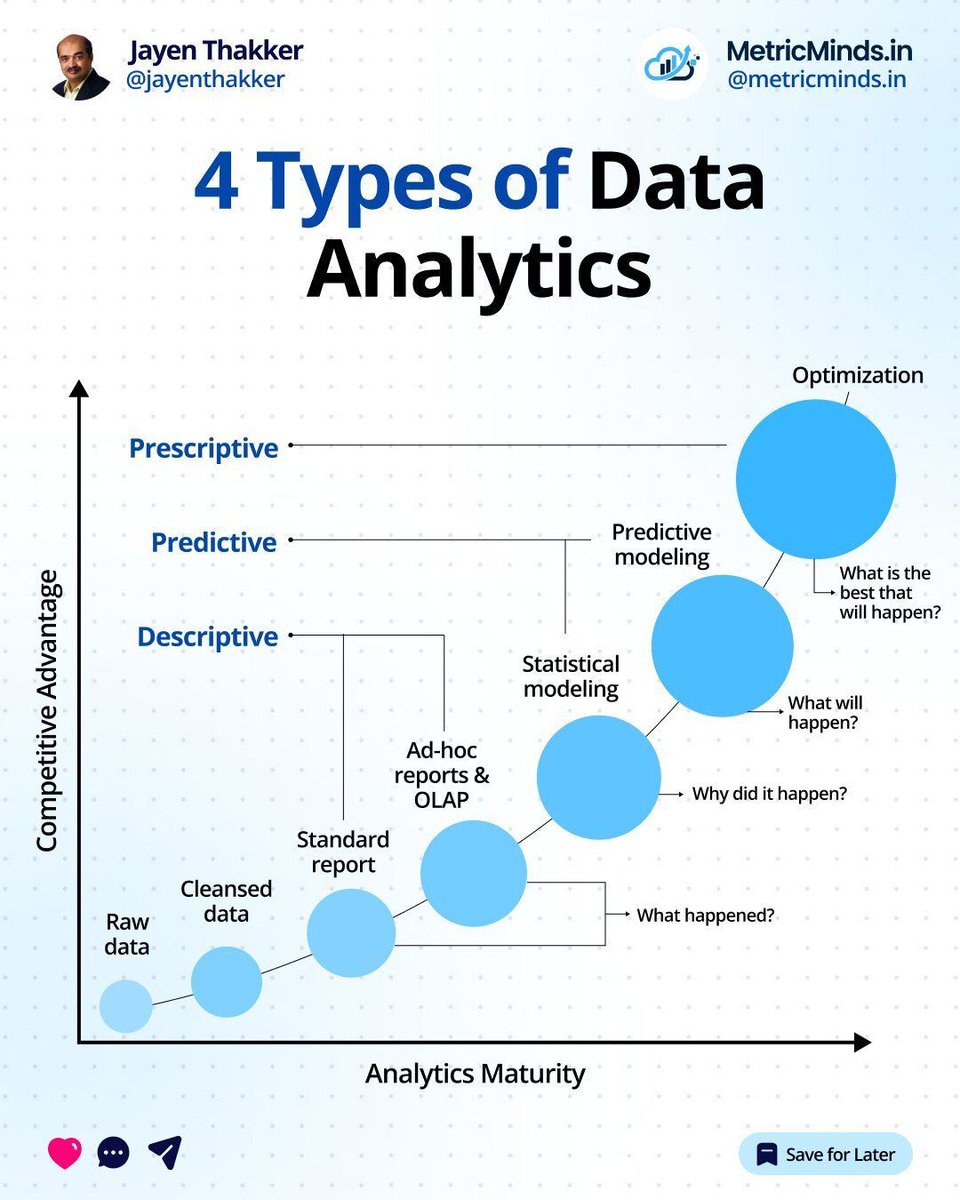
4 Types of #DataAnalytics by @JayenThakker #DataScience #BigData cc: @karpathy @terenceleungsf @kuriharan


🔍 Don’t drown in data. Let us give you clarity that drives action. 📈✨ #ClarityMatters #Level60Consulting #DataDriven #SmartDecisions #BusinessIntelligence


you guys all know how much i love this data, and i just realized that i have worked on this 4 time some with students.. which of them is you favorite, let me know in the comments #Datafam


Apple Releases Pico-Banana-400K Dataset Based on Google's "Nano Banana" AI Image Model #AI #Apple #Google #MachineLearning #GenerativeAI #AIDevelopment #AIImages #AIImageEditing #DeepLearning #AIResearch #OpenSource #AIDatasets #PicoBanana winbuzzer.com/2025/11/03/app…


This chart simply signals GROWTH 💹📈 Study @trylimitless $LMTS Study prediction markets. Study first movers advantage 😁


Day 1 of not being constant in my #DataAnalyst journey: Mastering clean data! 📊 Key lessons from today's slide: ✅ EDA first ✅ Document EVERY step ✅ Impute wisely ✅ Don’t over-clean ✅ Build reusable pipelines Clean data = trusted insights. #DataCleaning #AnalyticsJourney

I will be documenting my data analysis journey publicly here. I might not be consistent on a day-to-day basis but I will document each learning process here as much as I can.

Free Datasets to practice data analytics projects 1. Enron Email Dataset Data Link: cs.cmu.edu/~enron/ 2. Chatbot Intents Dataset Data Link: github.com/katanaml/katan… 3. Flickr 30k Dataset Data Link: kaggle.com/hsankesara/fli… 4. Parkinson Dataset Data Link:…

It connects scattered data streams, cleanses information, and transforms them into living insights your teams can act on. Say goodbye to disconnected reports. And hello to clarity that drives confident decisions. With #BIAgent, every chart tells a story — one of agility,…


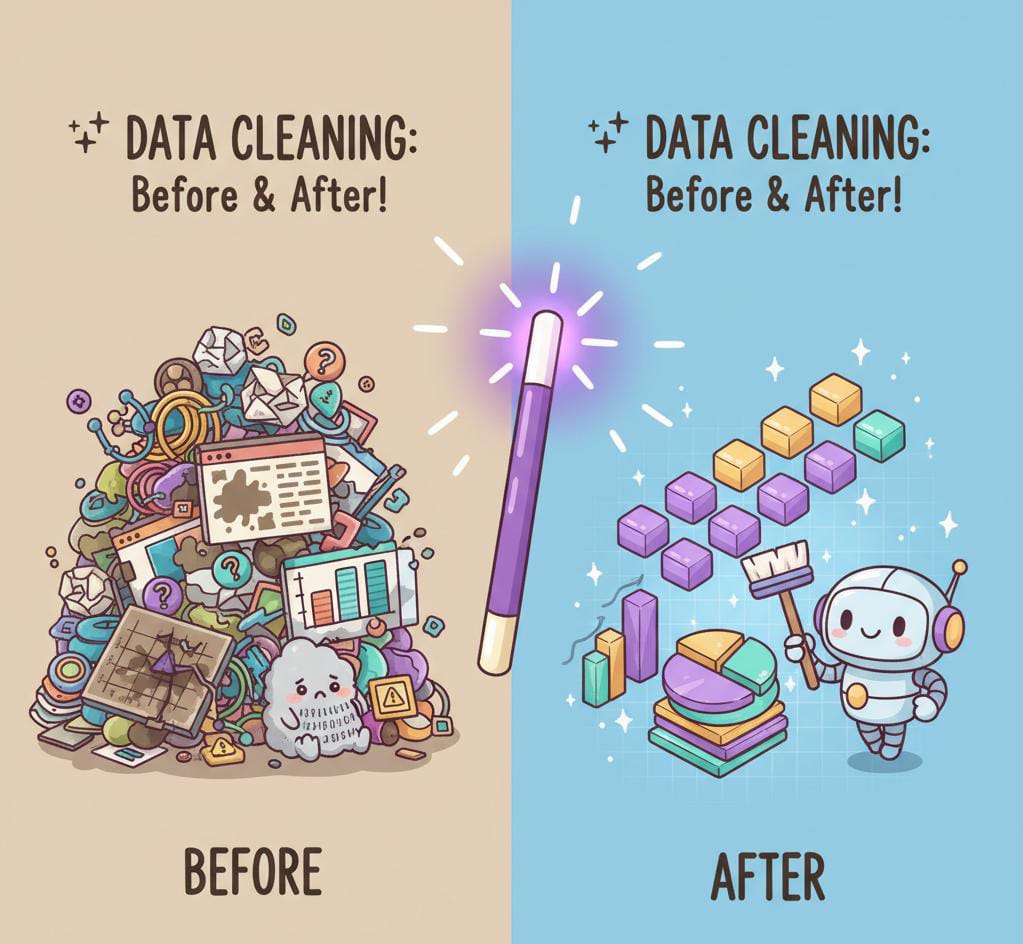
From Chaos to Clarity 🔍✨ Every powerful data story starts before the dashboards and visuals , it starts with data cleaning💜✊🏽. #DataAnalytics #RaflinkInsight
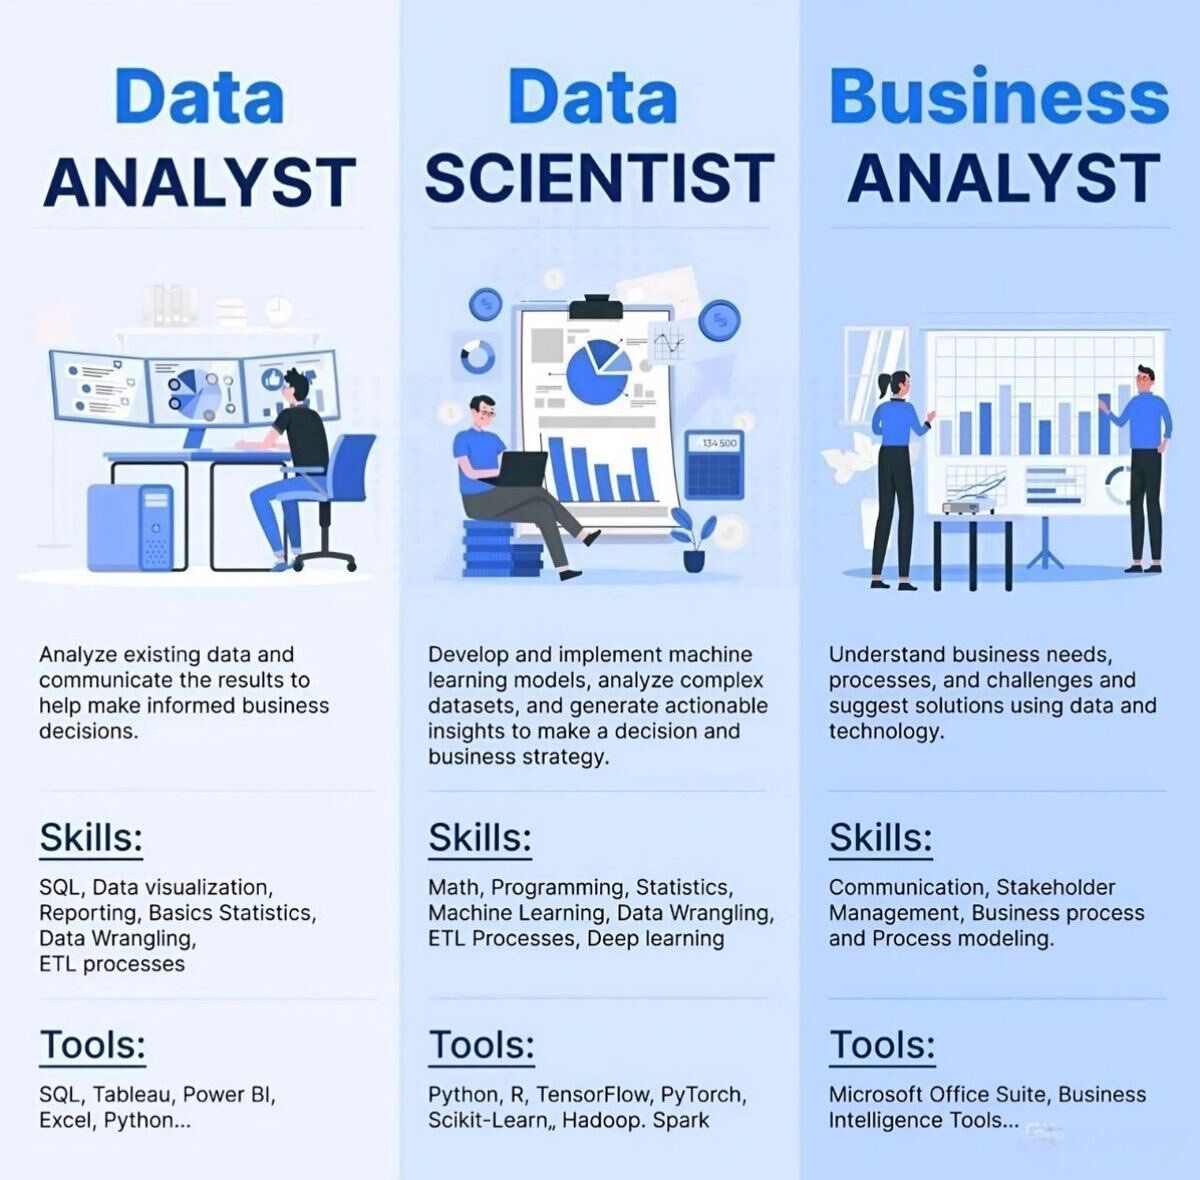
#DataAnalyst Vs #DataScientist Vs Business Analyst by @Mbadiwejesse #DataScience #BigData cc: @karpathy @terenceleungsf @kuriharan

Empower your business with intelligent data visualization that enhances reporting accuracy and clarity. ✅ Real-time analytics ✅ Clear, visual insights ✅ Smarter business outcomes #DataVisualization #PowerBI #BusinessIntelligence #AI #Automation #TechSolutions #Digiprima


🖼️ Transform images into accurate, actionable data! Data Entry India BPO delivers precise image data entry services you can trust. #ImageDataEntry #DataProcessing #allianze


Crazy how learning data analysis changes the way you think. At first it’s all about the tools: Excel, SQL, Power BI. Then one day you realize it’s actually about mindset. You start seeing patterns everywhere, even in yourself. #DataAnalysis #DataJourney #LearningInPublic

Something went wrong.
Something went wrong.
United States Trends
- 1. #IDontWantToOverreactBUT N/A
- 2. #MondayMotivation 36.5K posts
- 3. Howie 8,082 posts
- 4. Hobi 55.2K posts
- 5. Phillips 495K posts
- 6. Victory Monday 3,234 posts
- 7. winthrop 1,634 posts
- 8. #maddiekowalski N/A
- 9. Good Monday 52.3K posts
- 10. 60 Minutes 123K posts
- 11. #MondayVibes 3,289 posts
- 12. $IREN 16.7K posts
- 13. Bradley 7,143 posts
- 14. Tomorrow is Election Day 1,301 posts
- 15. Happy Birthday Kim 1,082 posts
- 16. $QURE 2,232 posts
- 17. #BuschPlayoffPush N/A
- 18. Kimberly-Clark 1,997 posts
- 19. OpenAI 38K posts
- 20. Rybakina 2,659 posts