#datavisualzation 搜尋結果

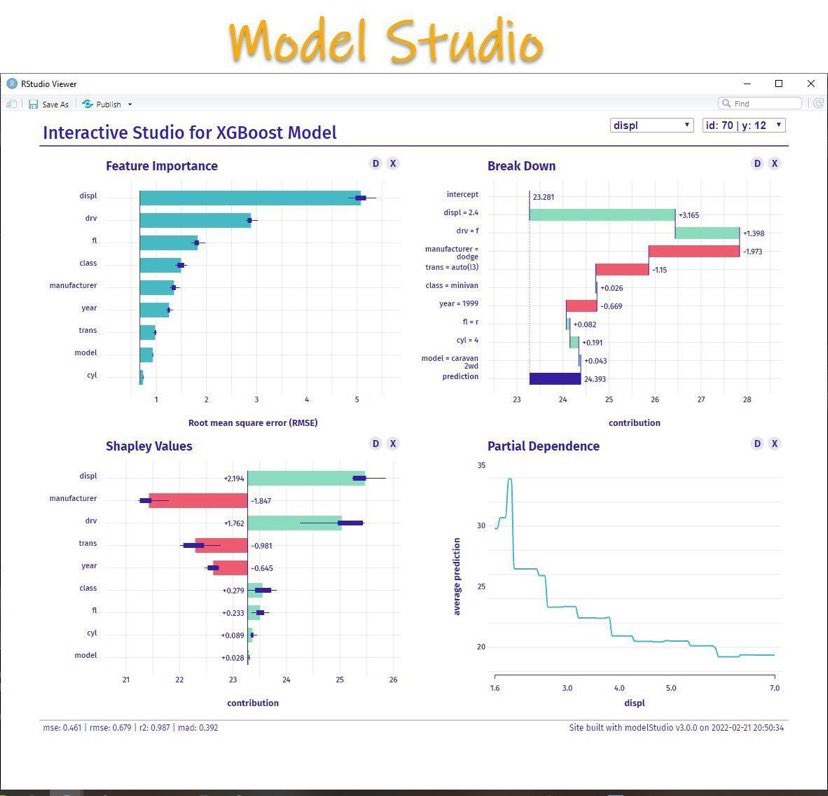
Machine learning is great, until you have to explain it. Don't worry. This R package will save you. buff.ly/37MyMtS #rstats #datavisualzation #MachineLearning #AI #DataScience #DataAnalytics

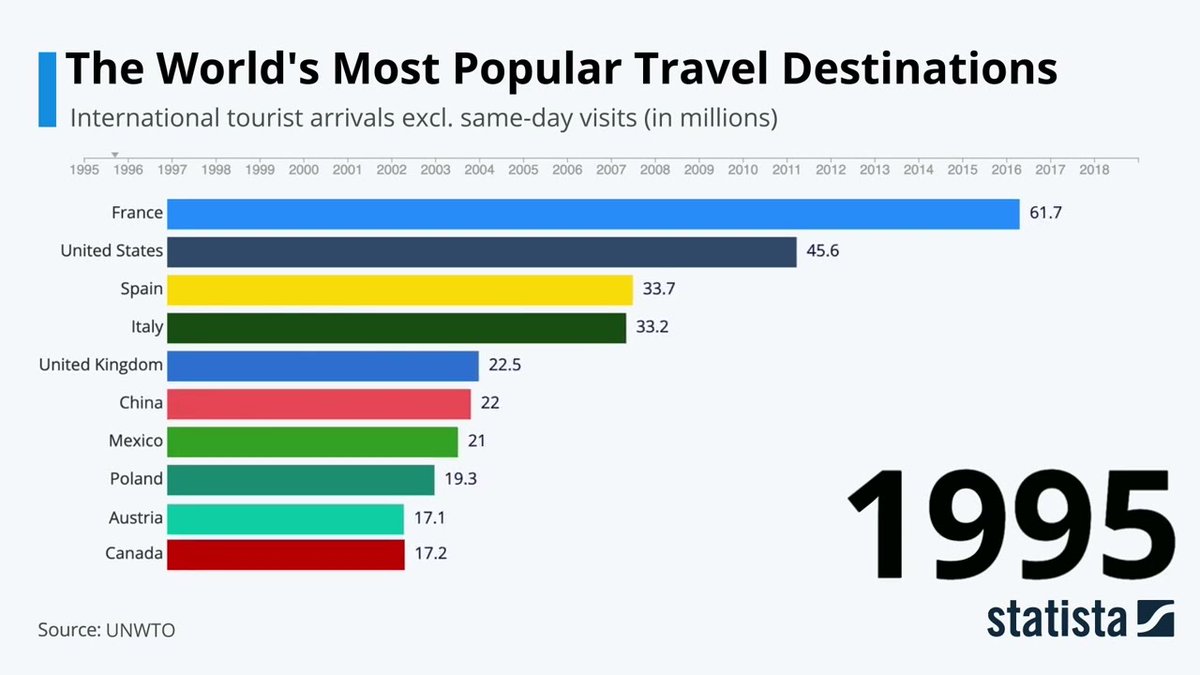
Statista Racing Bars: World's ... alojapan.com/549355/statist… #datavisualzation #Covid19 #France #Infographic #JapanDestinations


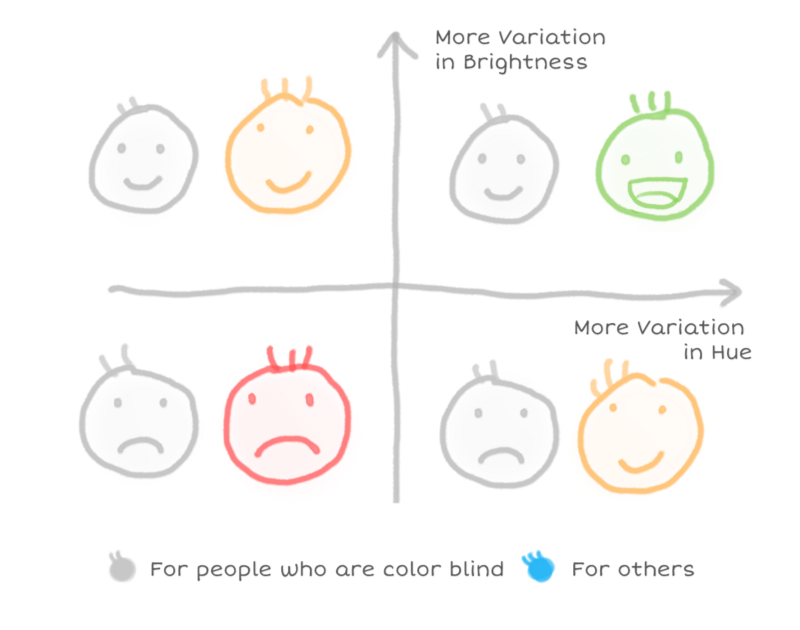
Creating a color palette for a #DataVisualzation? Read this first: bit.ly/1Tj9zai @moyicat #ux #design
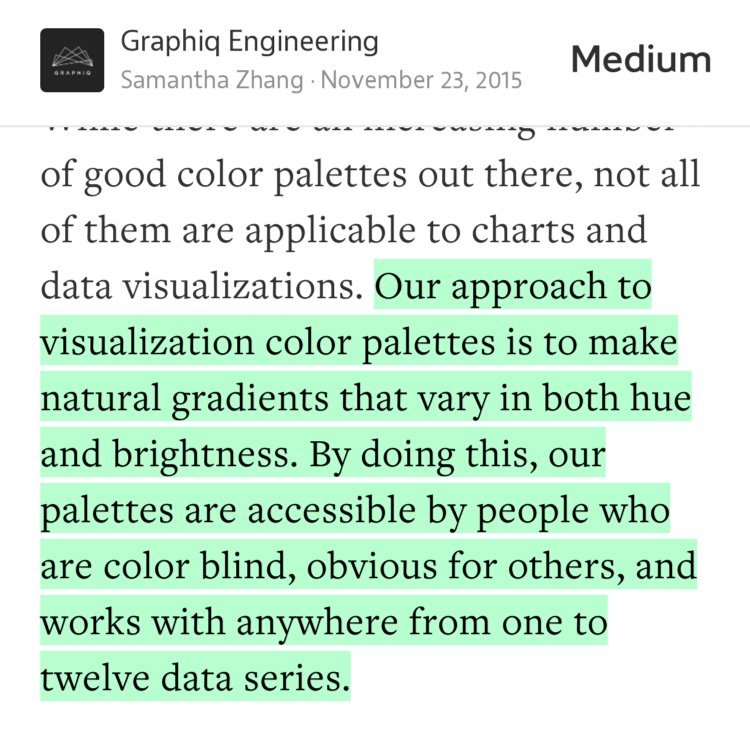

Choosing a color palette for data visualization is not easy @InVisionApp #datavisualzation bit.ly/1NHh2P3

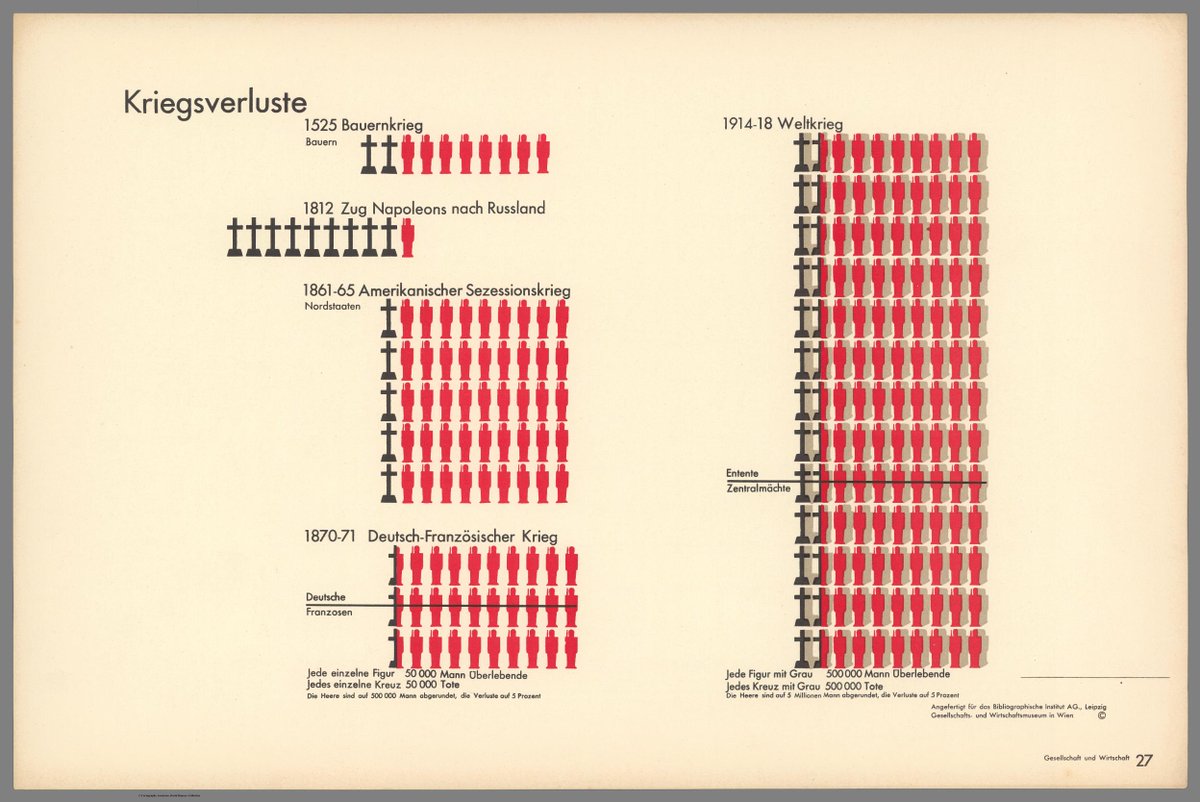
Otto Neurath's infograph of 1930, meant to show how deadly WWI was, also reveals the human catastrophe of Napoleon's Russian campaign of 1812. #twitterstorians #datavisualzation #Germany #Napoleon #RussianHistory #History #geschiedenis IN:storymaps.arcgis.com/stories/327491…


RIP Swivel.com. http://eagereyes.org/criticism/the-rise-and-fall-of-swivel #datavisualzation

Short and precise overview on visualization of data depending on questions to be answered. #datavisualzation datasciencecentral.com/profiles/blogs…


4/ virtual worlds can completely redefine the dynamics of how users interact with business data #datavisualzation #virtualreality

YES>> Today's computing power + #bigdata + #PredictiveAnalytics + #DataVisualzation = a new era of business insights. #ArgyleCFO

How GM Is Saving Cash Using Legos As A Data Viz Tool fastcodesign.com/node/1669468 via @FastCoDesign #design #datavisualzation

SF Beijing Have Highest Concentration of Billion-Dollar Startups klou.tt/g4vsowvdebte #DataVisualzation #Startups

RT @jwalphenaar: interesse in data visualisatie..? Kijk hier eens rond: ow.ly/hxsfU #datavisualzation #nerdy


Molto interessante #DataVisualzation:The Art of Data Visualization | Off Book | PBS: youtu.be/AdSZJzb-aX8 via @youtube

How to Visualize Data With Google Data Studio @fatmirhyseni #GoogleDataStudio #datavisualzation #analytics #reporting bit.ly/39xaJdM

Understand the Needs and Benefits of Data Visualization: bit.ly/37JAyHe #datavisualzation #edureka

Hello All, I have written a blog and uploaded a YouTube video (English, Telugu and Hindi) on the article "How to Choose data visualiser tool". Please let me know of any comments and suggestions. Thanks. #datavisualzation kmeeraj.medium.com/how-to-choose-… youtu.be/FmOsaCILskA
youtube.com
YouTube
1 - Data Visualiser Tool
Statista Racing Bars: World's ... alojapan.com/549355/statist… #datavisualzation #Covid19 #France #Infographic #JapanDestinations
Machine learning is great, until you have to explain it. Don't worry. This R package will save you. buff.ly/37MyMtS #rstats #datavisualzation #MachineLearning #AI #DataScience #DataAnalytics
Short and precise overview on visualization of data depending on questions to be answered. #datavisualzation datasciencecentral.com/profiles/blogs…
Otto Neurath's infograph of 1930, meant to show how deadly WWI was, also reveals the human catastrophe of Napoleon's Russian campaign of 1812. #twitterstorians #datavisualzation #Germany #Napoleon #RussianHistory #History #geschiedenis IN:storymaps.arcgis.com/stories/327491…
How to Visualize Data With Google Data Studio @fatmirhyseni #GoogleDataStudio #datavisualzation #analytics #reporting bit.ly/39xaJdM
Understand the Needs and Benefits of Data Visualization: bit.ly/37JAyHe #datavisualzation #edureka
Understand Data Visualization & Conditional Formatting in Excel bit.ly/2OlZpt5 #datavisualzation #edureka #conditionalformatting #excel

This week, learn about data visualization, marketing performance measurement and re-envision data science relationships. Read more! #datavisualzation #measurement #marketing ow.ly/dZ1g30nG2zd

Almost for everything, as a braindump, drawing stuff like prototypes of #datavisualzation, storybook for my blog articles, it's the smart me
YES>> Today's computing power + #bigdata + #PredictiveAnalytics + #DataVisualzation = a new era of business insights. #ArgyleCFO
Creating a color palette for a #DataVisualzation? Read this first: bit.ly/1Tj9zai @moyicat #ux #design
Statista Racing Bars: World's ... alojapan.com/549355/statist… #datavisualzation #Covid19 #France #Infographic #JapanDestinations
Machine learning is great, until you have to explain it. Don't worry. This R package will save you. buff.ly/37MyMtS #rstats #datavisualzation #MachineLearning #AI #DataScience #DataAnalytics
Creating a color palette for a #DataVisualzation? Read this first: bit.ly/1Tj9zai @moyicat #ux #design
Choosing a color palette for data visualization is not easy @InVisionApp #datavisualzation bit.ly/1NHh2P3
Otto Neurath's infograph of 1930, meant to show how deadly WWI was, also reveals the human catastrophe of Napoleon's Russian campaign of 1812. #twitterstorians #datavisualzation #Germany #Napoleon #RussianHistory #History #geschiedenis IN:storymaps.arcgis.com/stories/327491…
Something went wrong.
Something went wrong.
United States Trends
- 1. Thanksgiving 1.69M posts
- 2. Chiefs 92K posts
- 3. Chiefs 92K posts
- 4. Lamar 20K posts
- 5. Bengals 24.6K posts
- 6. Bengals 24.6K posts
- 7. Mahomes 29K posts
- 8. Zac Taylor 1,551 posts
- 9. Pickens 28.6K posts
- 10. Sarah Beckstrom 138K posts
- 11. #AEWCollision 6,545 posts
- 12. Joe Burrow 8,926 posts
- 13. Tinsley N/A
- 14. McDuffie 6,922 posts
- 15. Isaiah Likely N/A
- 16. Post Malone 5,044 posts
- 17. Derrick Henry 2,318 posts
- 18. Chase Brown 1,885 posts
- 19. #KCvsDAL 9,487 posts
- 20. Romo 8,534 posts