#excelchart نتائج البحث


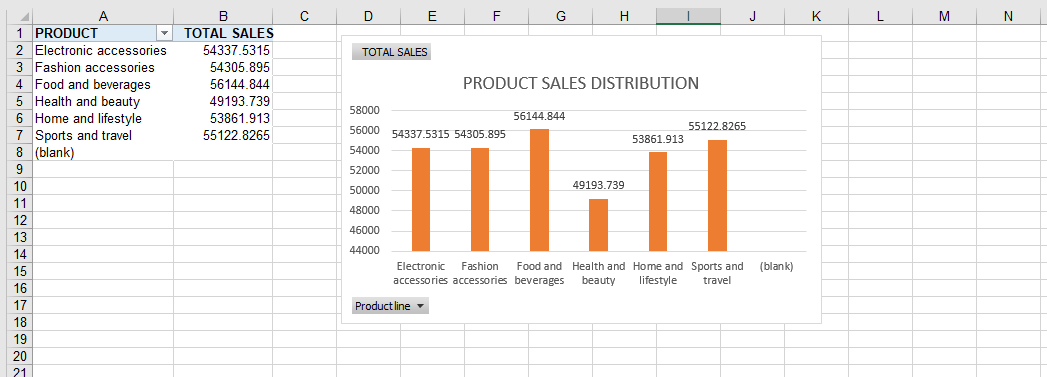
Day 5: Creating Charts A Bar chart showing the product-wise sales distribution of the supermarket This shows that the most purchased products were Food and breavages with a total of 56144.844 items. The least purchased was Health and beauty products #Excelchart #HTTDatachallenge


Data Entry Operator! Total Sales Report By Region. Available for freelance work, Let's talk about your project. #dataentry #exceldataentry #excelchart #chart #dataentryoperator #excel #job #linkedin #dataentrypowerpoint #remote #freelancer #timesheet #freelancing #freelance
Data Entry & B2B Lead Generation. Interior Designer Data List in Australia. Available for freelance work. Let's talk about your project. #dataentry #exceldataentry #excelchart #chart #dataentryoperator #excel #job #linkedin #storemanagement #storekeeper #timekeeper

Data Entry Operator. Doctors Vision Centre Data in Florida City, FL United States. Available for freelance work, Let's talk about your project. #dataentry #exceldataentry #excelchart #chart #dataentryoperator #excel #job #linkedin #storemanagement #storekeeper #timekeeper


Download this ready-to-use Excel Dashboard for Employee Performance Report ✔ Visual KPIs ✔ Productivity charts ✔ Team comparison Get clear insights in one place. 🔗 Link in comments #Excel #ExcelChart


Day 5 Today, we are using a bar chart to depict poduct sales distribution with the most sales coming from food and beverage product. Apparently, man cannot live without bread😔 #20dayswithdata #datavisualization #Excelchart #hertechtrailacademy #HTTDataChallenge

Day 4 Here we use conditional formatting to highlight high sales value. In this case, I highlighted the top 10 total sales. High sales to me means selling a good no. of products with highest cost price since the gross margin % are the same #20dayswithdata #conditionalFormatting


3. The most used payment method is Cash while use of credit card is the least method. 4. Females make more purchases at the supermarket than males. 5. Customers that are members bring more sales than normal customers. #hertechtrailacademy #ExcelChart #PivotTables #DataAggregation

Create a Dynamic Cost vs Budget Chart in Excel in under 60 seconds youtube.com/shorts/hwOvzx8… via @YouTube #exceltips #excel #excelchart #slicer #exceltutorial

youtube.com
YouTube
Create a Dynamic Cost vs Budget Chart in Excel in under 60 seconds

What is Word? & How to Create a Document in Word | Learning Digital youtube.com/watch?v=HEYHO3… #learningdigital #mswords #excelchart #advanceword #microsoftword #microsoft_word_tutorial #ldigital
youtube.com
YouTube
What is Word? | How to Create a Document in Word | Learning Digital

New self-hosted SeekTable version is just released. Major update: now report's Excel #export includes a chart! It goes in a separate worksheet, users can play with this #ExcelChart as they like. This is a rather unique capability among #BI tools. seektable.com/help/self-host…
Download this ready-to-use Excel Dashboard for Employee Performance Report ✔ Visual KPIs ✔ Productivity charts ✔ Team comparison Get clear insights in one place. 🔗 Link in comments #Excel #ExcelChart
Data Entry & B2B Lead Generation. Interior Designer Data List in Australia. Available for freelance work. Let's talk about your project. #dataentry #exceldataentry #excelchart #chart #dataentryoperator #excel #job #linkedin #storemanagement #storekeeper #timekeeper
Data Entry Operator! Total Sales Report By Region. Available for freelance work, Let's talk about your project. #dataentry #exceldataentry #excelchart #chart #dataentryoperator #excel #job #linkedin #dataentrypowerpoint #remote #freelancer #timesheet #freelancing #freelance
Data Entry Operator. Doctors Vision Centre Data in Florida City, FL United States. Available for freelance work, Let's talk about your project. #dataentry #exceldataentry #excelchart #chart #dataentryoperator #excel #job #linkedin #storemanagement #storekeeper #timekeeper
Create a Dynamic Cost vs Budget Chart in Excel in under 60 seconds youtube.com/shorts/hwOvzx8… via @YouTube #exceltips #excel #excelchart #slicer #exceltutorial
youtube.com
YouTube
Create a Dynamic Cost vs Budget Chart in Excel in under 60 seconds


Day 5: Creating Charts A Bar chart showing the product-wise sales distribution of the supermarket This shows that the most purchased products were Food and breavages with a total of 56144.844 items. The least purchased was Health and beauty products #Excelchart #HTTDatachallenge
Data Entry Operator! Total Sales Report By Region. Available for freelance work, Let's talk about your project. #dataentry #exceldataentry #excelchart #chart #dataentryoperator #excel #job #linkedin #dataentrypowerpoint #remote #freelancer #timesheet #freelancing #freelance
Data Entry & B2B Lead Generation. Interior Designer Data List in Australia. Available for freelance work. Let's talk about your project. #dataentry #exceldataentry #excelchart #chart #dataentryoperator #excel #job #linkedin #storemanagement #storekeeper #timekeeper
Data Entry Operator. Doctors Vision Centre Data in Florida City, FL United States. Available for freelance work, Let's talk about your project. #dataentry #exceldataentry #excelchart #chart #dataentryoperator #excel #job #linkedin #storemanagement #storekeeper #timekeeper
Download this ready-to-use Excel Dashboard for Employee Performance Report ✔ Visual KPIs ✔ Productivity charts ✔ Team comparison Get clear insights in one place. 🔗 Link in comments #Excel #ExcelChart
Day 5 Today, we are using a bar chart to depict poduct sales distribution with the most sales coming from food and beverage product. Apparently, man cannot live without bread😔 #20dayswithdata #datavisualization #Excelchart #hertechtrailacademy #HTTDataChallenge
Day 4 Here we use conditional formatting to highlight high sales value. In this case, I highlighted the top 10 total sales. High sales to me means selling a good no. of products with highest cost price since the gross margin % are the same #20dayswithdata #conditionalFormatting

Computer processing power doubles every two years at the same cost #MooresLaw out of steam @TheEconomist #ExcelChart


How to insert Stock Line Chart in Excel? #Excel #Exceltutorial #Excelchart exceltutorial.net/insert-stock-l…

How to insert the Candlestick Chart in Excel? #Excel #Exceltutorial #Excelchart exceltutorial.net/candlestick-ch…

How to insert Project Milestone or timeline chart in Excel? #Excel #Exceltutorial #Excelchart exceltutorial.net/project-milest…


Courier Service Excel Financial Model The Courier Service Excel Financial model provides you a dynamic dashboard and useful financial performance tools. oakbusinessconsultant.com/product/courie… #financialmodel #excelchart #advancedexcel #snailexcel #latinostem #hotkeyexcel #financialmodelling


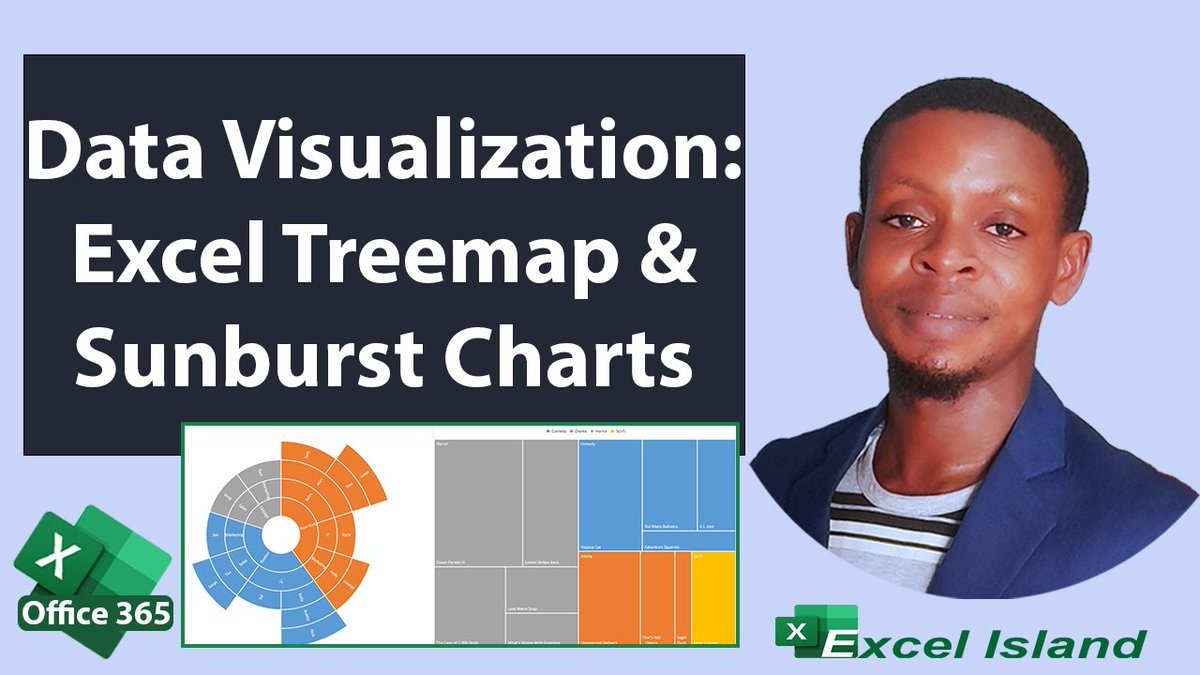
In this #Excel tutorial, you’ll learn to: ► Analyze & viz data with Treemap and Sunburst Charts. ► Types of datasets to visualize. ► Viz hierarchical datasets. 🎬 youtu.be/zNRCQzXR64Q Support: Share, Like, and Subscribe 🔔. #ExcelChart #ExcelDataViz
Something went wrong.
Something went wrong.
United States Trends
- 1. Jayden Daniels 13.8K posts
- 2. Dan Quinn 4,384 posts
- 3. Sam Darnold 13.1K posts
- 4. Seahawks 30.6K posts
- 5. Commanders 43.3K posts
- 6. #RaiseHail 7,539 posts
- 7. Joe Whitt 1,936 posts
- 8. Larson 19.4K posts
- 9. #RHOP 6,014 posts
- 10. Jaxson Hayes 2,310 posts
- 11. Denny 18.9K posts
- 12. Lattimore 2,245 posts
- 13. Chiefs 72.5K posts
- 14. #snfonnbc N/A
- 15. #BaddiesAfricaReunion 3,700 posts
- 16. Marcus Smart 2,094 posts
- 17. Bills 140K posts
- 18. jungkook 563K posts
- 19. Redskins 2,536 posts
- 20. 60 Minutes 57.2K posts