#visualdatascience risultati di ricerca

Unlock the full power of industrial analytics with visual data science. Join us on December 10 at 10am ET for a live session presenting the newest Spotfire Innovation release, Spotfire 14.7. Save your spot: na2.hubs.ly/H02dXG20 #Spotfire #VisualDataScience #SpotfireRelease
cloudsoftwaregroup.registration.goldcast.io
What’s New in Spotfire® 14.7: Smarter visuals, faster decisions
Join us for an exclusive first look at Spotfire® 14.7 - the latest innovation release designed to deliver clearer insights, faster authoring, and a smoother, more intuitive visual data science...
How do leading manufacturers stay ahead in one of the most complex and competitive industries on the planet? Read the full recap of our latest webinar, and access the on-demand version: na2.hubs.ly/H01LCXR0 #Spotfire #VisualDataScience #Renesas


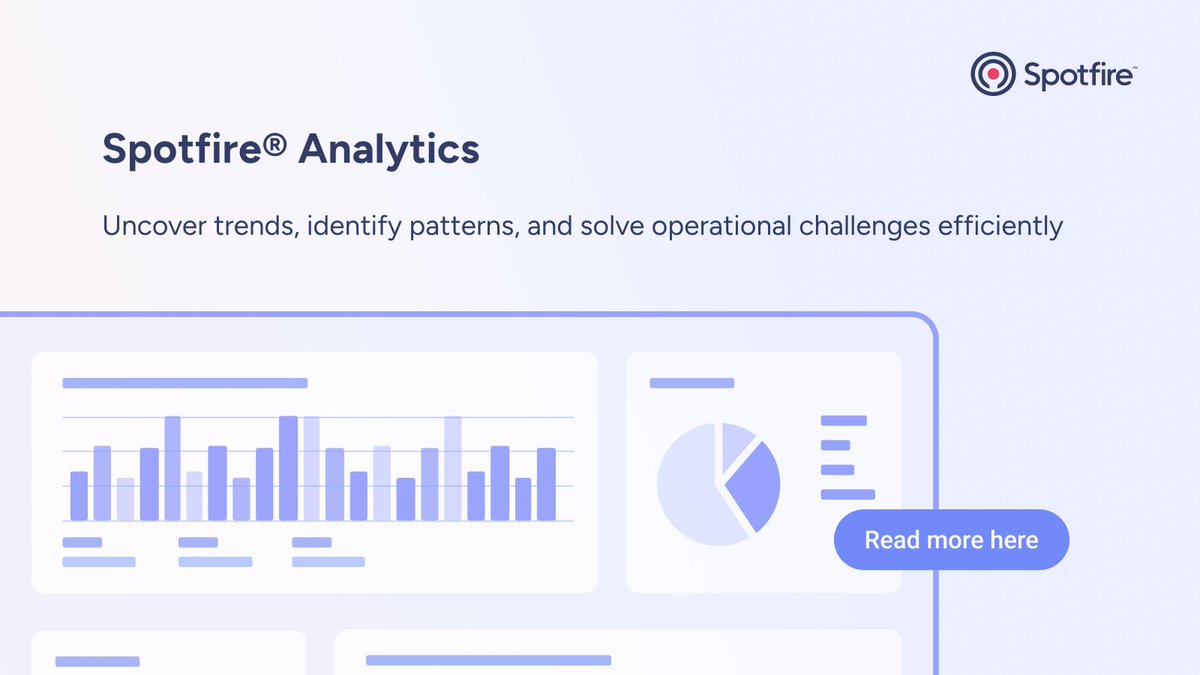
🚀 Unlock the Power of Data with Spotfire Analytics! Find out how Spotfire Analytics enables you to uncover trends, identify patterns, and solve operational challenges efficiently. Learn more: spr.ly/6017F8ygH #VisualDataScience #SpotfireAnalytics
Spotfire #VisualDataScience helps #Semiconductor manufacturers turn data chaos into clarity—enabling smarter decisions and operational excellence. Ready to harness your semiconductor data? Explore how in this blog: spr.ly/60150C7w1

The latest Spotfire enhancements are here, and they’re set to transform your data analysis. Join us for an exclusive webinar: spr.ly/6013Fv90X #Spotfire #VisualDataScience

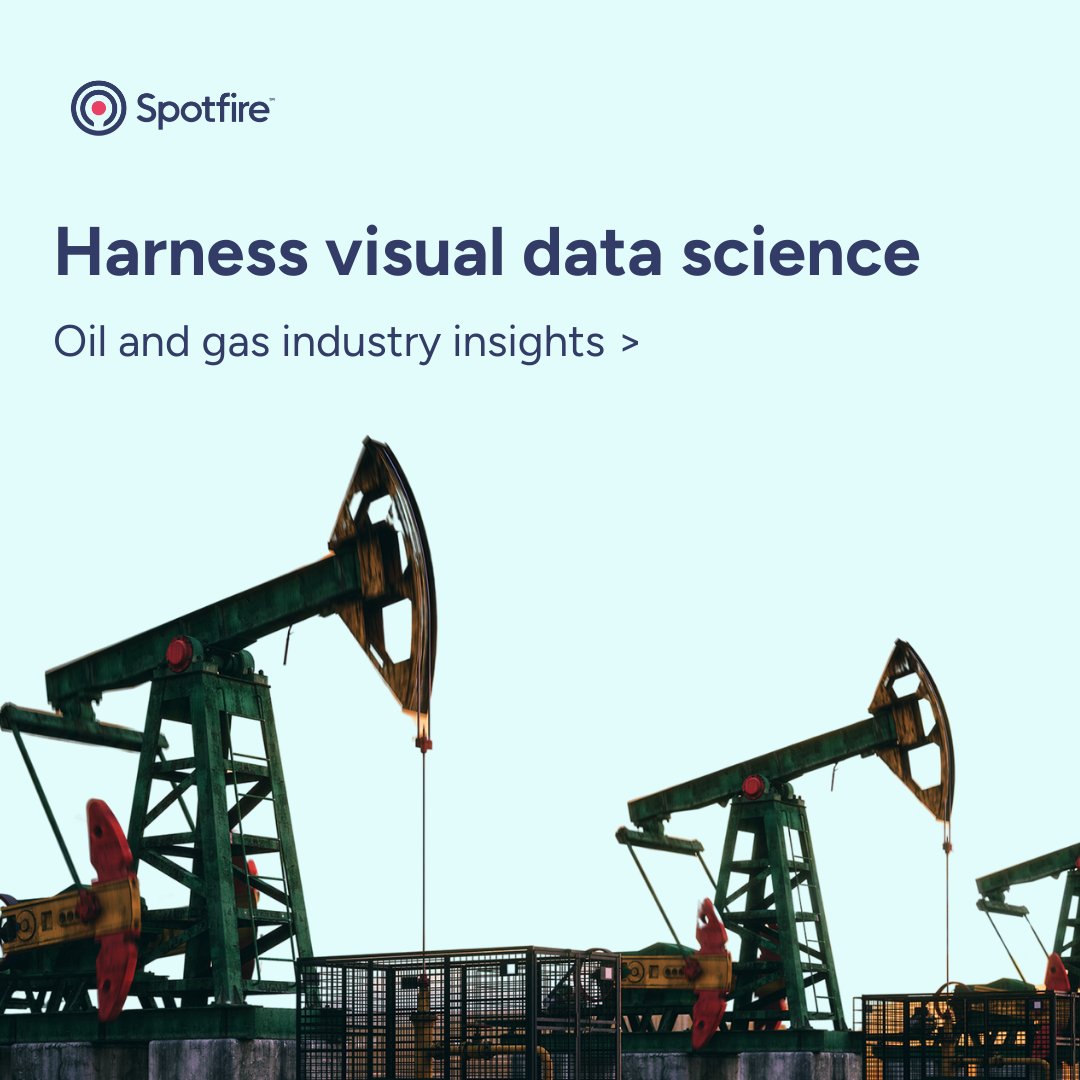
Energy leaders, are industry challenges getting in your way? Learn how to harness the power of your data with #VisualDataScience. Learn more: spr.ly/60100JJzA
Spotfire will be at the SPE Annual Technical Conference and Exhibition (ATCE) in Houston from October 20-22! Join us at booth #930 to meet our Spotfire experts and experience the power of visual data science through live demos. #Spotfire #VisualDataScience #SPE #ATCE2025…
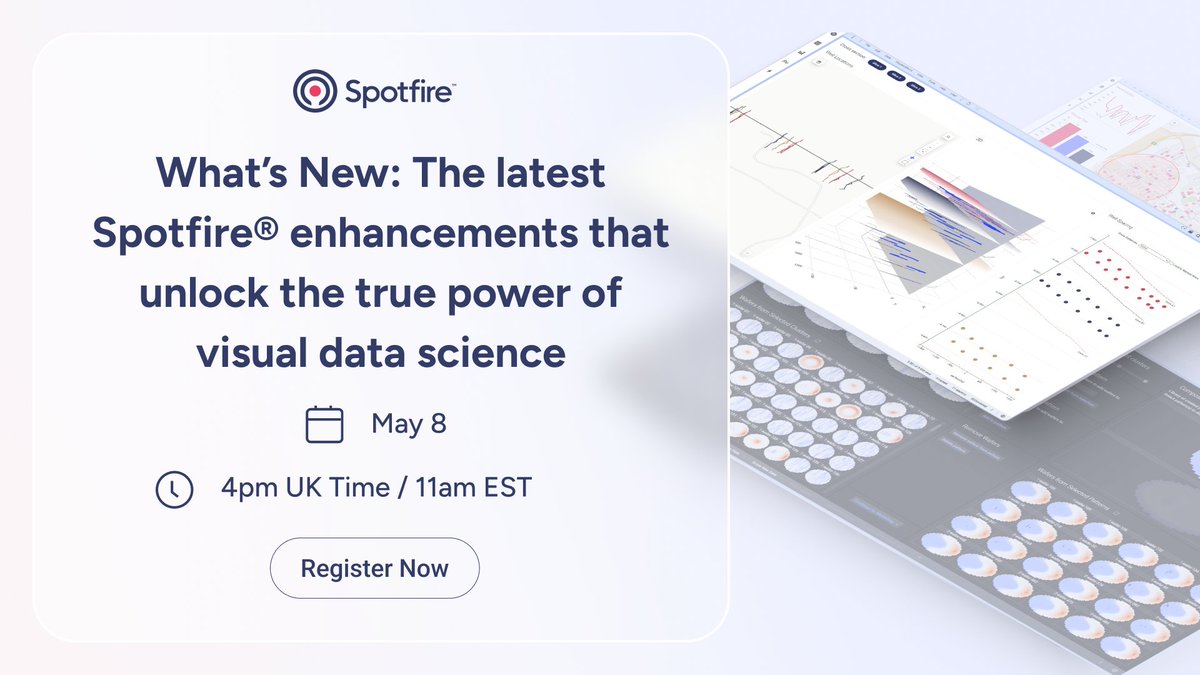
Tomorrow’s the day! Don’t miss out on our exclusive webinar: What’s New: The latest Spotfire® enhancements that unlock the true power of visual data science. May 8th at 4 PM UK / 11 AM EST 👉 Sign Up Now: spr.ly/6010N1tBr #Spotfire #VisualDataScience

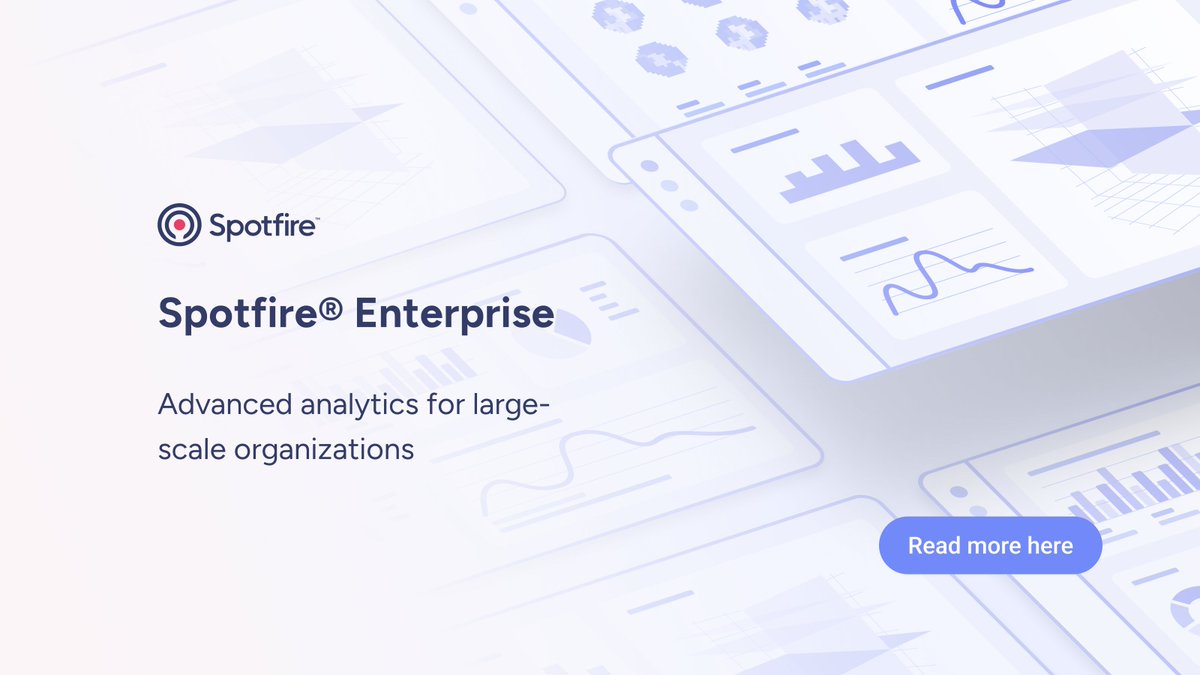
🏢 Enterprise-grade Analytics for Data-driven Organizations Streamline operations, ensure compliance, and foster collaboration at scale with Spotfire Enterprise: spr.ly/6014Fg2Pi #VisualDataScience #SpotfireEnterprise
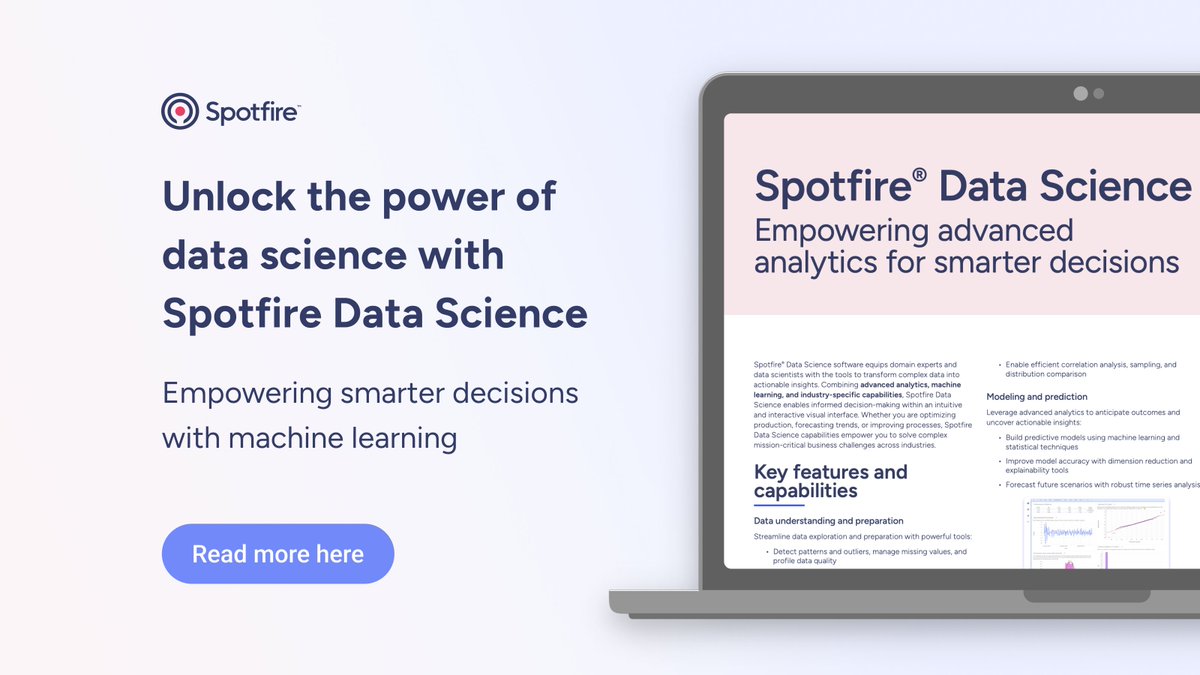
🤖 Unlock the Power of Data Science with Spotfire Spotfire Data Science empowers teams to predict trends, optimize operations, and make smarter decisions. Get all the details: spr.ly/6015FTb6b #VisualDataScience #SpotfireDataScience

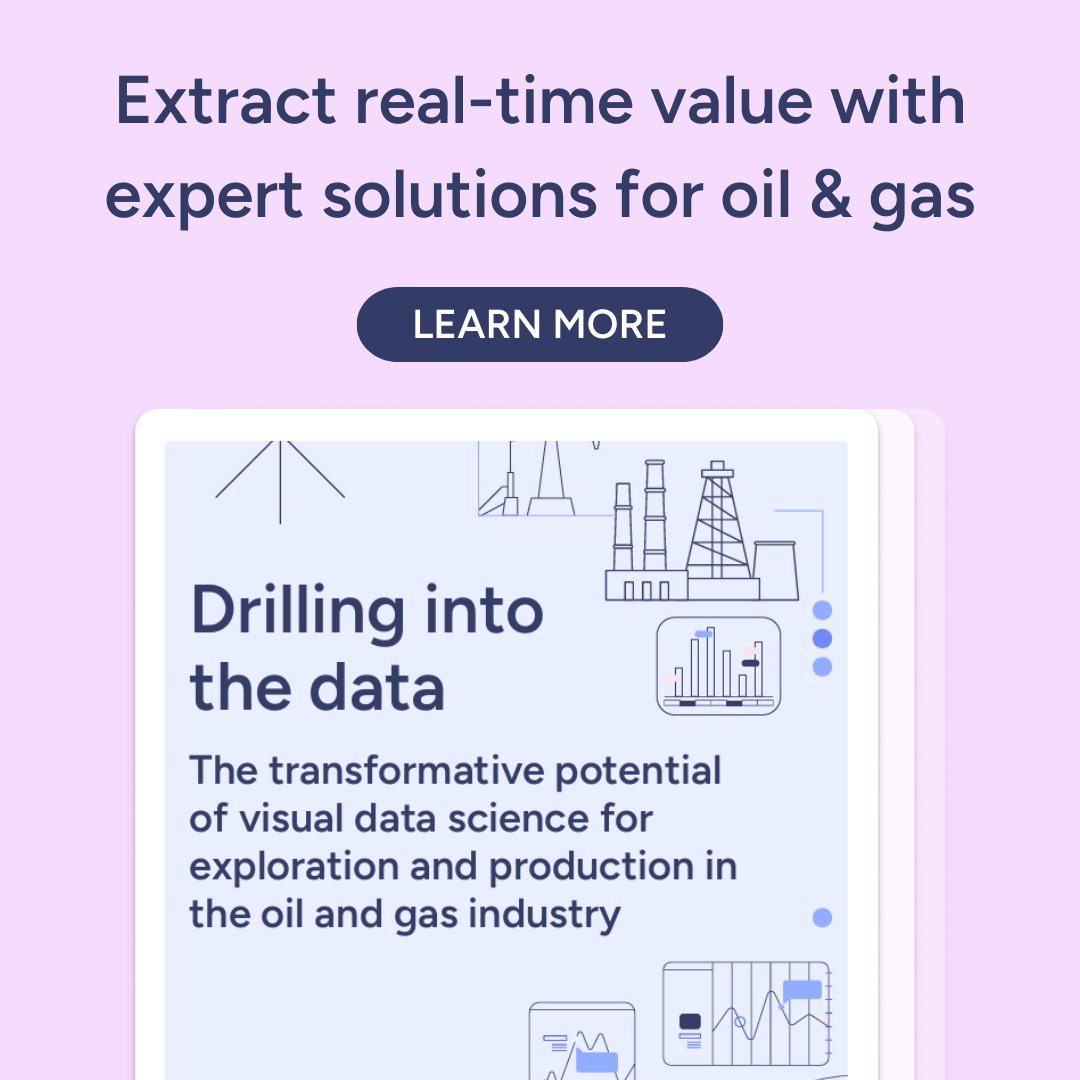
In this e-book, learn how Exploration and Production (E&P) leaders can equip their teams with cutting-edge data analytics tools. Hint: it's with #VisualDataScience ⚡ Discover: spr.ly/6011FHSnU

💡 Turn Data into Actionable Intelligence with Spotfire Data science shouldn’t be reserved for experts—with Spotfire you can anticipate outcomes, improve processes, and solve mission-critical challenges: spr.ly/6017FZIzR #VisualDataScience #SpotfireDataScience

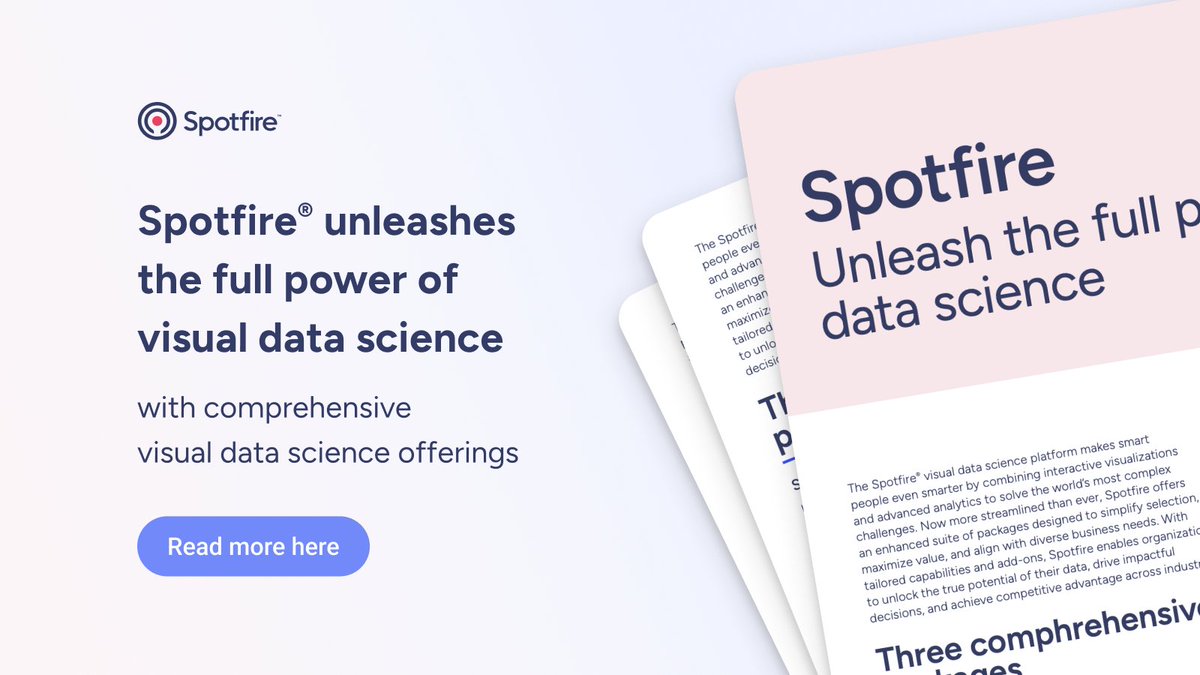
Discover how Spotfire can help you leverage advanced analytics and interactive visualizations to solve mission-critical challenges. The Spotfire Offerings Data Sheet lays out everything you need to know. Read here: spr.ly/60100N74K #VisualDataScience #Spotfire


The latest Spotfire enhancements are here, and they’re set to transform your data analysis. Join us for an exclusive webinar: spr.ly/6011Fv90h #Spotfire #VisualDataScience

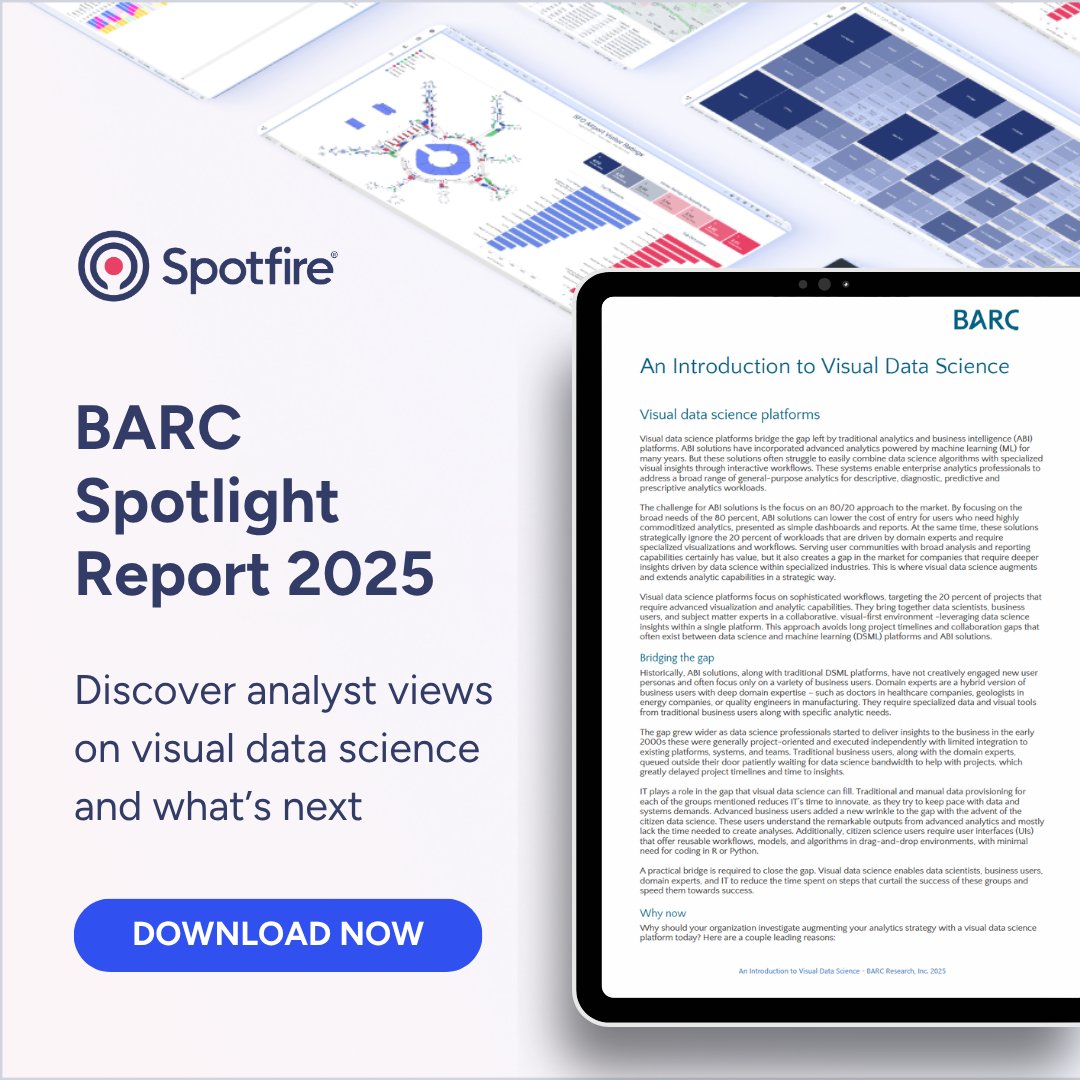
Learn from BARC Research about the latest insights on #VisualDataScience and the analytics industry overall in this 2025 spotlight report. Discover: na2.hubs.ly/y0v-YC0
Tomorrow’s the day! Don’t miss out on our exclusive webinar: What’s New: The latest Spotfire® enhancements that unlock the true power of visual data science. May 8th at 4 PM UK / 11 AM EST 👉 Sign Up Now: spr.ly/6013N1t13 #Spotfire #VisualDataScience
Want some key highlights from our joint webinar with BARC Research? Check out this blog to learn more about #VisualDataScience in action: na2.hubs.ly/y0vcWD0


Unlock the potential of image analytics! Learn how digital-driven visual data transforms customer experiences and boosts business outcomes in our latest white paper. bit.ly/3XlMCKq


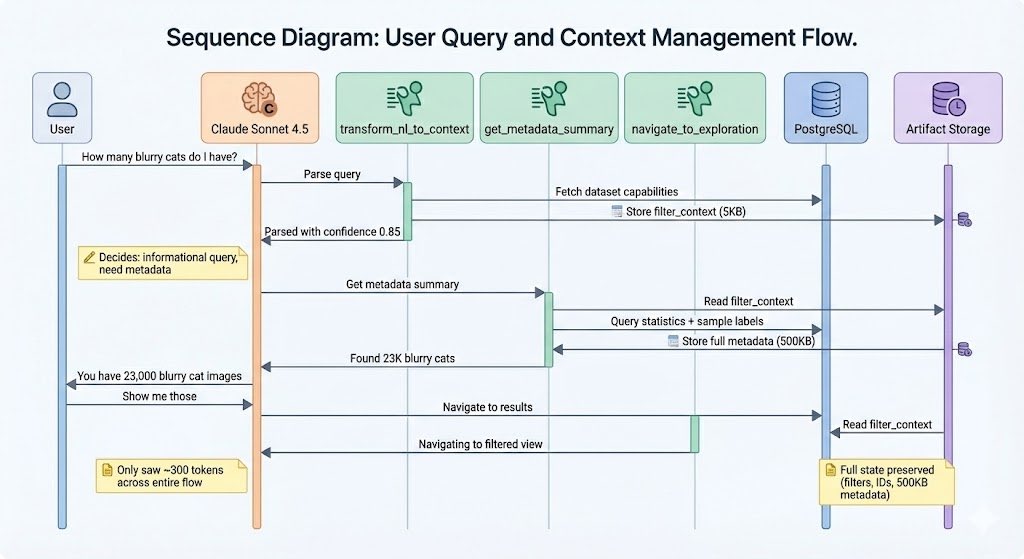
We model datasets as graphs (images, objects, labels, clusters) and pass only IDs + lightweight stats. Query-aware sampling and field-specific summaries mean the LLM usually sees ~2K tokens instead of 50M+, while tools still operate on full state. 🧵(4/5)

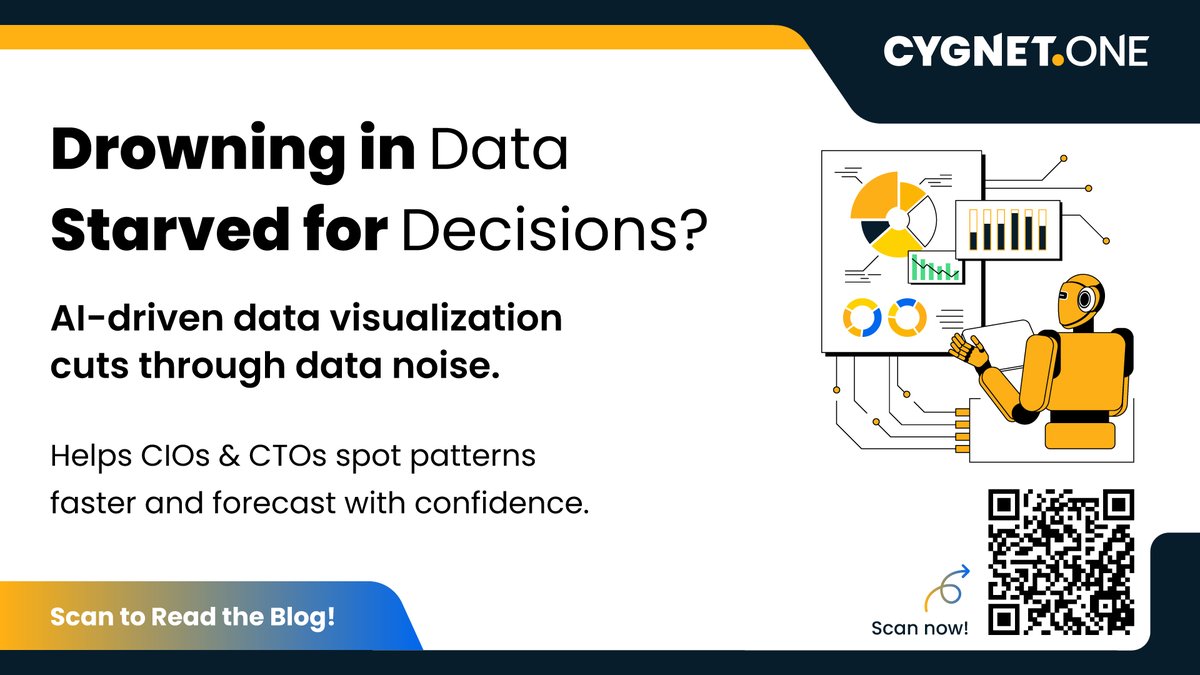
Data challenges CIOs & CTOs: exploding volumes, multiplying sources, lagging insights. AI visualization uncovers patterns & predicts ahead—data overload to smart decisions. Read more: cygnet.one/blog/ai-driven… #DataVisualization #Data #AI #DataInnovation

Visual Storytelling Charts, Dashboards, and Design Principles There is a misconception that "Data Visualization" means "Making things look pretty." False. Data Visualization is about reducing cognitive load. Your goal is to design a chart so that a manager can understand the…

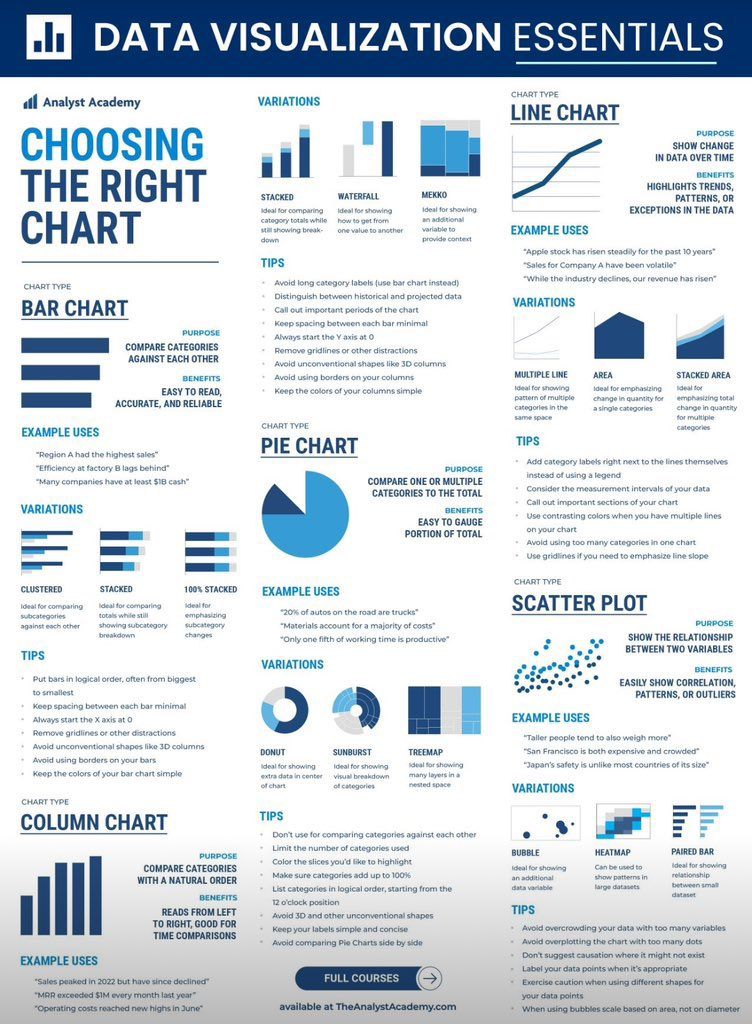
2 Data Visualization Cheat Sheet 📈 Choosing the right chart = half the battle. * Bar/Column → Compare categories * Line → Show trends over time * Pie/Donut → Proportions (use wisely!) * Scatter → Correlations & outliers 🔥 Bonus: Tips on avoiding misleading visuals (3D…
Unlock the full power of industrial analytics with visual data science. Join us on December 10 at 10am ET for a live session presenting the newest Spotfire Innovation release, Spotfire 14.7. Save your spot: na2.hubs.ly/H02dXG20 #Spotfire #VisualDataScience #SpotfireRelease
cloudsoftwaregroup.registration.goldcast.io
What’s New in Spotfire® 14.7: Smarter visuals, faster decisions
Join us for an exclusive first look at Spotfire® 14.7 - the latest innovation release designed to deliver clearer insights, faster authoring, and a smoother, more intuitive visual data science...


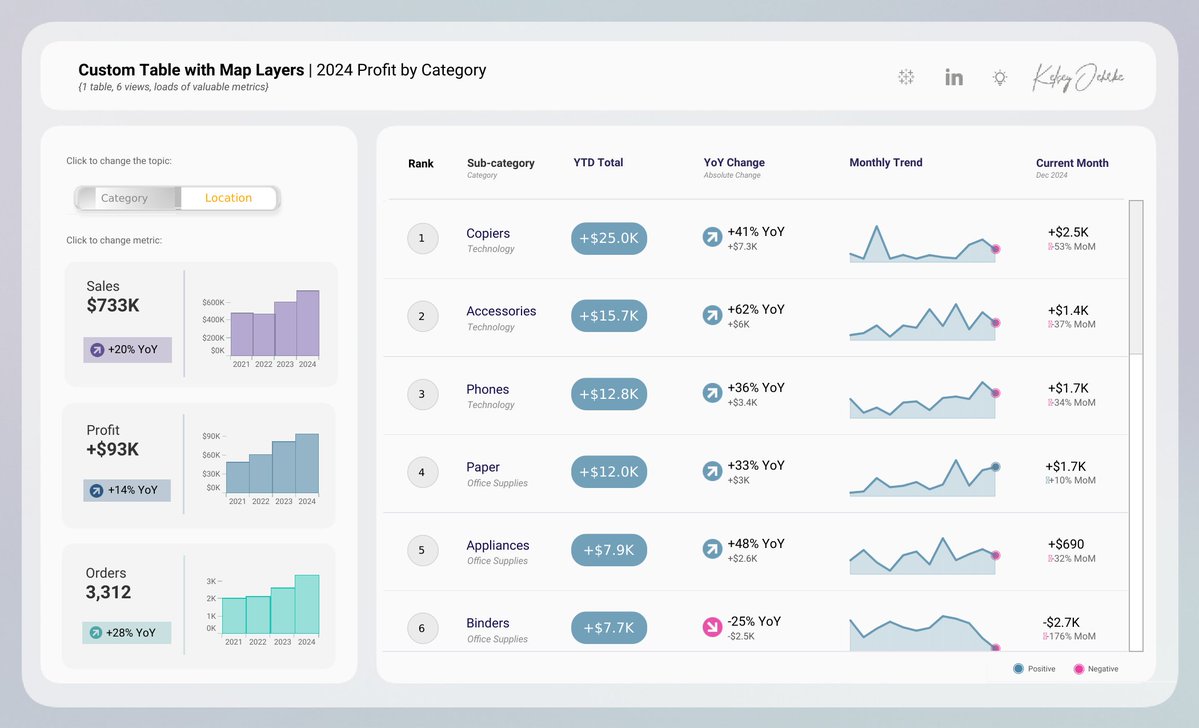
This #VizOfTheDay by Kelsey Oehrke displays a customizable dashboard with six views in one, combining KPIs and geospatial data for advanced analysis. Explore the viz: tabsoft.co/4ro8t0L

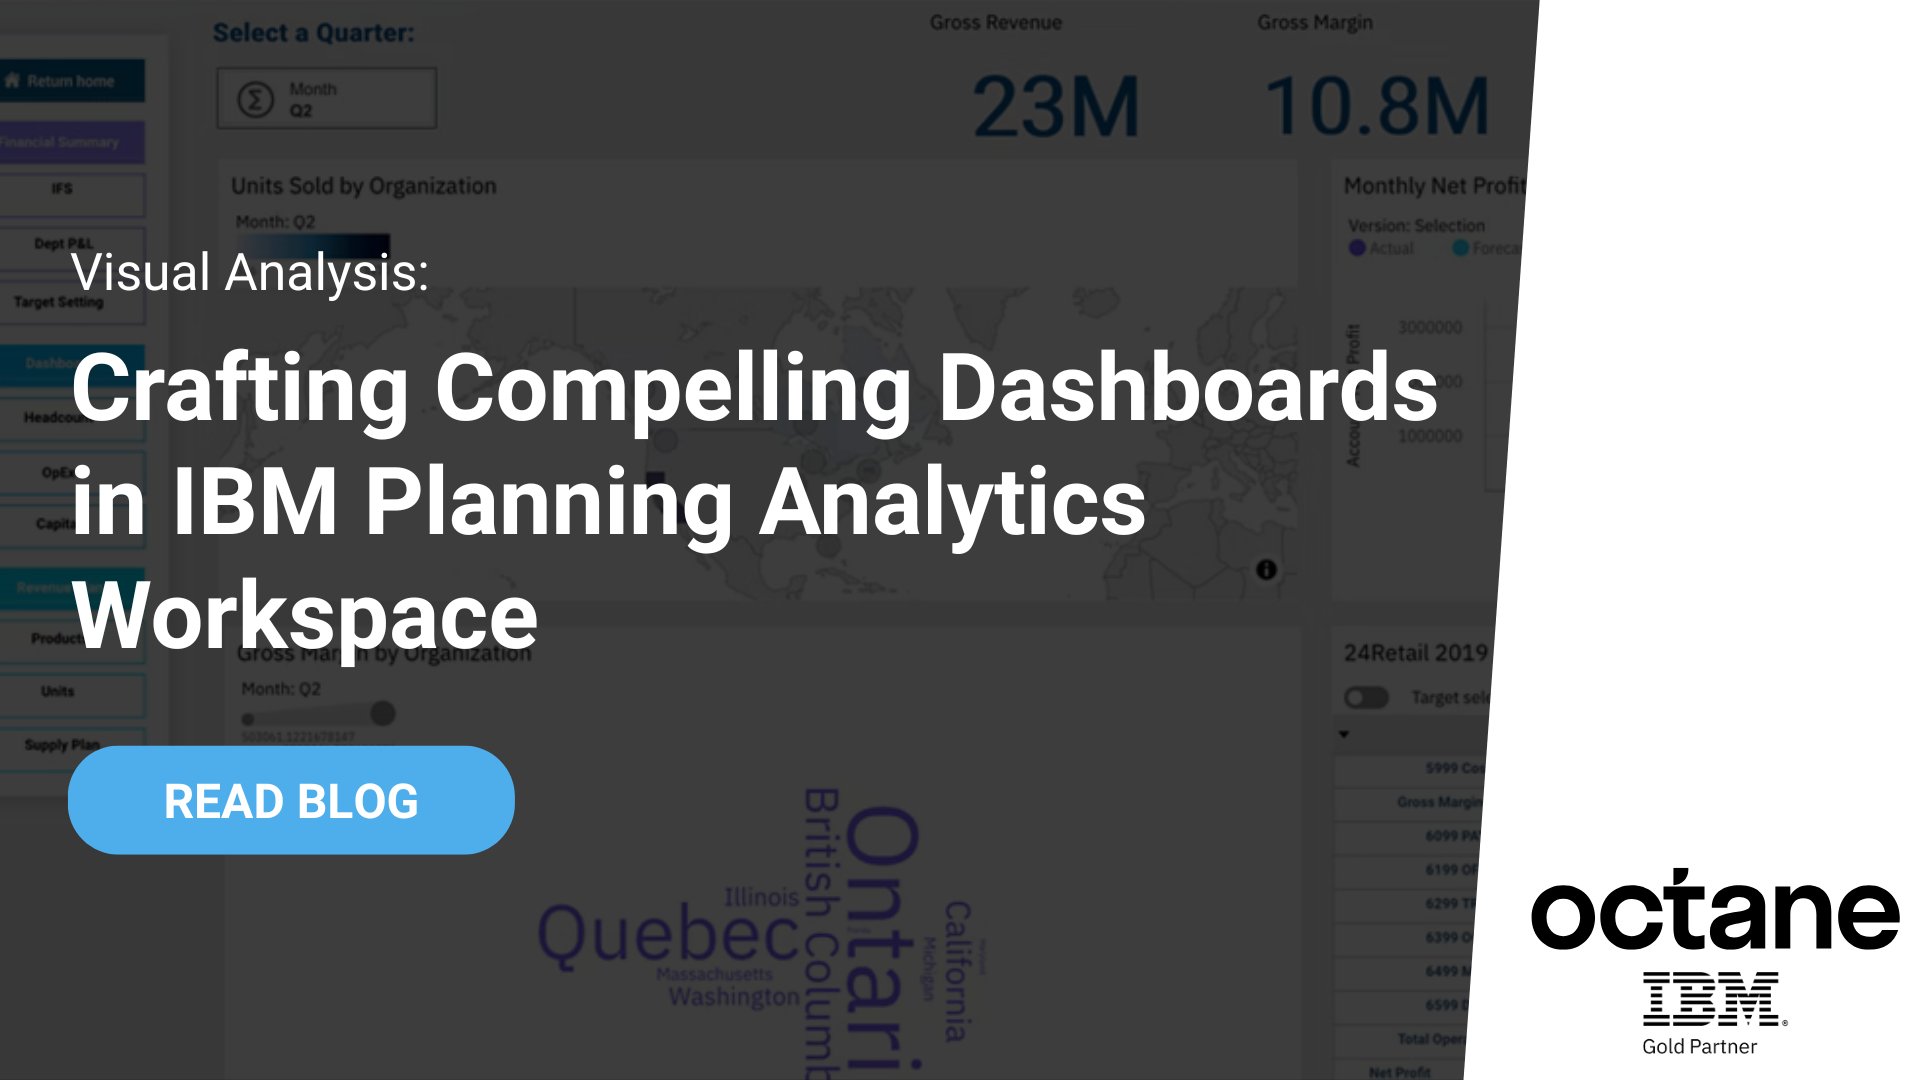
Visual Analysis: Crafting Compelling Dashboards in IBM Planning Analytics Workspace hubs.la/Q03VTNnh0

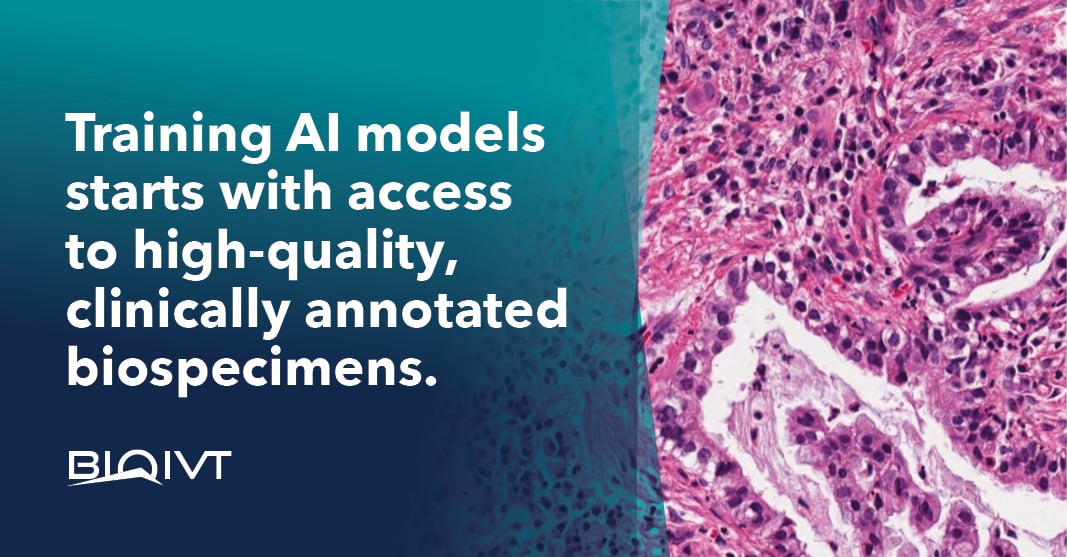
For those training #AI to detect disease, #Visionaire by BioIVT makes sourcing highly specialized, diverse, quality and validated #DigitalPathology whole slide images (#WSI) with clinically rich data easy. Learn more: hubs.ly/Q03VC__q0

Smarthistory – How to do visual (formal) analysis smarthistory.org/visual-analysi…


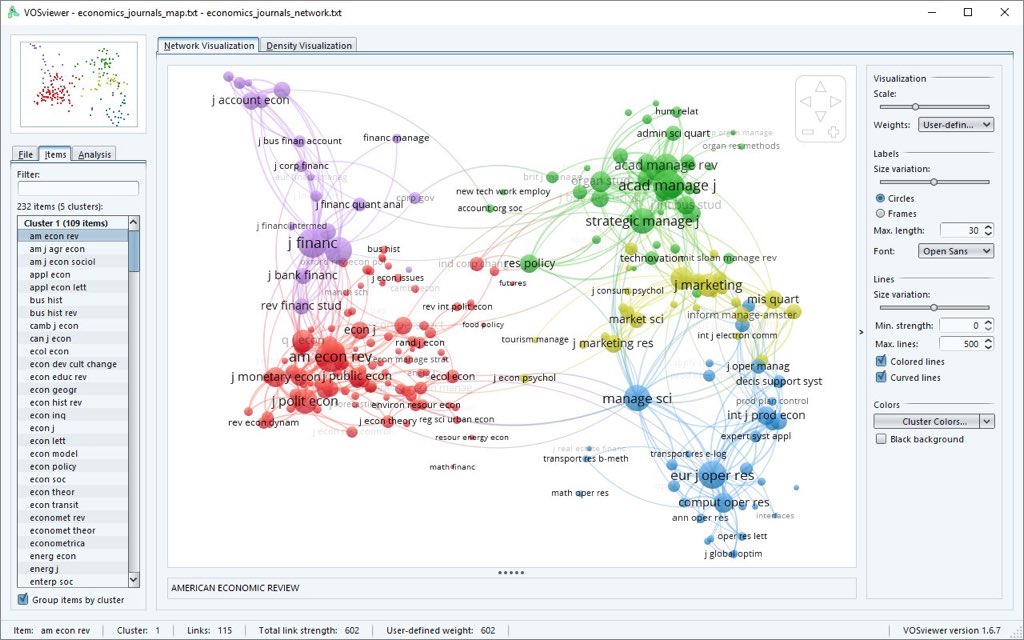
¡Descubre VOSviewer! 🖥️✨ Una herramienta para visualizar redes de investigación y relaciones entre autores, documentos y más. 📊🔍 ¡Convierte datos complejos en gráficos súper fáciles de entender! 🧠🌐 #Ciencia #Investigación vosviewer.com

Data Visualization – Data Visualization with R: ift.tt/jX2m5Pe

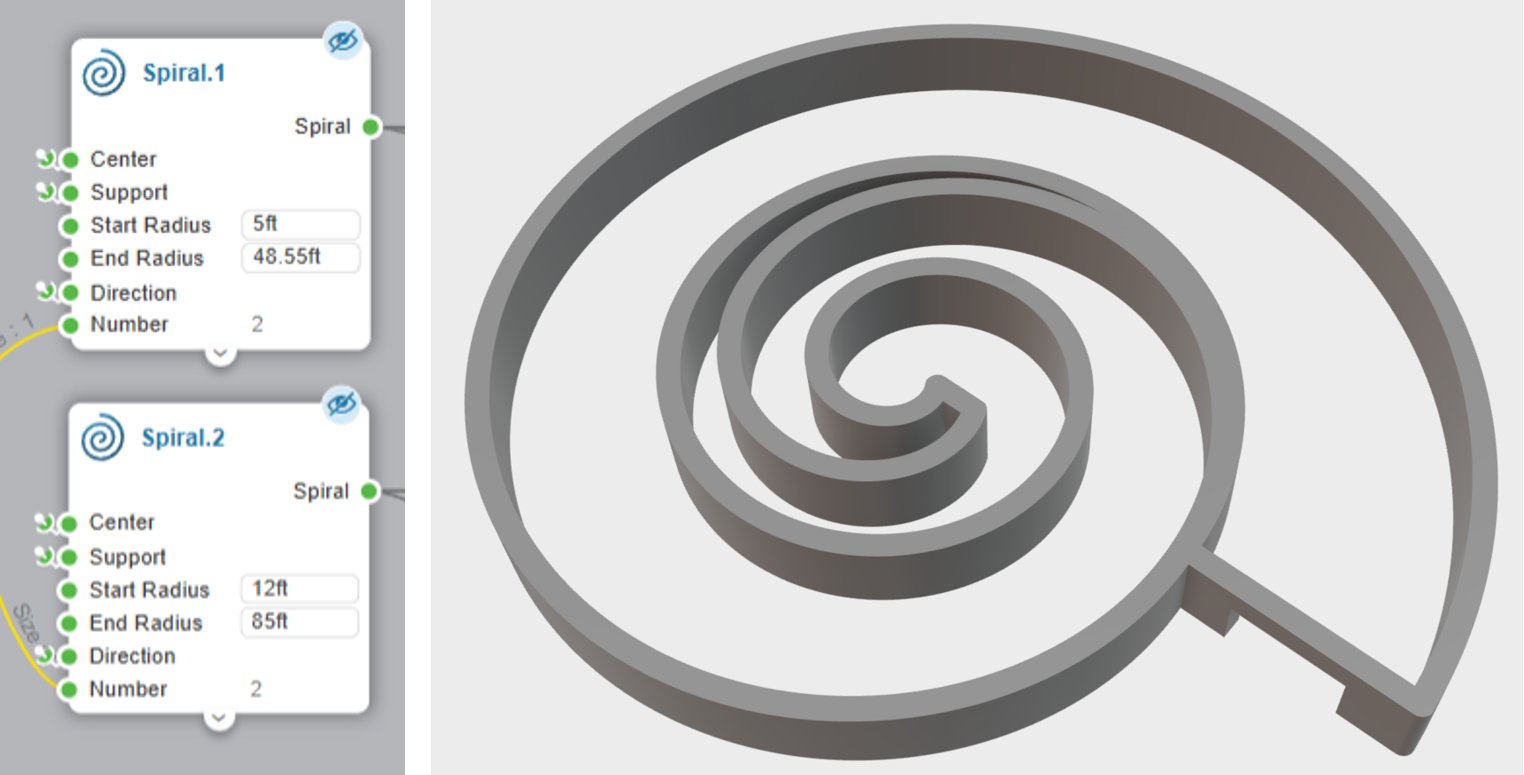
Happy Fibonacci Day! 🐚🌻In our latest blog, we explore how Visual Scripting brings Fibonacci patterns to life in CAD workflows, making modeling complex geometry easier and more intuitive. hubs.la/Q03Vv82F0 #FibonacciDay #VisualScripting #CADDesign #Automation

Smart Data Visualization 📊 Stop making charts manually. Paste your raw data ask Nano Banana Pro to "visualize this trend." It uses visual reasoning to build accurate, on-brand infographics instantly. #DataViz #Productivity #EnterpriseAI

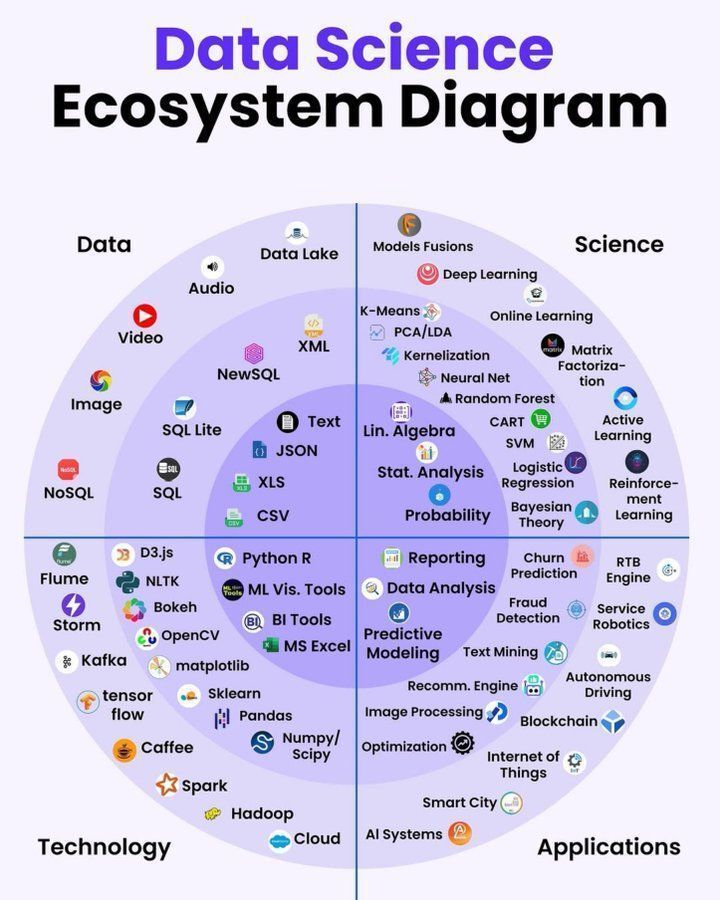
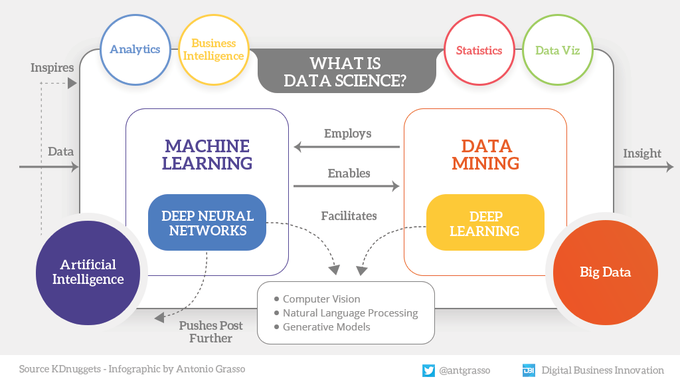
Through the synergistic collaboration of Data, Mathematics, and Computers, Data Science allows us to attribute explicit meaning to phenomena represented in the data that we could not otherwise discover. #infographic redesigned by @antgrasso #DataScience #AI
Spotfire® 14.6 is here! This latest release brings together enterprise-grade stability with next-gen visual data science. Read the blog: na2.hubs.ly/H01H7jt0 #Spotfire #VisualDataScience #Release
How do leading manufacturers stay ahead in one of the most complex and competitive industries on the planet? Read the full recap of our latest webinar, and access the on-demand version: na2.hubs.ly/H01LCXR0 #Spotfire #VisualDataScience #Renesas

If you're looking to optimise your shopfloor data, our on-demand webinar is for you! Join industry experts to explore how #VisualDataScience transforms complex data into actionable insights. Don't miss out 👉 hubs.la/Q02VjXCT0 #UKMfg #DigitalTransformation

Learn from BARC Research about the latest insights on #VisualDataScience and the analytics industry overall in this 2025 spotlight report. Discover: na2.hubs.ly/y0v-YC0
Want some key highlights from our joint webinar with BARC Research? Check out this blog to learn more about #VisualDataScience in action: na2.hubs.ly/y0vcWD0
If you've ever wanted to try out #VisualDataScience, now is your chance! Unlock the power of visual data science with a 30-day free trial of Spotfire® Data Science, the ultimate platform for turning data into actionable insights. Try now: na2.hubs.ly/y0vl9h0
The latest Spotfire enhancements are here, and they’re set to transform your data analysis. Join us for an exclusive webinar: spr.ly/6012Fv900 #Spotfire #VisualDataScience

Tomorrow’s the day! Don’t miss out on our exclusive webinar: What’s New: The latest Spotfire® enhancements that unlock the true power of visual data science. May 8th at 4 PM UK / 11 AM EST 👉 Sign Up Now: spr.ly/6015N1t8z #Spotfire #VisualDataScience

Discover why #Spotfire is the ultimate solution for #Semiconductors This infographic details how #VisualDataScience uses: 📈 AI-driven insights for increased data value 💫 Predictive analytics for equipment maintenance 💻 Interactive dashboards for capacity planning Overcome…

🏢 Enterprise-grade Analytics for Data-driven Organizations Streamline operations, ensure compliance, and foster collaboration at scale with Spotfire Enterprise: spr.ly/6010Fg2PC #VisualDataScience #SpotfireEnterprise

🤖 Unlock the Power of Data Science with Spotfire Spotfire Data Science empowers teams to predict trends, optimize operations, and make smarter decisions. Get all the details: spr.ly/6011FTb69 #VisualDataScience #SpotfireDataScience
🚀 Unlock the Power of Data with Spotfire Analytics! Find out how Spotfire Analytics enables you to uncover trends, identify patterns, and solve operational challenges efficiently. Learn more: spr.ly/6015F8ygP #VisualDataScience #SpotfireAnalytics

Spotfire #VisualDataScience helps #Semiconductor manufacturers turn data chaos into clarity—enabling smarter decisions and operational excellence. Ready to harness your semiconductor data? Explore how in this blog: spr.ly/60190C7wT

🚀 Unlock the Power of Data with Spotfire Analytics! Find out how Spotfire Analytics enables you to uncover trends, identify patterns, and solve operational challenges efficiently. Learn more: spr.ly/6017F8ygH #VisualDataScience #SpotfireAnalytics
Spotfire #VisualDataScience helps #Semiconductor manufacturers turn data chaos into clarity—enabling smarter decisions and operational excellence. Ready to harness your semiconductor data? Explore how in this blog: spr.ly/60150C7w1
💡 Turn Data into Actionable Intelligence with Spotfire Data science shouldn’t be reserved for experts—with Spotfire you can anticipate outcomes, improve processes, and solve mission-critical challenges: spr.ly/6017FZIzb #VisualDataScience #SpotfireDataScience
In this e-book, learn how Exploration and Production (E&P) leaders can equip their teams with cutting-edge data analytics tools. Hint: it's with #VisualDataScience ⚡ Discover: spr.ly/6019FHSnx
Spotfire dives into how you can unlock innovation in semiconductor manufacturing with visual data science in our latest feature in Manufacturing and Technology Digital 📖 Explore: spr.ly/6019N8aQJ #TechnologyMagazine #VisualDataScience

Something went wrong.
Something went wrong.
United States Trends
- 1. Black Friday 390K posts
- 2. Egg Bowl 4,235 posts
- 3. Kamario Taylor N/A
- 4. Mississippi State 2,610 posts
- 5. #SkylineSweeps N/A
- 6. Emmett Johnson N/A
- 7. NextNRG Inc 1,774 posts
- 8. #Rashmer 24.4K posts
- 9. Trinidad Chambliss N/A
- 10. #FanCashDropPromotion 1,681 posts
- 11. #jonita 20.2K posts
- 12. Kewan Lacy N/A
- 13. Stricklin N/A
- 14. #Huskers N/A
- 15. Wetjen N/A
- 16. WHO DEY 5,388 posts
- 17. Mainz Biomed N.V. N/A
- 18. Jedd Fisch N/A
- 19. Andriy Yermak 19.2K posts
- 20. Cyber Monday 6,625 posts