#visualisations search results

The new GP #Visualisations webinar recording is now available! The session includes: - Unlocking the art of the possible with powerful, system-wide visualisations - Getting started with system-wide visualisations right away - Building your own visualisations in just 5 easy steps…
🚨 Live in 3 hours! Join our new GP #Visualisations webinar today at 12:30. 👉 Use the link here: youtube.com/live/UQrsRKxD0…

youtube.com
YouTube
Visualisations with TPP SystmOne
🕧 Don’t forget to attend our latest #SystmOne GP #Visualisations Webinar TOMORROW at 12:30! Hear about the new Visualisations from the TPP experts and #GP user experiences. 👉 Join live here: youtube.com/live/UQrsRKxD0…
🕧 Don’t forget to attend our latest #SystmOne GP #Visualisations Webinar TOMORROW at 12:30! Hear about the new Visualisations from the TPP experts and #GP user experiences. 👉 Join live here: youtube.com/live/UQrsRKxD0…
🕧 Join us next Wednesday at 12:30 for our latest #SystmOne #Visualisations Webinar! Discover how to unlock the full potential of system-wide visualisations and transform your data into powerful, actionable visuals. 👉 Join live here: youtube.com/live/UQrsRKxD0…
youtube.com
YouTube
Visualisations with TPP SystmOne
🕧 Join us and Dr Gandhi on Wednesday 15th October at 12:30 for an action packed #webinar designed to take #SystmOne #Visualisations to the next level across your practice. ✨ Agenda includes: - Unlocking the art of the possible with powerful, system-wide visualisations -…

….The user can thus practice regularly between sessions, using guided audio #visualisations, inspiring visual supports, or interactive exercises. Some applications even offer personalised progress tracking system, with reminders to practice, #motivating #challenges, and…

📢 Attention Researchers - need to make map showing data over time and location? But fed up wasting time standardising basic data? IDDO Statistician Rhys Peploe has created a tool that could save you lots of time… Introducing IDDO’s mapping tool worlddatr #visualisations

📈 New Community #Visualisations now live in #SystmOne! Our Visualisations transform detailed information into clear, concise insights, saving you time and giving you a quick, complete picture. ✨ What’s New? - New Care Overview: Instantly access the patient’s complete care…
✨ Add our new out-of-the-box #Visualisations to your toolbar or clinical tree in #SystmOne! Step 1: Navigate to Organisation Preferences Step 2: Select the Clinical Tree Configuration node Step 3: Amend your tree and add the Visualisation 🎥 Watch the step-by-step video:…

Feeling drained? Protect your energy with this trick: Visualize a pink light bubble around you. Scoop from toes to head, palms facing. Try it! #visualisations #reiki @LowPriceTarot


Struggling to maximise your #industrialdata visualisations? We’ve got you. Get better, deeper #visualisations in CONNECT using Experiences. Learn how: hubs.la/Q03yslnB0

Unlock a smarter way of working with #Visualisations in SystmOne: ✅ Quick view of key information ✅ Work from intuitive layouts ✅ Gain instant insights ✅ Support for safer, faster decision making Start building your visualisations to boost efficiency and streamline your day.


How can we improve patient #monitoring? The editorial by Ebensperger et al. explores the use of advanced #auditory alerts and #visualisations to improve information delivery. #BJA #patientsafety #alarms bjanaesthesia.org/article/S0007-…

📢 Attention Researchers - need to make map showing data over time and location? But fed up having to waste time standardising basic data? IDDO Statistician Rhys Peploe has created a tool that could save you lots of time… Introducing IDDO’s mapping tool worlddatr #visualisations

📹 Check out the SystmOne #Visualisations webinar recording now! We explored a range of Visualisations to inspire users and spark ideas as our SystmOne users shared their real-world examples and any valuable lessons they’ve learned. Watch the recording here:…

Many, many years ago, I was lucky enough to work with @thetimeteam on some #3D reconstructions... If only we had known then how far #visualisations would come!

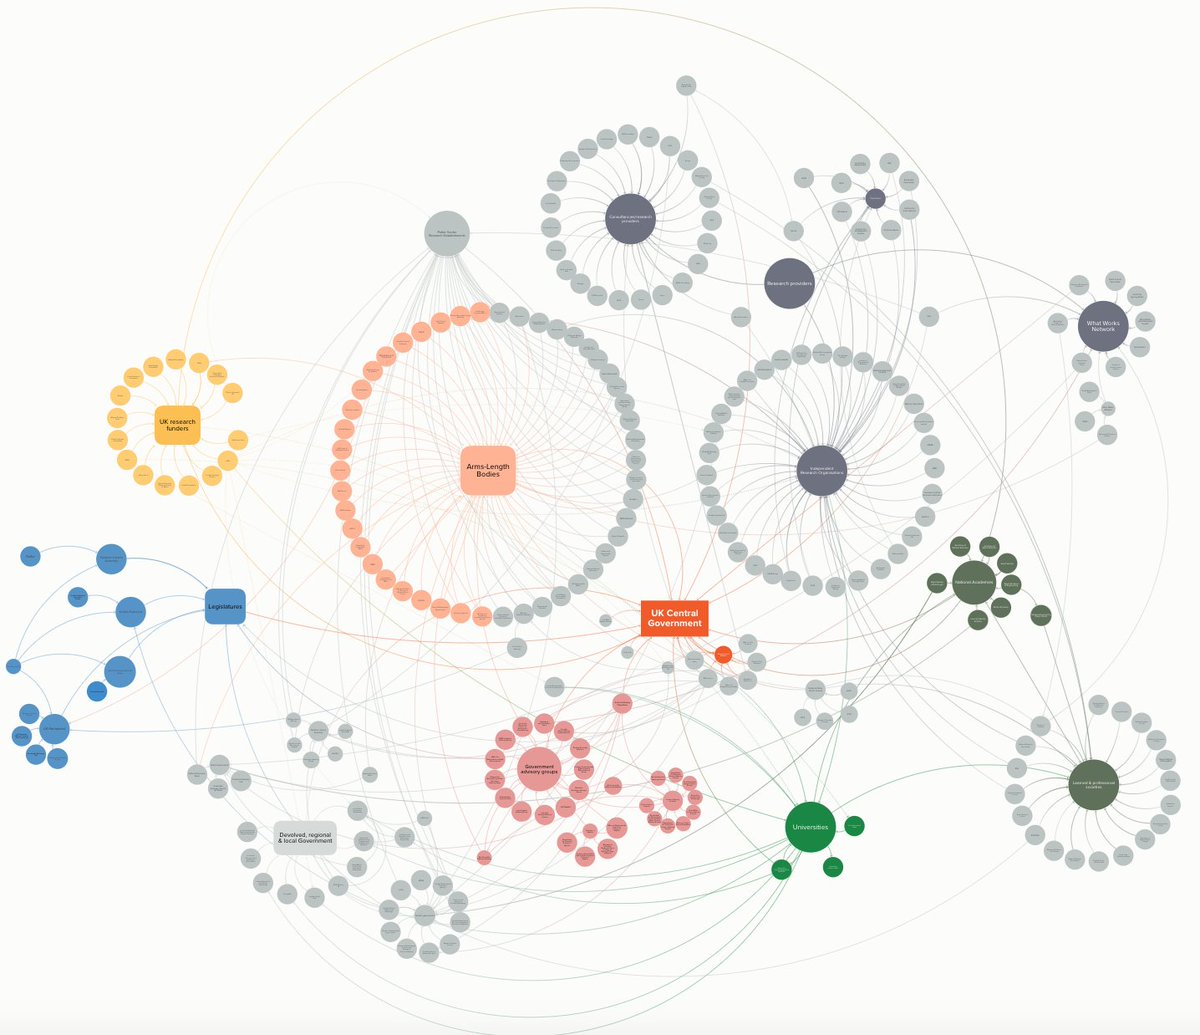
An Atlas of Connections (and Omissions!) Jonathan Breckon introduces @PolicyUpen's new map of the UK's policy-academic world. #visualisations #maps #evidence #policy transforming-evidence.org/blog/mapping-t…
📊Join our SystmOne #Visualisations webinar this Wednesday at 12:30 (UK time). We’ll showcase a range of Visualisations designed to spark ideas. SystmOne users will also share how they’ve streamlined processes by having data all in one place. Sign up now: shorturl.at/q7Ntf

Join the SystmOne #Visualisations webinar, next Wednesday. We’ll explore how visualisations can be used in an exciting and innovative way for the benefit of your services. You’ll also hear from #SystmOne users on how they’ve streamlined processes by having data all in one place.…


How can we improve patient #monitoring? The editorial by Ebensperger et al. explores the use of advanced #auditory alerts and #visualisations to improve information delivery. #BJA #patientsafety #alarms bjanaesthesia.org/article/S0007-…

Analysing big #data involves numerous steps, from gathering and storing, to data mining, mapping, #visualisations and monitoring. The result? A production process that is entirely transformed. bit.ly/2o0qkMS #UKmfg #manufacturinghour #Mfghour #4IR


#P7LHillside were being reflective readers today and have created #Visualisations of “The Marrog” @anneglennie.


Celebrate the #InternationalDayofConscience with this collection of beautiful #meditations, #visualisations, and #affirmations 💭 Link: insig.ht/M8ymXn0Xcfb


Some striking #data #visualisations from @heshan_cheri & @_giuseppemacri from @Uber. #geospatial is one of Uber's biggest assets - used for identifying trends & patterns, comparison and analysis, for example to predict supply & demand #GeoCom18


Super excited to start weekly @_deardata 📝rituals with @annapurani93 Using our mutual love for unusual #visualisations & atypical data points as a way to get to know each other better! 🐟Week 1: Our water intake patterns


Saviez-vous que Google News Lab vous propose un outil pour créer facilement des mini #visualisations de données animées. heuristiquement.com/2019/03/creer-…

Simple et ludique, Google News Lab nous propose un outil pour créer des mini #visualisations de données animées en quelques clics. heuristiquement.com/2019/03/creer-…


Passionate about #3D, @nicolaraluk plays with #prototyping #visualisations and #spatialdata at work and for fun. As a #ProductEngineer at @Esri she landscapes the web using #ARcGIS and #JavaScript. To learn how, come see Raluca in 3D at #revojs: revojs.ro/tickets/


New challenge: design simpler #visualisations for a wider audience in the new @IPCC_CH #AR6 report. What does 'simpler visualisations' mean to you? @FILWD @lisacrost @valmasdel @ed_hawkins @KHayhoe @piersforster @JoeriRogelj @moritz_stefaner @Peters_Glen @DataVizSociety


Find up-to-date information about the status of #OSH in the 🇪🇺 through our revamped OSH Barometer. Generate easy-to-understand #visualisations and dashboards with the help of newly introduced #OSHindicators and functionalities. 👉osha.europa.eu/en/highlights/… #OSHdata #OSHstatistics


A Simple Guide to #MachineLearning #Visualisations @kdnuggets bit.ly/3vQJzeg #data #DataScience #Datavisualization #AI #technology #100DaysOfCode #TensorFlow #Bot @Khulood_Almani @jeancayeux @chidambara09 @RLDI_Lamy @AlbertoEMachado @SusanFourtane @Hana_ElSayyed


JMA 13 (3&4) is available! Check it out! Some great articles!! #mathsarts #visualisations #interdisciplinarity #multipleperspectives #creativity #passion #motivation


#Visualisations are a useful tool that can have many benefits, including increased focus, stress reduction and increased confidence. Take a moment to #PauseForSelfCare today with this advice from @MLMCommHealth @dreddiemurphy


#COVID19 Coronavirus related #datasets and #visualisations provided by @ecdc_eu Check here 👉👉 bit.ly/2TORKow #EUOpenData #OpenData

Last night I bought this evening dress online: live evening events that I have tickets to are currently postponed indefinitely so I’m debating whether having done so in the midst of a pandemic I’ve demonstrated good, positive #visualisations or downright delusional behaviour 😂


🆕Key figures on Europe, 2021 Edition🇪🇺 📊With #visualisations & #data presentations, this publication provides an overview of the current situation & recent developments across the #EU, including data on the impact of the #COVID19 crisis during 2020❗😷 👉europa.eu/!CJBvDJ

✨ Add our new out-of-the-box #Visualisations to your toolbar or clinical tree in #SystmOne! Step 1: Navigate to Organisation Preferences Step 2: Select the Clinical Tree Configuration node Step 3: Amend your tree and add the Visualisation 🎥 Watch the step-by-step video:…

Find out how #MixedReality merges the real and #virtual worlds to produce new environments and #visualisations in our latest Tech Explained feature. springwise.com/tech-explained…

Something went wrong.
Something went wrong.
United States Trends
- 1. #UFC322 92.1K posts
- 2. Morales 26.3K posts
- 3. Morales 26.3K posts
- 4. Kirby 17.5K posts
- 5. Sark 5,272 posts
- 6. Georgia 81.1K posts
- 7. Leon 69.8K posts
- 8. #GoDawgs 8,480 posts
- 9. Sean Brady 4,776 posts
- 10. Bo Nickal 6,528 posts
- 11. Ole Miss 10.5K posts
- 12. Arch Manning 3,073 posts
- 13. Texas 191K posts
- 14. Dillon Danis 5,327 posts
- 15. Bama 21.5K posts
- 16. Gunner Stockton 1,586 posts
- 17. Lebby 1,283 posts
- 18. Ahmad Hardy N/A
- 19. Shapen 1,077 posts
- 20. Ewing 6,968 posts