#datastories search results


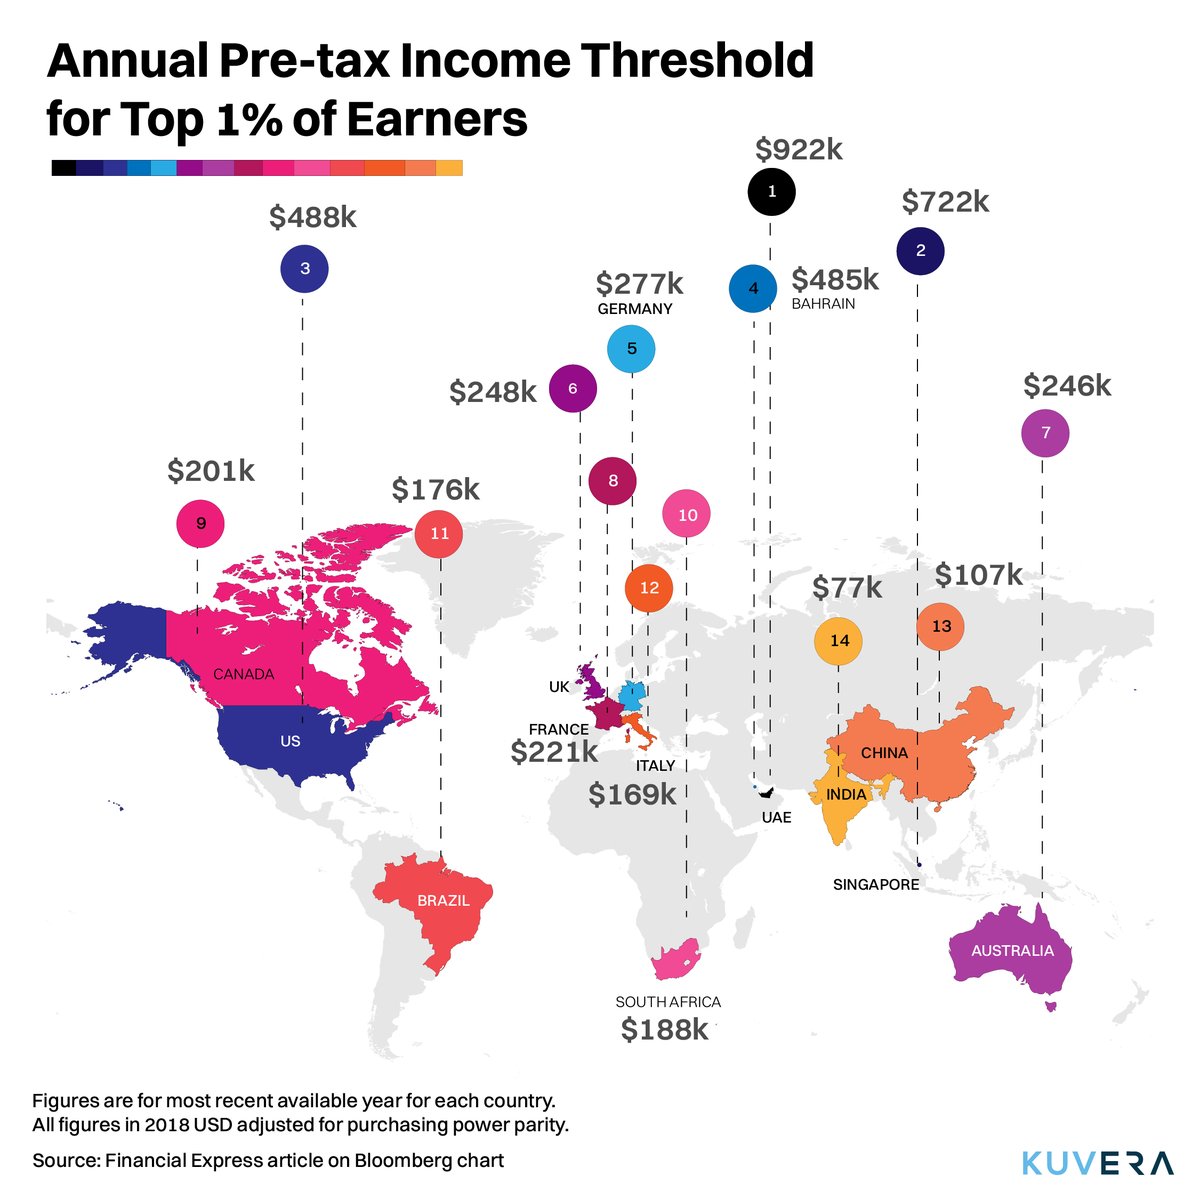
If you earn ₹16L+, you are among the Top 1% earners in India. Here's what's needed in other countries 👇🏼 Figures adjusted for purchasing power parity. #datastories

Why did the US dollar slide in April 2025? Learn how FX hedging played a key role in our video, and dive into the BIS Bulletin for the full analysis. Read more: bit.ly/4ngvMI3 #BISDataStories #DataStories

📊 Turn raw data into stories that inspire action. Discover Yellowfin 9.16 → AI-powered queries + Tell Me About My Data. More choice. More clarity. More stories. 👉 Watch Now : bit.ly/45qho9a #YellowfinBI #DataStories #AI
Are fast payments redefining the future of payments? Find out in our video below, and dive into the BIS Committee on Payments and Market Infrastructures’ recent statistics on key trends in retail payments. bis.org/statistics/pay…. #BISDataStories #BISStatistics #DataStories
How do large shifts in commodity prices influence monetary policy? Find out in our data story below and discover more in our recent research on this topic: bit.ly/4ge27u9 #BISDataStories #BISStatistics #DataStories

In just 2 days, we are releasing an interactive website where you can analyze over 60 socioeconomic indicators to explore the link between a community’s well-being and their justice footprint! #TheRightInvestment #DataStories


#DataStories have been a focus of @pegfitz101 & I's work in #ViSN this year. We have presented individualised infographics to schools as part of our visits. We are immensely proud of our results continuing to improve every year!


Gujarat outshines Maharashtra in per capita income, logs 160% Read the full story here – thehindubusinessline.com/data-stories/d… #datastory #datastories #businessline #radheshyamjadhav #maharashtra #GDP #Gujarat


Can sovereign green bonds boost sustainable debt? Find out in our slides below, and discover more in our recent research on the development of sustainable corporate bond markets bit.ly/3UDx2rX #BISDataStories #BISStatistics #DataStories
Technological innovations have changed the way people pay. What are the latest global trends? Find out in our latest release of statistics on payments and financial market infrastructures: bis.org/statistics/pay… #BISDataStories #DataStories #Payments

The data shows me something very significant in my life. ❤️🩹 (it’s the locking history on my back deck door) #datastories


When you’re in a fancy French restaurant celebrating your birthday, but all you had in mind were, “the frosted glass makes the light behind looks like Gantt chart!” 😂 #datastories #dataviz #datafam


It’s official: Oracle Analytics has the best data storytelling capabilities on the market. Oracle Analytics customers can now bring analytics to life with data and analytics newsreaders using Synthesia’s AI generated avatars. See how: social.ora.cl/6013Oi4bJ #AI #ML #Datastories

Yellow💛 there! Red❤️ something that left you feeling blue💙? Well we can orange🧡 a silver🤍 of good news for you. If you're a little green💚 when it comes to WMATA and VRE, you should read this Data Story focused on these 2 agencies: ow.ly/FAlb50XcEpe #DRPT #DataStories


🎉🌟 We're thrilled to announce the winners of the Datastories Blogging Contest by @CleanlabAI ! Congratulations to: Your dedication and hardwork has paid off! Check out their amazing entries: datastories.konfhub.com/#winners #DataStories #Winners #BloggingContest #Congratulations


What share of credit default swaps are centrally cleared? Find out in the latest release of #BISStatistics on over-the-counter derivatives bis.org/publ/otc_hy231… #BISDataStories #DataStories

#datastories #gigeconomy More than 1 in 2 gig workers in India are of the opinion that their work environment makes it challenging to opt for upskilling or reskilling. Even to find a new job, gig workers lack a conducive environment. Even though 80% of gig workers have access


📊💡 Data tells stories. We just help translate. Every spreadsheet holds potential, every database a revelation. It's why we love our work—seeing how insights impact real businesses. Thanks, Jeff. Your words fuel our passion to push data's boundaries. #DataStories #PowerBI


What’s the most valuable insight you’ve ever gotten from your data? InsightCores.com #awscloud #InsightCores #DataStories


"IRYS, 데이터가 스스로 이야기를 짜는 구조" 🧵 데이터는 언제나 조각으로 남습니다. 한 줄의 로그, 하나의 트랜잭션, 한 번의 업로드. 그러나 그 조각들이 연결될 때, 비로소 ‘이야기’가 만들어지죠. @irys_xyz #NarrativeArchitecture #DataStories

Yellow💛 there! Red❤️ something that left you feeling blue💙? Well we can orange🧡 a silver🤍 of good news for you. If you're a little green💚 when it comes to WMATA and VRE, you should read this Data Story focused on these 2 agencies: ow.ly/FAlb50XcEpe #DRPT #DataStories

Every data point tells a story! At Flatix, data helps us understand the market, make smarter decisions & predict what’s next. Join our new series with the Flatix Data Analyst! #FlatixInsights #DataStories #RealEstateAnalytics #Data #Analytics #Interview #Flatix

🔍 Every number hides a story. We help you find it—and act on it. 📈📖 #DataStories #Level60Consulting #BusinessIntelligence #SmartInsights #DataDriven


What’s the comms strategy of a data‑platform? It’s transparency. Use cases. Show how Covalent powers AI agents, wallets, RWAs. Contribute content that teaches & inspires. Leaders in this space are going to get noticed. #Covalent #DataStories #Web3Growth

@Giverep’s live demo of impact trackers! See how AI turns data into stories—understand your impact. #ImpactTrackerDemo #DataStories
Want to take a fare free ride through Virginia's FY25 transit ridership data? Be sure to read this month's Data Story, which focuses on key stops along Virginia's recent transit ridership journey: ow.ly/PvPC50WX4ol #DataStories #DRPT


Mini-story: Once fed my AI bad data from a shady crypto API. It hallucinated trends that weren't there. Like a bad acid trip for algorithms. Always verify sources! #DataStories

Data can tell two different stories: Real BEHAVIOR might differ from those influenced by INCENTIVE. For RELIABLE DATA, combining probabilistic and deterministic is key. Picked this up from @ConsumerFi's video , super insightful!😊 #ConsumerFi #DataStories x.com/JonHook/status…


Here is how you can use data to piece together a compelling story. bit.ly/45uP7ym #datastories #storytellingdata #communicatingdata #datacommunication #storytellingtips #visualdata #strategiccommunication #datajournalism #narrativedata #digitalstorytelling


Storytelling with data? Unstoppable. Numbers prove, stories persuade. Combine them to move people to action. @PlayWildcard #DataStories

What’s your favorite data-driven decision that turned into a nostalgia moment? 📊✨ #DataStories #Nostalgia

See Giverep’s impact in charts, graphs, and stories. Our blockchain data tells a powerful tale. @Giverep #DataStories
A new data story all about rail in Virginia? That tracks. 🚆 Check out this month's data story to learn more about programs that take trucks off the road 🚛➡️🛤️ to better your ride. 🚗 #DataStories #DRPT Read it here: ow.ly/4mEv50Wq65N


💡 Dados não contam histórias, pessoas contam. Engenharia de dados é a ponte entre bits e narrativas humanas que mudam decisões e negócios. Quer impacto real? Foque na interpretação antes do pipeline. #EngenhariaDeDados #DataStories #ImpactoTech

In this video, Christine Jiang covers how to turn “just a graph” into a story that clicks with teammates, and stakeholders #datastories Join Our New Data in Education Community to watch the full video - lac.circle.so/join?invitatio…


Can AI explain why your customers stopped buying? Not without you. bit.ly/3HDk9dB #AIlimitations #DataStories #GenerativeAI #DataJobs #TechTruth
generative-ai-in-bi.blogspot.com
Could Generative AI Replace Data Analysts Without Bias?
Will generative AI replace data analysts or redefine their roles? Discover what the future of data work looks like in an AI-driven era.
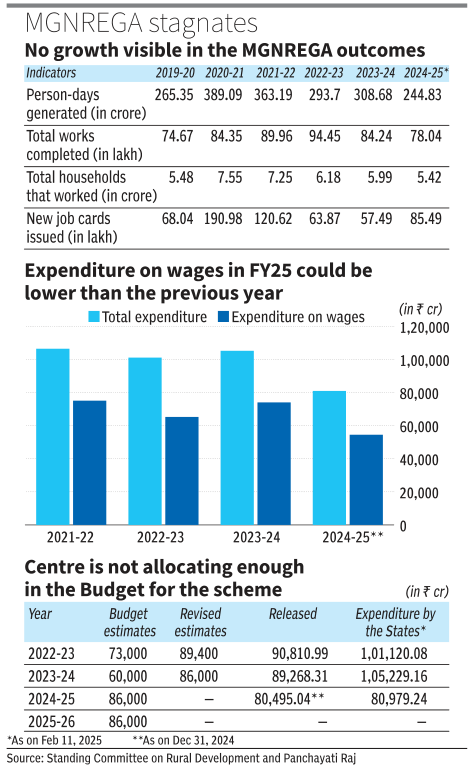
Budget flatlines, wages stagnate: Is MGNREGA failing in its basic objective? thehindubusinessline.com/data-stories/d… #MGNREGA #RadheshyamJadhav #DataStories #Businessline #Wages


"IRYS, 데이터가 스스로 이야기를 짜는 구조" 🧵 데이터는 언제나 조각으로 남습니다. 한 줄의 로그, 하나의 트랜잭션, 한 번의 업로드. 그러나 그 조각들이 연결될 때, 비로소 ‘이야기’가 만들어지죠. @irys_xyz #NarrativeArchitecture #DataStories

Behind every statistic is a story waiting to be told🌍 This World Statistics Day, celebrate the data that drives change, inspires decisions, and shapes our world. Let’s turn numbers into narrative. #WorldStatisticsDay #DataStories #jisgroupofinstitutions #jisgroup

🔍 Every number hides a story. We help you find it—and act on it. 📈📖 #DataStories #Level60Consulting #BusinessIntelligence #SmartInsights #DataDriven


Here is how you can use data to piece together a compelling story. bit.ly/45uP7ym #datastories #storytellingdata #communicatingdata #datacommunication #storytellingtips #visualdata #strategiccommunication #datajournalism #narrativedata #digitalstorytelling

Unlock the power of data #StoryTelling with Quantum! Check out the image below to see how data stories can boost your brand, and stay tuned for our success stories! #DataStories #Marketing


Word 'happiness' in books from 1800-2022 reveals a surprising story. The word declined through most of the 19th century, then experienced waves of interest during key historical periods. In recent decades, happiness has become a more frequent topic. #DataStories"


"Unleashing the Potential of Data: Why Telling Compelling Stories is Crucial in Making Sense of Your Data Insights" #DataStories #DataVisualization #DataInsights #DataAnalysis #StorytellingWithData #DataScience #DataDriven #DataMeaning #DataPresentation #DataNarratives

🚀 Exciting News! The #DataStories Blogging Contest by @CleanlabAI is here! Get ready to showcase your #AI & #DataQuality knowledge. Submit your blogs datastories.konfhub.com to win exciting prizes. #data #artificialintelligence #machinelearning #blog #bloggers

If you earn ₹16L+, you are among the Top 1% earners in India. Here's what's needed in other countries 👇🏼 Figures adjusted for purchasing power parity. #datastories
#Datastories that inspire action are accessible and accurate. 🔹 Use intuitive tools 🔹 Provide alt text 🔹 Avoid misleading visuals 🔹 Explain complex concepts Is your #data hitting the mark? #DataManagement #DataStrategy #Data #AI #DataStorytelling

#DataStories have been a focus of @pegfitz101 & I's work in #ViSN this year. We have presented individualised infographics to schools as part of our visits. We are immensely proud of our results continuing to improve every year!

YouTube Launches ‘Data Stories’ For First-Day Video Metrics ~ searchenginejournal.com/youtube-launch… by @MattGSouthern #YouTube #DataStories via @sejournal

Ready to literally tell a better story with data? Oracle Analytics customers can now bring analytics to life with data and analytics newsreaders using Synthesia’s AI generated avatars. See how: social.ora.cl/6015P5gCJ #AI #ML #Datastories

In just 2 days, we are releasing an interactive website where you can analyze over 60 socioeconomic indicators to explore the link between a community’s well-being and their justice footprint! #TheRightInvestment #DataStories
📢 Dive into the world of #DataStories by @CleanlabAI and unleash your writing prowess! 🚀 ✨ Participate in our blog contest for a chance to snag incredible prizes, including a Nintendo Switch, Sony headphones, or Amazon vouchers. 🏆 datastories.konfhub.com #AIBlogContest

As demand for reservation in jobs and employment is on the rise, the high unemployment rates among educated SC and ST youths and their predominant engagement in low-paid, informal work highlight persistent systemic barriers #employment #businessline #datastories #radheshyamjadhav

🎉🌟 We're thrilled to announce the winners of the Datastories Blogging Contest by @CleanlabAI ! Congratulations to: Your dedication and hardwork has paid off! Check out their amazing entries: datastories.konfhub.com/#winners #DataStories #Winners #BloggingContest #Congratulations
Something went wrong.
Something went wrong.
United States Trends
- 1. #WWERaw 78.6K posts
- 2. Packers 52.1K posts
- 3. Packers 52.1K posts
- 4. Jordan Love 7,188 posts
- 5. John Cena 73.4K posts
- 6. Jalen 17.2K posts
- 7. #GoPackGo 5,393 posts
- 8. #RawOnNetflix 1,981 posts
- 9. Jenkins 3,318 posts
- 10. Kevin Patullo 1,035 posts
- 11. Grand Slam Champion 22.5K posts
- 12. Desmond Bane 1,862 posts
- 13. Matt LaFleur 1,395 posts
- 14. Lane Johnson 1,170 posts
- 15. #MondayNightFootball 1,156 posts
- 16. Green Bay 12.3K posts
- 17. Nikki Bella 3,075 posts
- 18. Cam Whitmore 1,464 posts
- 19. Jaelan Phillips 1,451 posts
- 20. #PHIvsGB 1,391 posts