#plotlystudio ผลการค้นหา

Just vibecoded an entire dashboard 🤯! Can’t believe the era where you can build fully functional data apps just by prompting is here. Shoutout to Plotly Studio—upload a dataset, describe your vision, and watch it build the whole thing. Absolute game-changer. 🚀 #PlotlyStudio


How does climate & different economies evolve under different scenarios & policies? I tried playing around with Plotly Studio & exploring insights from NGFS Transition Pathways Dataset. #plotlystudio #vibeanalytics
How does changing training configurations impact energy consumption? I spent some time exploring Butter-E dataset with Plotly Studio: #PlotlyStudio #vibeanalytics

🌍✨ Excited to share Climate & Air Quality Monitor — our hackathon project that tracks real-time climate & pollution data with IoT sensors + AI insights. Breathe better. Live smarter. 🌱💨…7ca-4d31-9a03-2dd6562c9870.plotly.app #PlotlyStudio

We chase success. But what if it's a trap? 🤯 I analyzed decades of global data and found the "Wellbeing Paradox": where more education sometimes leads to LESS happiness. …01a-4fa5-8f63-0655d14628f3.plotly.app #PlotlyStudio #plotly #hackathon

CorpWell Trends: AI-powered HR well-being dashboard Built for the #PlotlyStudio challenge! Tracks stress, satisfaction & more using OECD data. Features filters, heatmaps & tips to reduce burnout. Deployed on Plotly Cloud: …4c7-448b-ba68-30a9188473dc.plotly.app #DataViz #HRTech #WellBeing


Just launched 🌍 OECD Well-Being Playground an interactive data app built with #PlotlyStudio to explore how countries live, feel, and thrive over time. Play with maps, trends, and comparisons across health, education …119-4816-837d-e87f7a1666fb.plotly.app

🌍 Excited to share my new data app exploring the OECD Well-Being Dataset! 📷 Dive into insights on global well-being and discover trends that matter. Check it out and let’s explore together! 📷…d02-4a6d-8380-64adeefb4a97.plotly.app] #PlotlyStudio

Excited to share my hackathon project 🌍 Urban Wellbeing Dashboard! Explore how access to green transport connects to urban wellbeing: …2d6-45c4-92c0-8ac1cec0377d.plotly.app #PlotlyStudio

🔬 Transform breast biopsy data into insights! Our interactive app visualizes FNA features to spot benign vs malignant tumors fast 🩺📊. Sankey, scatter, radar & summary cards make complex data simple & actionable. #PlotlyStudio #HealthcareAnalytics …f96-48b5-bb16-c88156326f48.plotly.app

Hi! I just designed a dashboard for Student Performance Analytics using Plotly Studio by @plotlygraphs and was amazed by the amount of features it offers. Do check it out on the below links! #plotlyStudio Dashboard: …9c3-418a-9295-fc44958b261b.plotly.app Demo: youtu.be/8L2vd5Lt5AY?si…

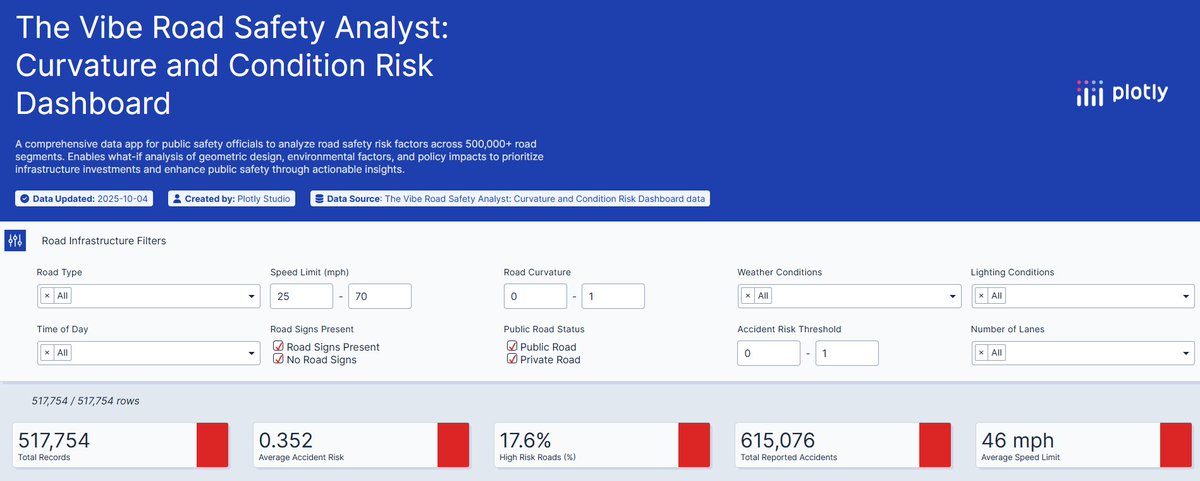
The Road Safety Analyst: Curvature & Condition Risk Dashboard uses @plotlygraphs to turn 500k+ road records into actionable public safety insights. See how speed, curvature, and weather drive accident risk for infrastructure planning. 👉 …02a-4250-b81f-3532418e4ac9.plotly.app #PlotlyStudio


Hey! so there is this tool which helps you create all kind of graphs. Its #plotlyStudio

Excited to share my interactive data app ‘OECD Well-Being Explorer’, built with #PlotlyStudio for the Plotly Analytics Vibe-a-Thon! Explore 11 dimensions of well- being across 40+ countries with interactive charts and filters. Check it out: …227-46b2-aa4a-5a9ddc0355f0.plotly.app

Used Plotly Studio to spin up an interactive dashboard in no time. Demo link: …bb6-4296-9c1a-51dc8836d472.plotly.app #PlotlyStudio
Participating in Plotly Analytics Vibe-a-Thon! An interactive app that uses sensor data to visualize fruit ripening stages, detect spoilage, and uncover chemical patterns with AI-powered insights. Fruit Ripeness Explorer 👉 […be7-4da1-a166-ec87d279a6ce.plotly.app] #PlotlyStudio #AIAnalytics

🚀 Just published my data app with #Plotly Exploring insights with fast, interactive, and beautiful analytics built on [OECD Wellbeing dataset ]. Check it out here 👉 …54e-4744-bf60-945b56e175b1.plotly.app #PlotlyStudio #Analytics #AI @plotly @plotlygraphs
![vc_epic's tweet image. 🚀 Just published my data app with #Plotly
Exploring insights with fast, interactive, and beautiful analytics built on [OECD Wellbeing dataset ].
Check it out here 👉 …54e-4744-bf60-945b56e175b1.plotly.app
#PlotlyStudio
#Analytics #AI
@plotly @plotlygraphs](https://pbs.twimg.com/media/G2QkpY1XgAAUWeJ.jpg)
Amazed at how quickly and accurately Plotly Studio bridges the gap of idea > dashboard. Here's the live dashboard: …692-427f-bbeb-f775aeb517d6.plotly.app #PlotlyStudio

Just launched The Living Trust Graph — my #PlotlyStudio #Vibeathon data app 🌍 Visualizing how trust evolves through Mint → Verify → Attest → Seal across Forex, Insurance & Universal corridors. Try it 👉 …e6a-448a-b70a-be52db4e201b.plotly.app #Plotly #Dash #DataViz #Analytics
Just launched 🌍 OECD Well-Being Playground an interactive data app built with #PlotlyStudio to explore how countries live, feel, and thrive over time. Play with maps, trends, and comparisons across health, education …119-4816-837d-e87f7a1666fb.plotly.app
Amazed at how quickly and accurately Plotly Studio bridges the gap of idea > dashboard. Here's the live dashboard: …692-427f-bbeb-f775aeb517d6.plotly.app #PlotlyStudio
How does changing training configurations impact energy consumption? I spent some time exploring Butter-E dataset with Plotly Studio: #PlotlyStudio #vibeanalytics

Took part in @plotlygraphs Vibe-a-thon over the weekend and here is my submission. A dashboard for post-recovery statistical analysis with interactive scatter plots, bar graphs and percentile graphs. Link: …ff8-4182-9d8f-41e14d602a74.plotly.app #PlotlyStudio #plotlyStudio
Loved getting hands-on with Plotly Studio and creating a dashboard through prompts with minimal code updates.. explore the dashboard here: …b9b-42f8-94f9-f842bcb5a61f.plotly.app #plotlystudio
How does climate & different economies evolve under different scenarios & policies? I tried playing around with Plotly Studio & exploring insights from NGFS Transition Pathways Dataset. #plotlystudio #vibeanalytics
The Road Safety Analyst: Curvature & Condition Risk Dashboard uses @plotlygraphs to turn 500k+ road records into actionable public safety insights. See how speed, curvature, and weather drive accident risk for infrastructure planning. 👉 …02a-4250-b81f-3532418e4ac9.plotly.app #PlotlyStudio
🌍 Excited to share my new data app exploring the OECD Well-Being Dataset! 📷 Dive into insights on global well-being and discover trends that matter. Check it out and let’s explore together! 📷…d02-4a6d-8380-64adeefb4a97.plotly.app] #PlotlyStudio
Excited to share my hackathon project 🌍 Urban Wellbeing Dashboard! Explore how access to green transport connects to urban wellbeing: …2d6-45c4-92c0-8ac1cec0377d.plotly.app #PlotlyStudio
We chase success. But what if it's a trap? 🤯 I analyzed decades of global data and found the "Wellbeing Paradox": where more education sometimes leads to LESS happiness. …01a-4fa5-8f63-0655d14628f3.plotly.app #PlotlyStudio #plotly #hackathon
Hi! I just designed a dashboard for Student Performance Analytics using Plotly Studio by @plotlygraphs and was amazed by the amount of features it offers. Do check it out on the below links! #plotlyStudio Dashboard: …9c3-418a-9295-fc44958b261b.plotly.app Demo: youtu.be/8L2vd5Lt5AY?si…
🌍✨ Excited to share Climate & Air Quality Monitor — our hackathon project that tracks real-time climate & pollution data with IoT sensors + AI insights. Breathe better. Live smarter. 🌱💨…7ca-4d31-9a03-2dd6562c9870.plotly.app #PlotlyStudio
Participating in Plotly Analytics Vibe-a-Thon! An interactive app that uses sensor data to visualize fruit ripening stages, detect spoilage, and uncover chemical patterns with AI-powered insights. Fruit Ripeness Explorer 👉 […be7-4da1-a166-ec87d279a6ce.plotly.app] #PlotlyStudio #AIAnalytics
Used Plotly Studio to spin up an interactive dashboard in no time. Demo link: …bb6-4296-9c1a-51dc8836d472.plotly.app #PlotlyStudio

🧪 Elements animated by year of discovery. ✨ Built in 3 min from a dataset and prompt! 🤯 ⚙️ All code and spec files generated by Plotly Studio. Try it: plotly.com/studio #Chemistry #Python #PlotlyStudio
Just vibecoded an entire dashboard 🤯! Can’t believe the era where you can build fully functional data apps just by prompting is here. Shoutout to Plotly Studio—upload a dataset, describe your vision, and watch it build the whole thing. Absolute game-changer. 🚀 #PlotlyStudio
CorpWell Trends: AI-powered HR well-being dashboard Built for the #PlotlyStudio challenge! Tracks stress, satisfaction & more using OECD data. Features filters, heatmaps & tips to reduce burnout. Deployed on Plotly Cloud: …4c7-448b-ba68-30a9188473dc.plotly.app #DataViz #HRTech #WellBeing
The Road Safety Analyst: Curvature & Condition Risk Dashboard uses @plotlygraphs to turn 500k+ road records into actionable public safety insights. See how speed, curvature, and weather drive accident risk for infrastructure planning. 👉 …02a-4250-b81f-3532418e4ac9.plotly.app #PlotlyStudio
🚀 Just published my data app with #Plotly Exploring insights with fast, interactive, and beautiful analytics built on [OECD Wellbeing dataset ]. Check it out here 👉 …54e-4744-bf60-945b56e175b1.plotly.app #PlotlyStudio #Analytics #AI @plotly @plotlygraphs
Something went wrong.
Something went wrong.
United States Trends
- 1. Chargers 36K posts
- 2. Vikings 24.9K posts
- 3. #911onABC 10K posts
- 4. Herbert 9,783 posts
- 5. #Skol 3,098 posts
- 6. #TNFonPrime 1,477 posts
- 7. Dallas Turner N/A
- 8. #BoltUp 2,094 posts
- 9. Oronde Gadsden 2,305 posts
- 10. Rempe 2,956 posts
- 11. Logan Cooley N/A
- 12. $UNI 1,747 posts
- 13. Isaiah Rodgers N/A
- 14. Pacers 11.9K posts
- 15. Vidal 7,734 posts
- 16. Athena 9,825 posts
- 17. #stlblues N/A
- 18. Becton N/A
- 19. Bannon 15.5K posts
- 20. Ben Kindel N/A