


Excel to Graphviz has just been recognized with a Community Choice award by SourceForge! @msexcel @Graphviz

Happy 10th birthday to the Relationship Visualizer spreadsheet! 🎉🥳🎂 Turning spreadsheets into stunning graphs has never been easier. Cheers to a decade of simplifying complex connections! Download it free & start visualizing! exceltographviz.com #Graphviz #Excel @msexcel
Excel to Graphviz Release 8.0 is here! Style design just got easier. Restore saved styles. New gallery controls and RGB color picking. New SQL connection pooling. Faster performance! MIT-licensed. Always free. sourceforge.net/projects/relat…
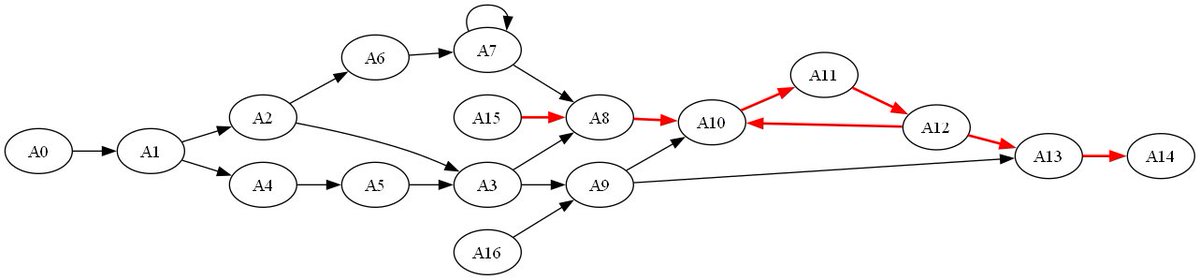
Big news! 'Excel to Graphviz' Version 7.2 is out, and it now supports recursive SQL queries. Perfect for creating organization charts, tracing family trees, or following the money. Download the latest version at sourceforge.net/projects/relat…


A new feature in version 7.0 captures and displays the messages emitted by the Graphviz dot command in a "console" worksheet. #graphviz #msexcel

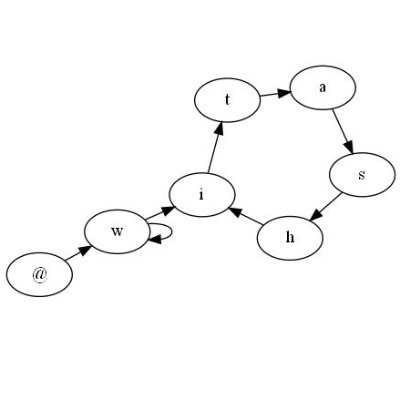
'Excel to Graphiz' now has launched its own website at (you guessed it) exceltographviz.com #Excel #Graphviz
Big new release! Adds auto-clustering to SQL results, SQL batching, and SVG postprocessing for edge animation. Download the new version of #Excel to #Graphviz at sourceforge.net/projects/relat…
New Release! 1) Style Designer enhancement to create solid-filled gradients 2) Accessibility enhancement to generate tooltips for clusters, nodes, and edges in SVG exports 3) Smaller Excel file size Download the new version of Excel to Graphviz at sourceforge.net/projects/relat…

New release adding more clickable graph attributes! Attributes in the 'Algorithm' group on the Graphviz tab now change based upon the layout chosen. Download the new version of Excel to Graphviz at sourceforge.net/projects/relat…

To name a few: d3.js spring layout for web / d3 integration; Excel to Graphviz for ease of data prep; UMAP, tSNE, Graphistry, LGL for scale; Gephi for UI; Tom Sawyer and yWorks for breadth and pro support. NodeXL for analysis. WebCoLA for nesting/constraints.
New Release - Metric units! Toggle between inches and millimeters. Download the new version of Excel to Graphviz at sourceforge.net/projects/relat… @msexcel @Graphviz (3/3)


United States 趋势
- 1. Carson Beck 3,483 posts
- 2. Vandy 12.4K posts
- 3. Miami 61.6K posts
- 4. Clemson 11.7K posts
- 5. Mario 64.8K posts
- 6. Jeremiah Smith 8,660 posts
- 7. Texas 117K posts
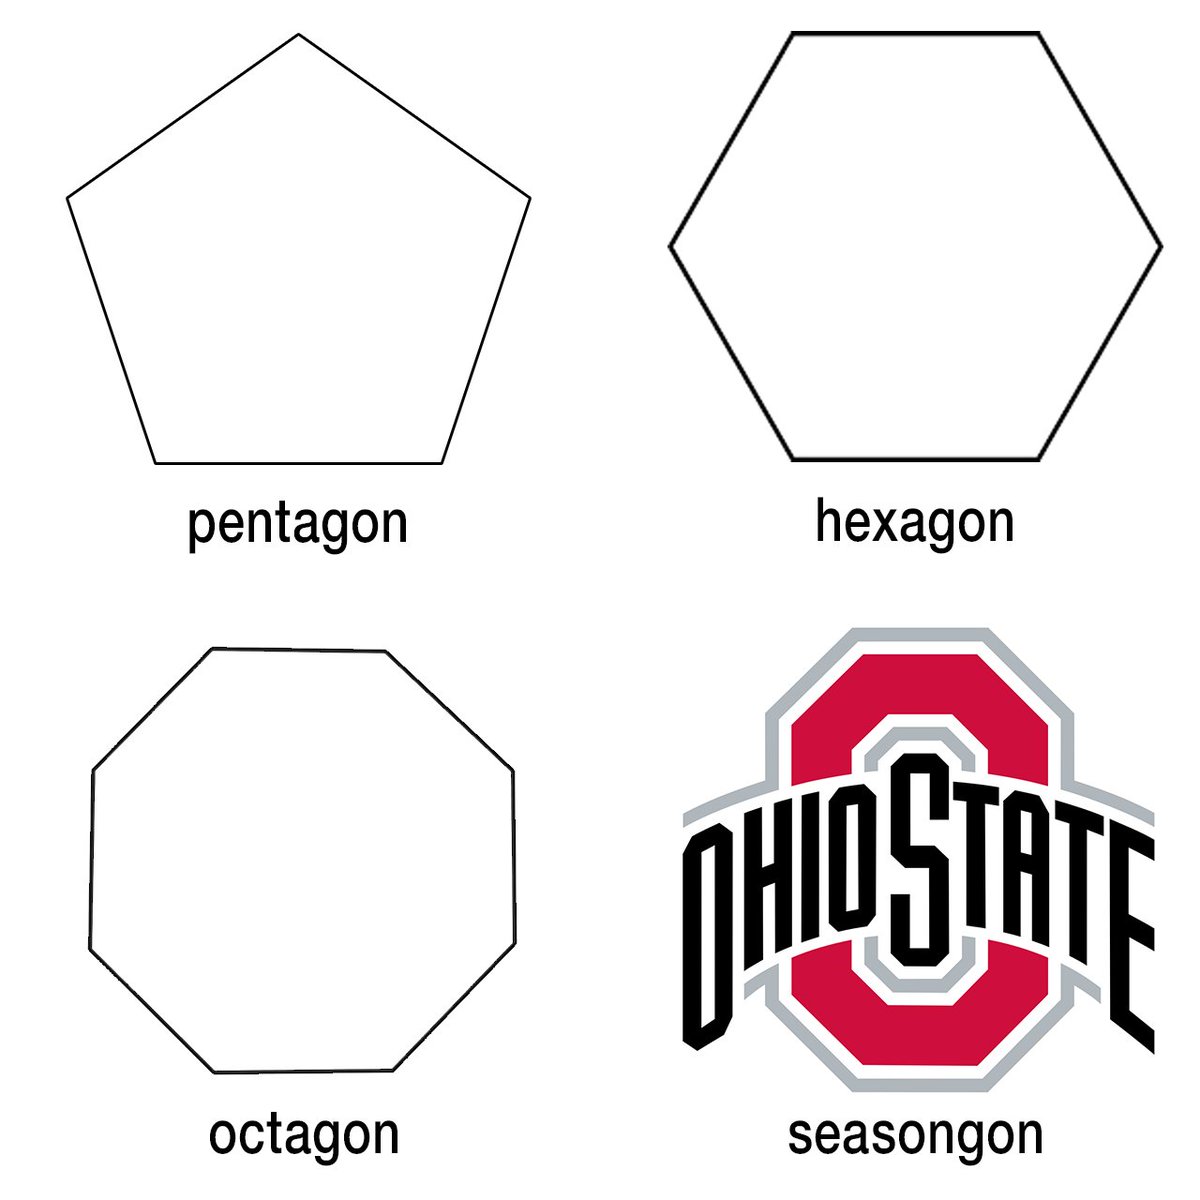
- 8. Ohio State 17.3K posts
- 9. Jeff Sims 1,162 posts
- 10. Vanderbilt 9,948 posts
- 11. Dawson 4,646 posts
- 12. #UFCVegas110 3,417 posts
- 13. Julian Sayin 6,743 posts
- 14. Dabo 2,801 posts
- 15. Pavia 4,501 posts
- 16. #HookEm 4,233 posts
- 17. Duke 20.1K posts
- 18. Caicedo 48.9K posts
- 19. Caleb Downs 1,438 posts
- 20. #iufb 1,184 posts


Something went wrong.
Something went wrong.