
Python Maps
@PythonMaps
Mapping the world with Python. Contact [email protected] Buy my book here - https://locatepress.com/book/pymaps
내가 좋아할 만한 콘텐츠


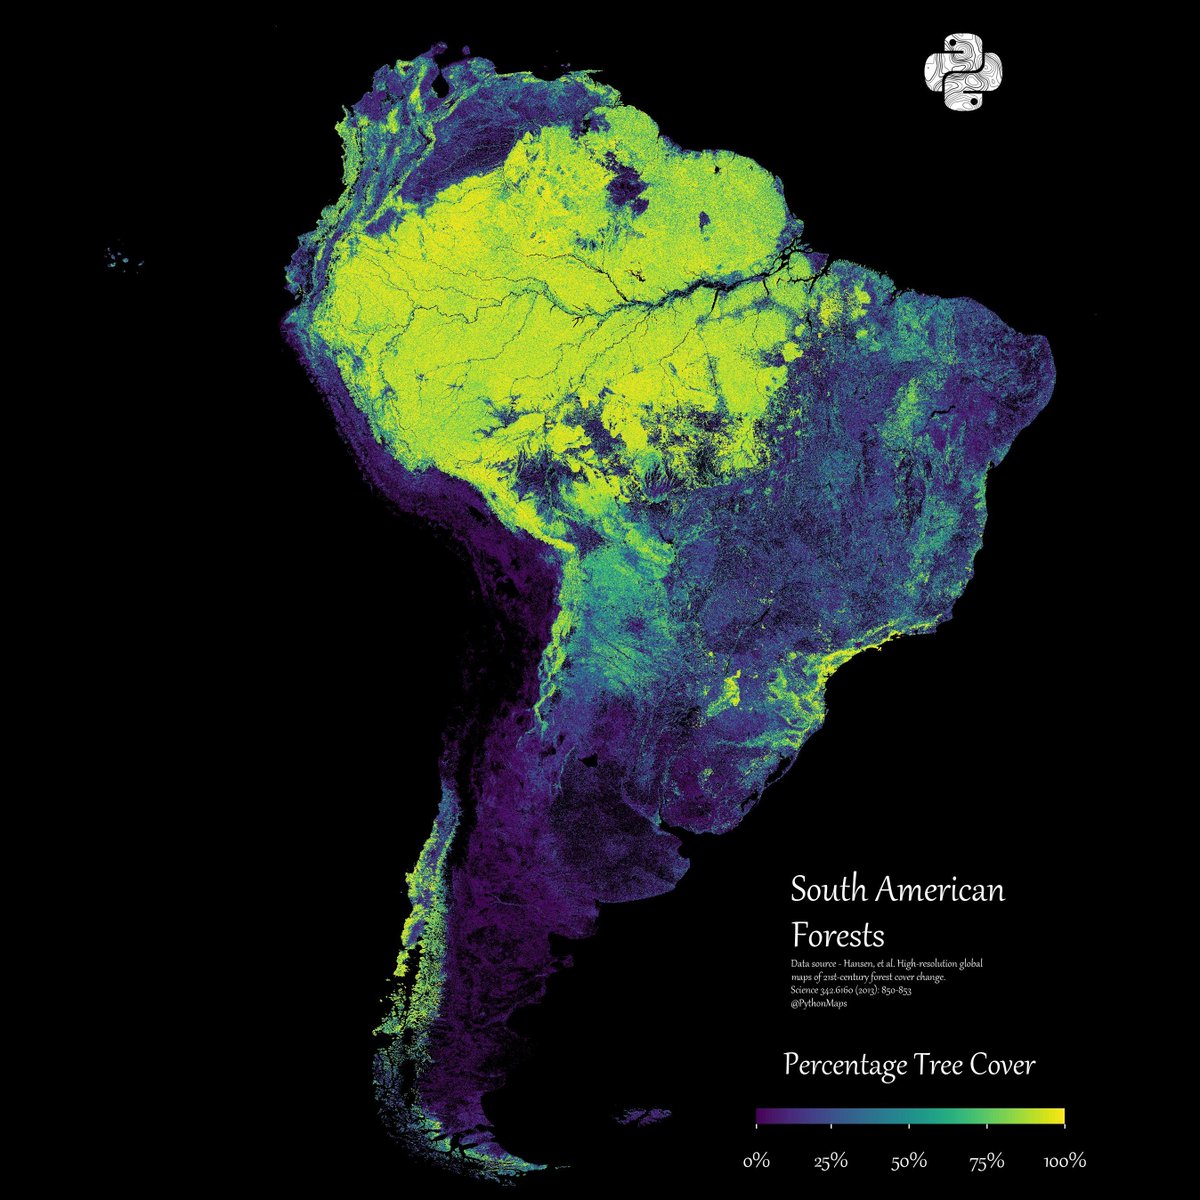
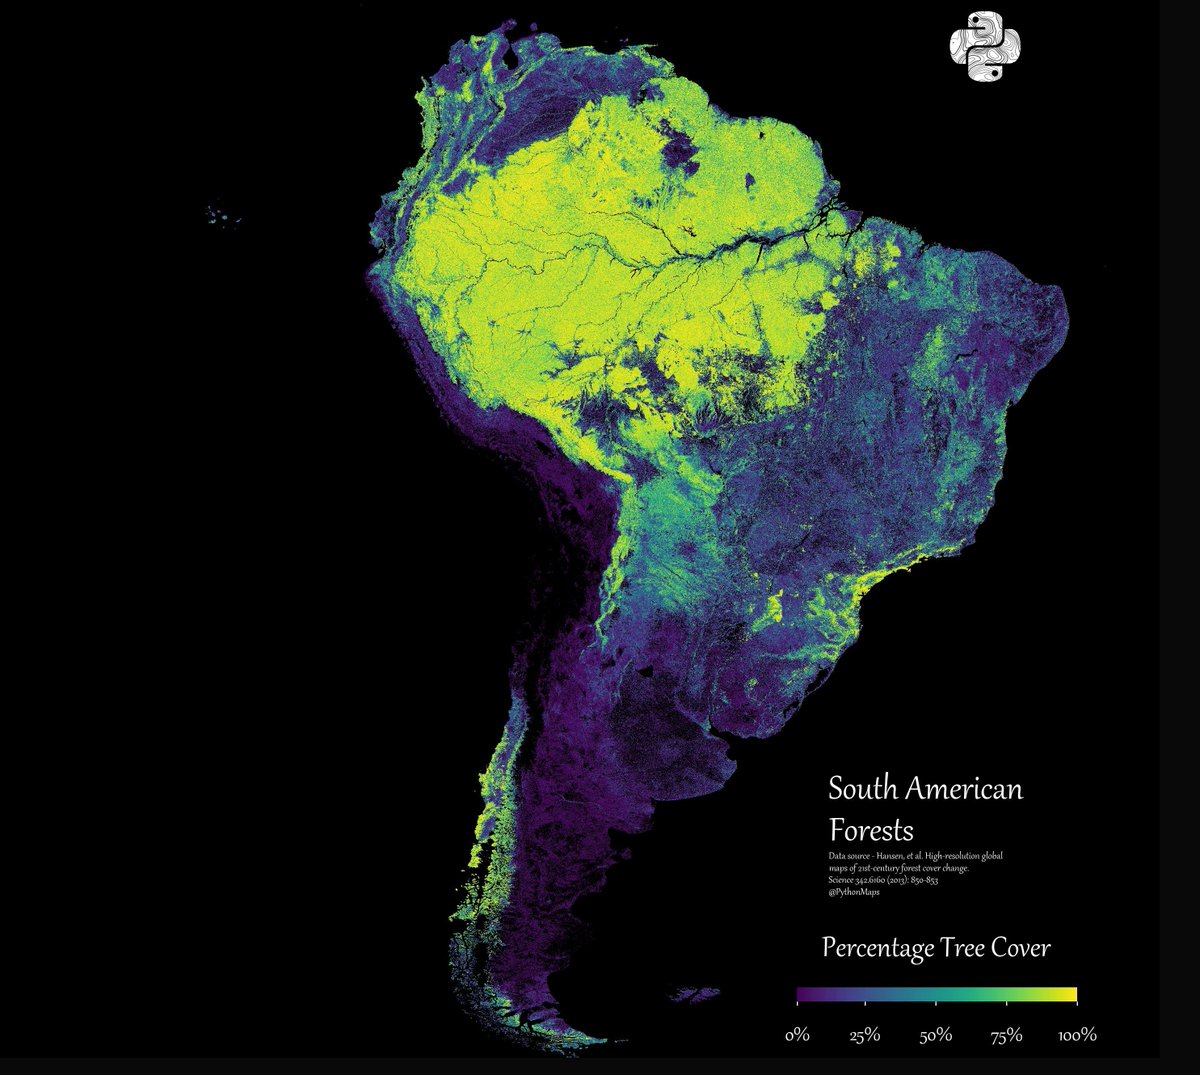
Ending 2023 with my favourite map. South American forests. See you next year!
Running a little bit behind. Day 25 of the #30DayMapChallenge - Hexagons - I have used the @KonturInc population density hexagons to generate this population density map of Southern Asia

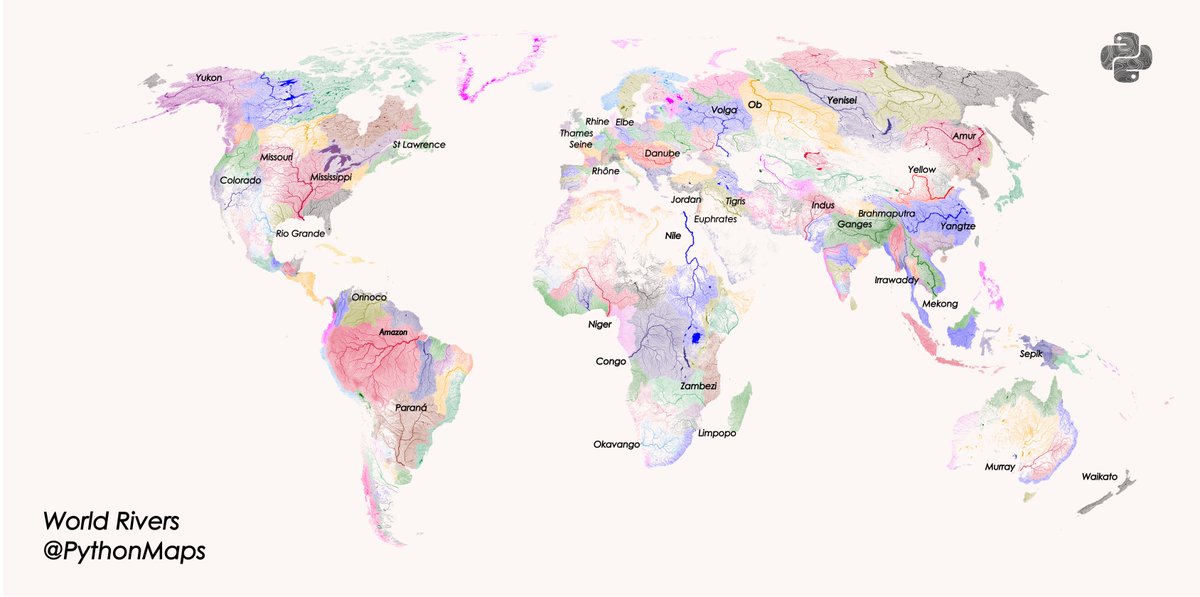
Day 24 of the #30DayMapChallenge - Places and their names - Here are the World's rivers with labels on some of the major ones.
Day 23 of the #30DayMapChallenge - Process - "Show how you make a map" - Well luckily, there is an entire book dedicated to how I make maps - get yours now locatepress.com/book/pymaps
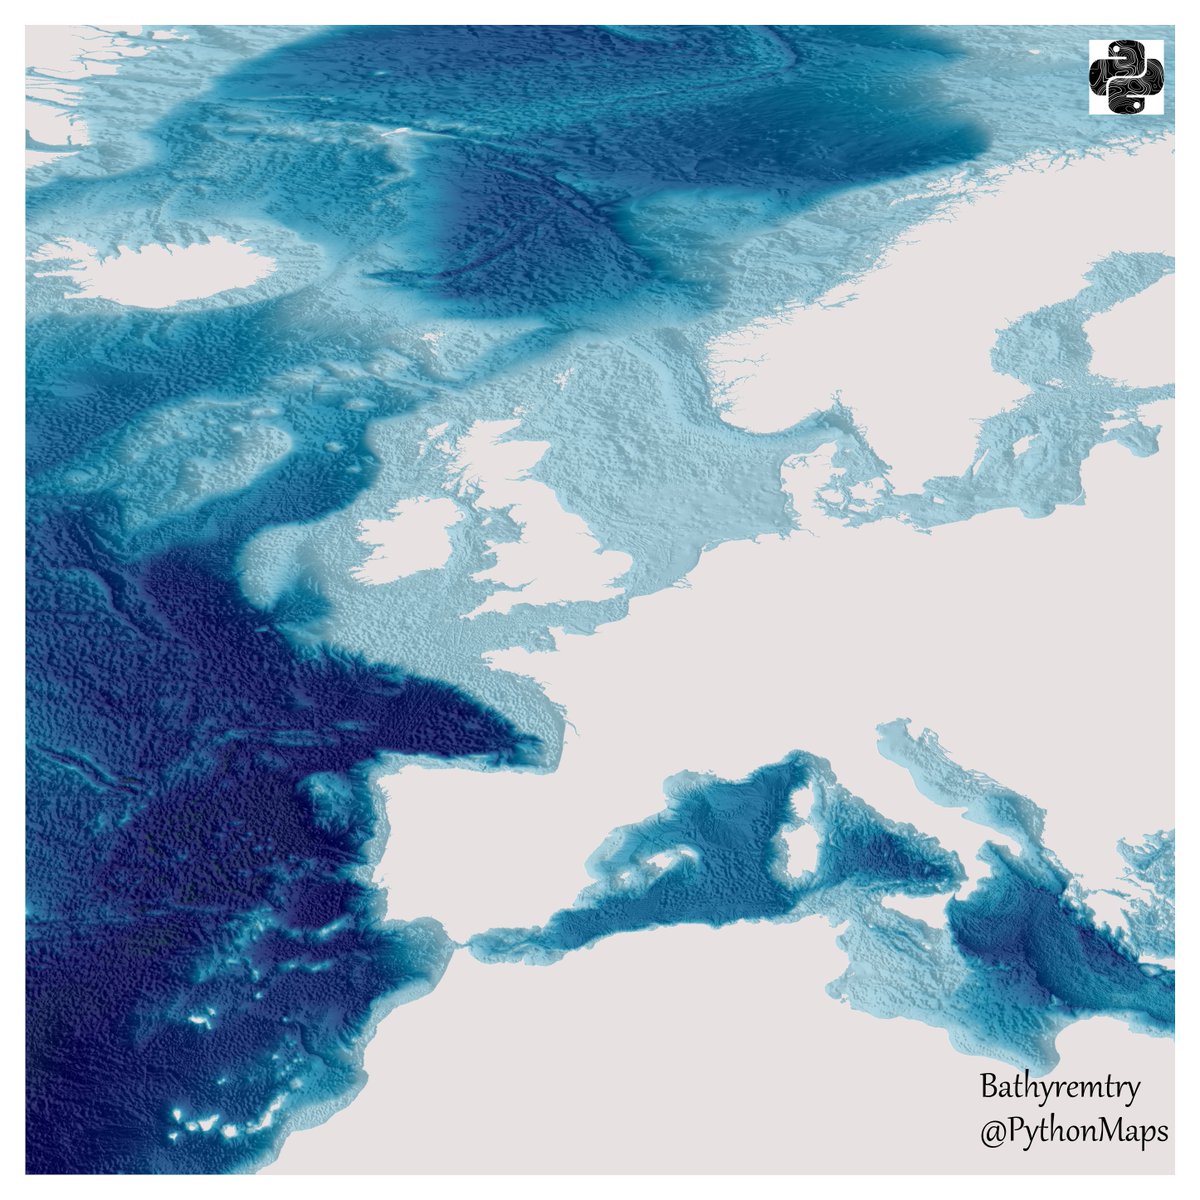
Day 22 of the #30DayMapChallenge - Natural Earth Data. I used the Ocean Bottom layer to make a Bathymetry map of Northern Europe.
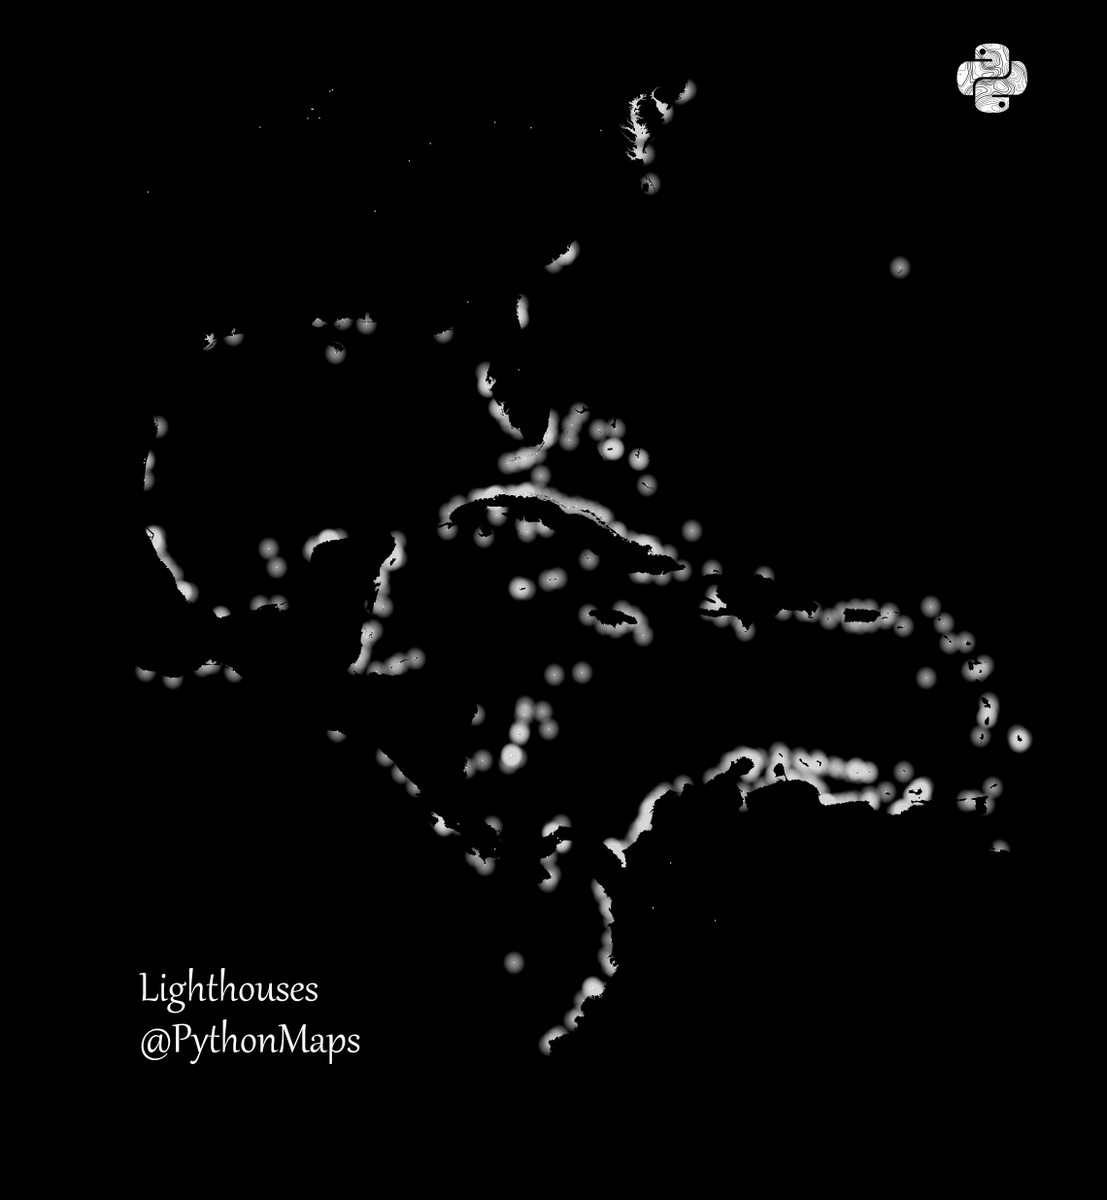
Day 21 of the #30DayMapChallenge - Icons - Use icons to highlight points of interest. Here are lighthouses of the Caribbean and Gulf of America. I used a few tricks to make the points look like they are shining out to sea.

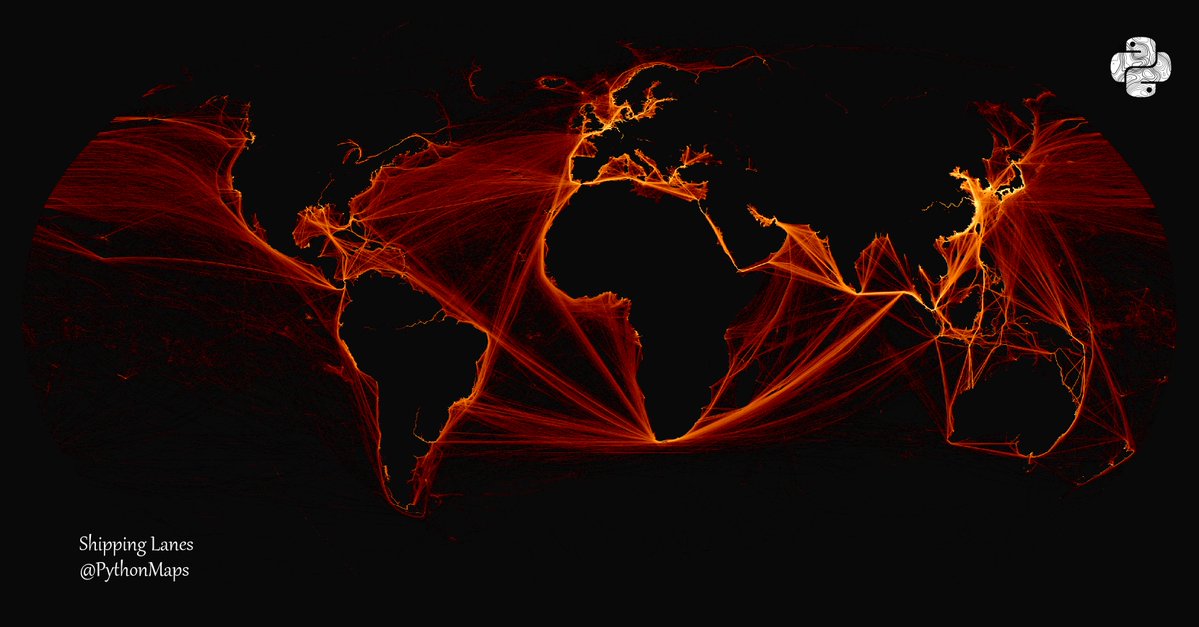
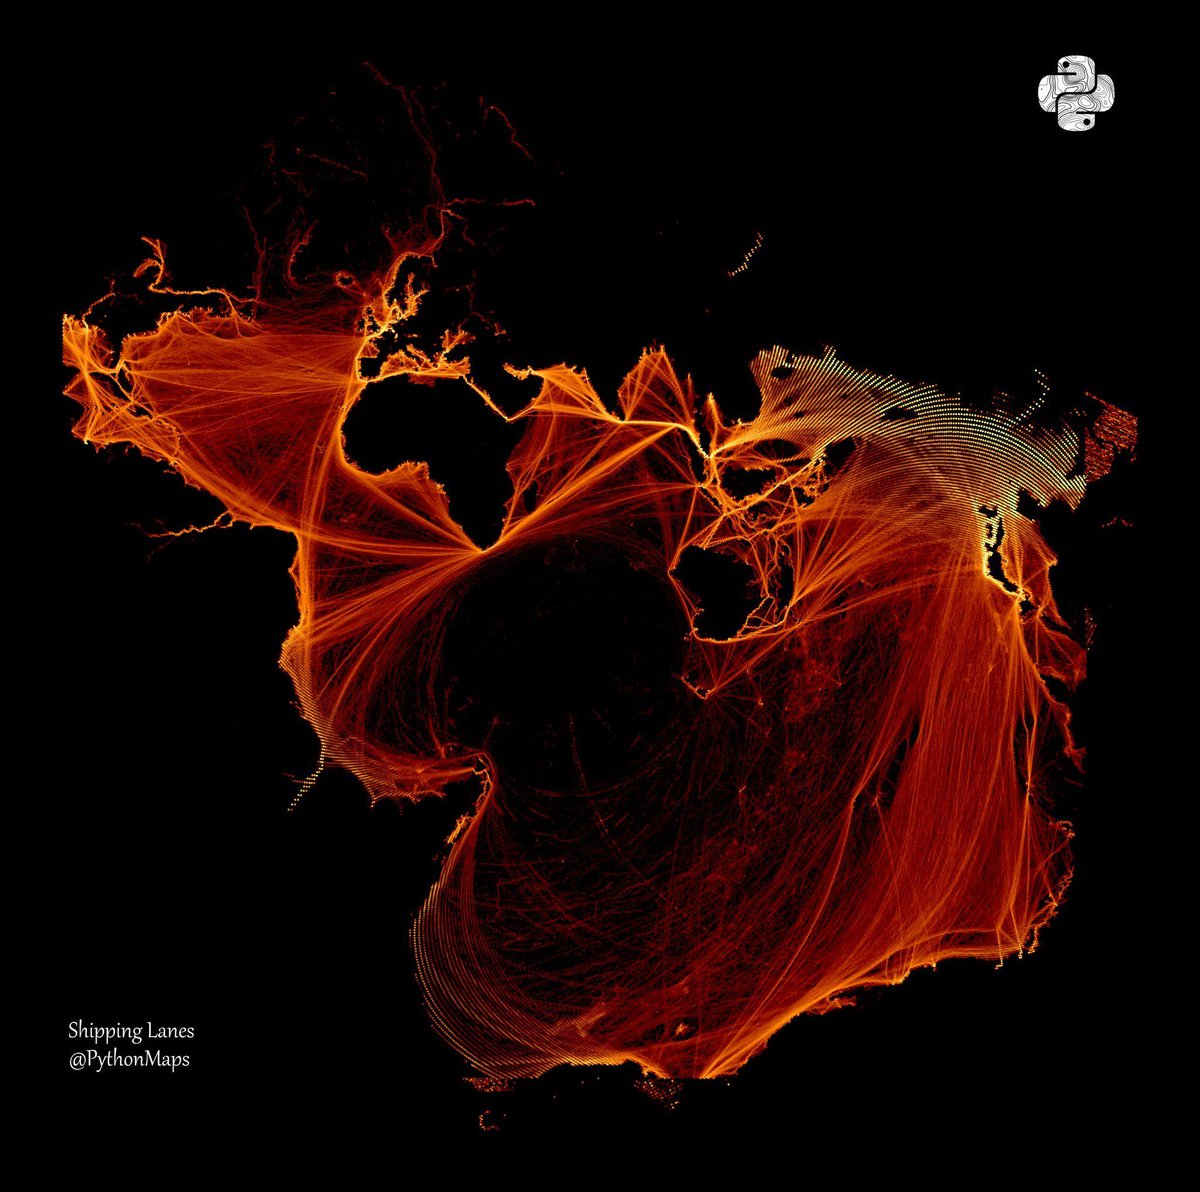
This visualization by @pythonmaps (a must follow account) shows global shipping lanes in the gorgeous ocean-centered Spillhaus projection. Extremely pleasing to look at!
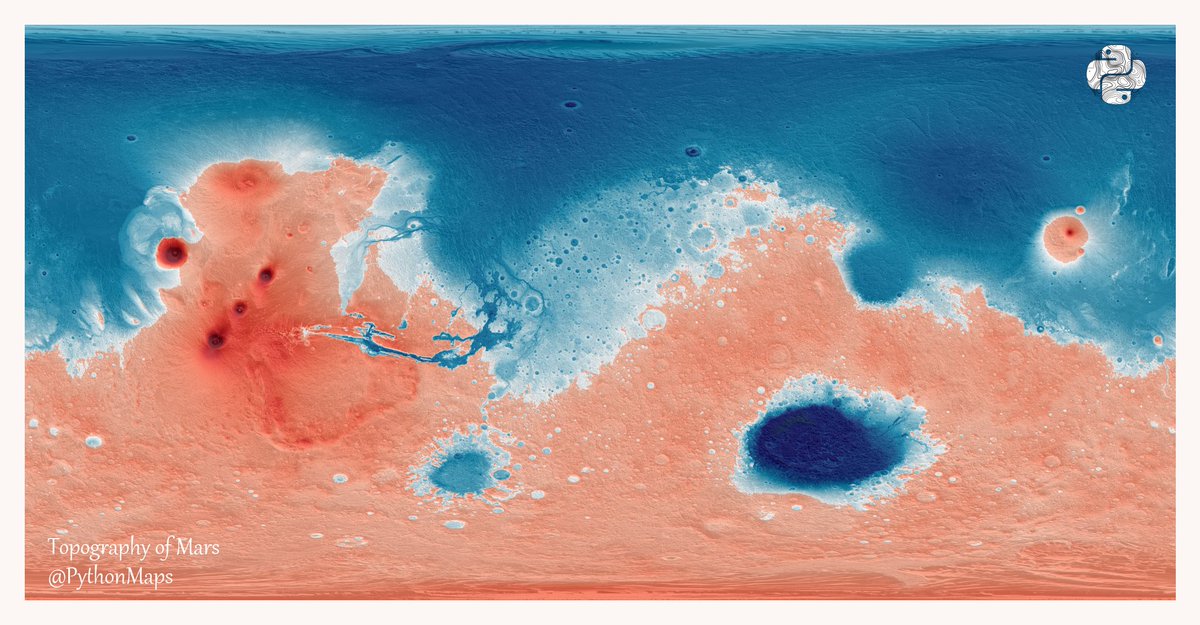
Day 18 of the #30DayMapChallenge - Out of this World. Here is a topographical map of Mars. I have added some hill shading and used a colourmap that simulates an ocean, proportionally equal in size to Earths.
Day 17 of the #30DayMapChallenge - New tool. It has been on my radar for a while so I tried out @datashader to visualise population density. These maps usually take minutes to render but with datashader it takes seconds.

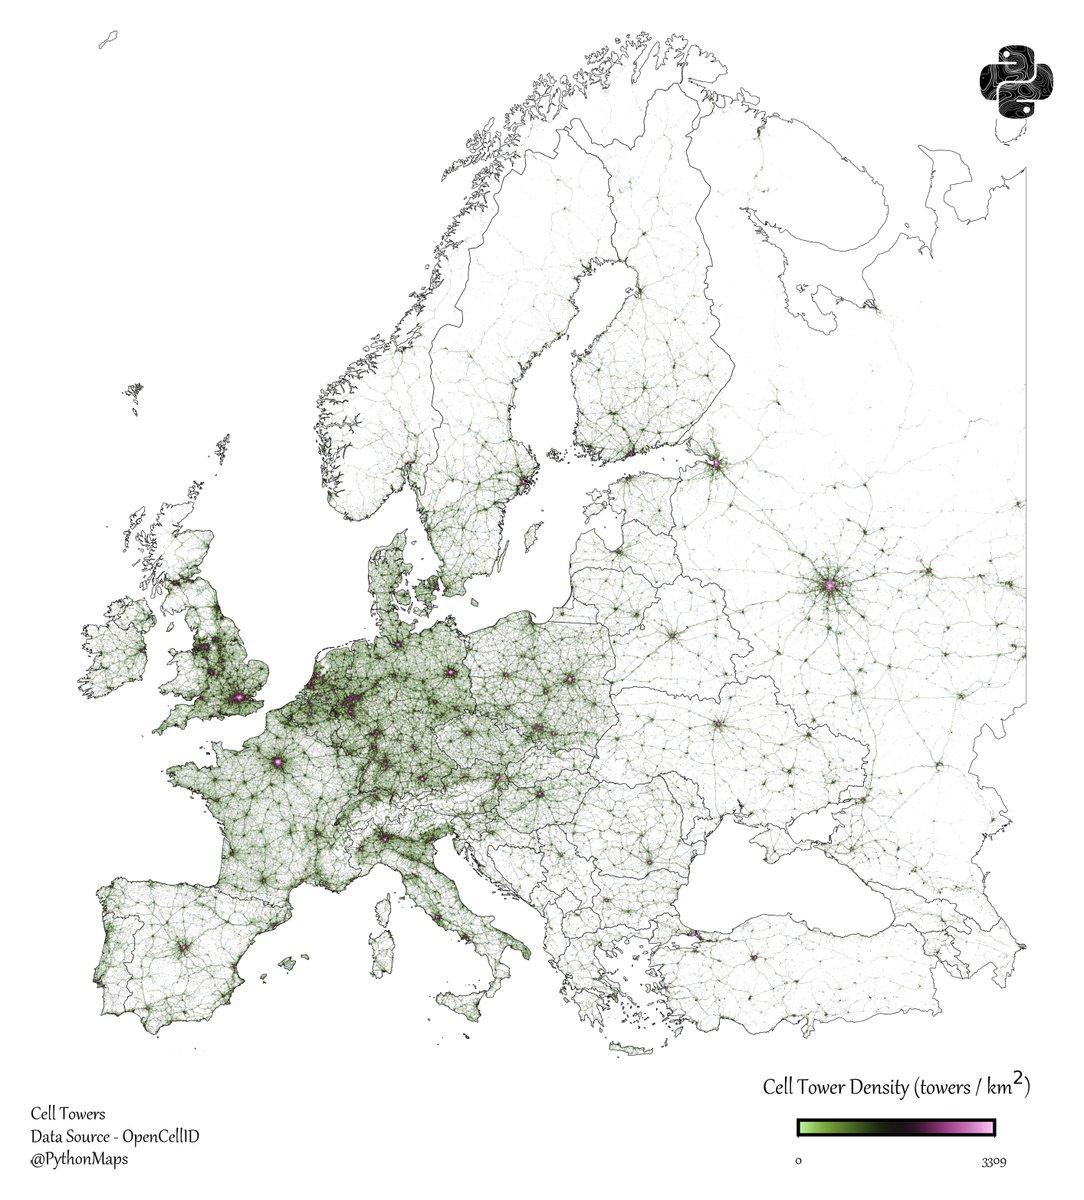
Day 16 of the #30DayMapChallenge - Cell - Here is a map of Cell tower density in Europe. Clearly this is just a population density map but gotta follow the theme.
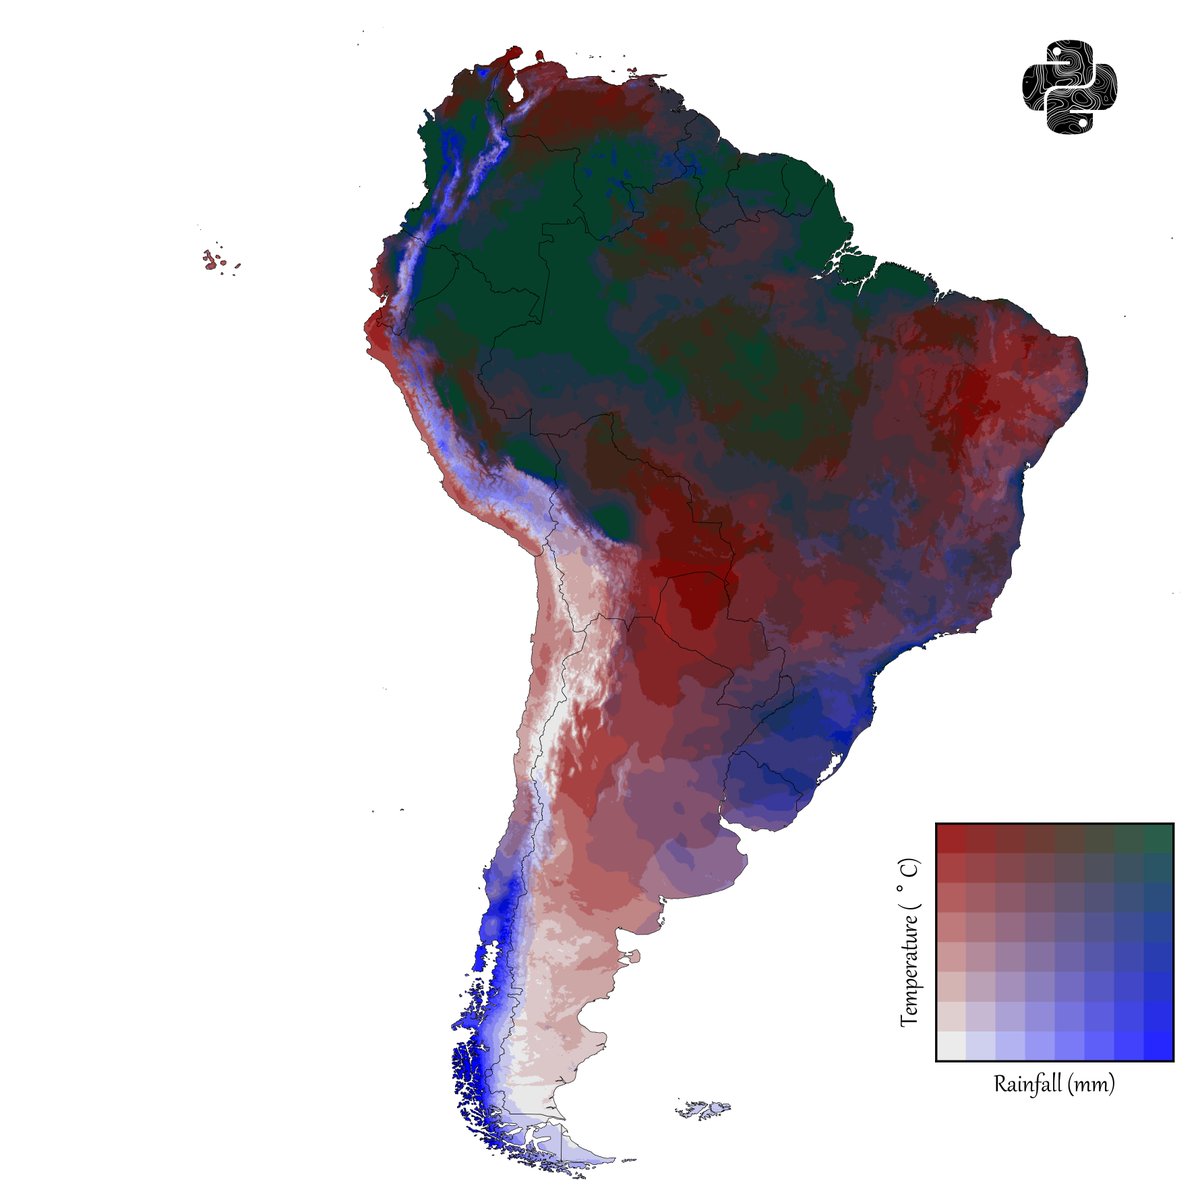
Day 13 of the #30DayMapChallenge — 10-minute map. Once I’ve made a particular type of map once, I can usually recreate it in about 10 minutes. This one’s a bivariate map — the style that probably took me the longest to learn the first time around. Rainfall vs Temperature in South…
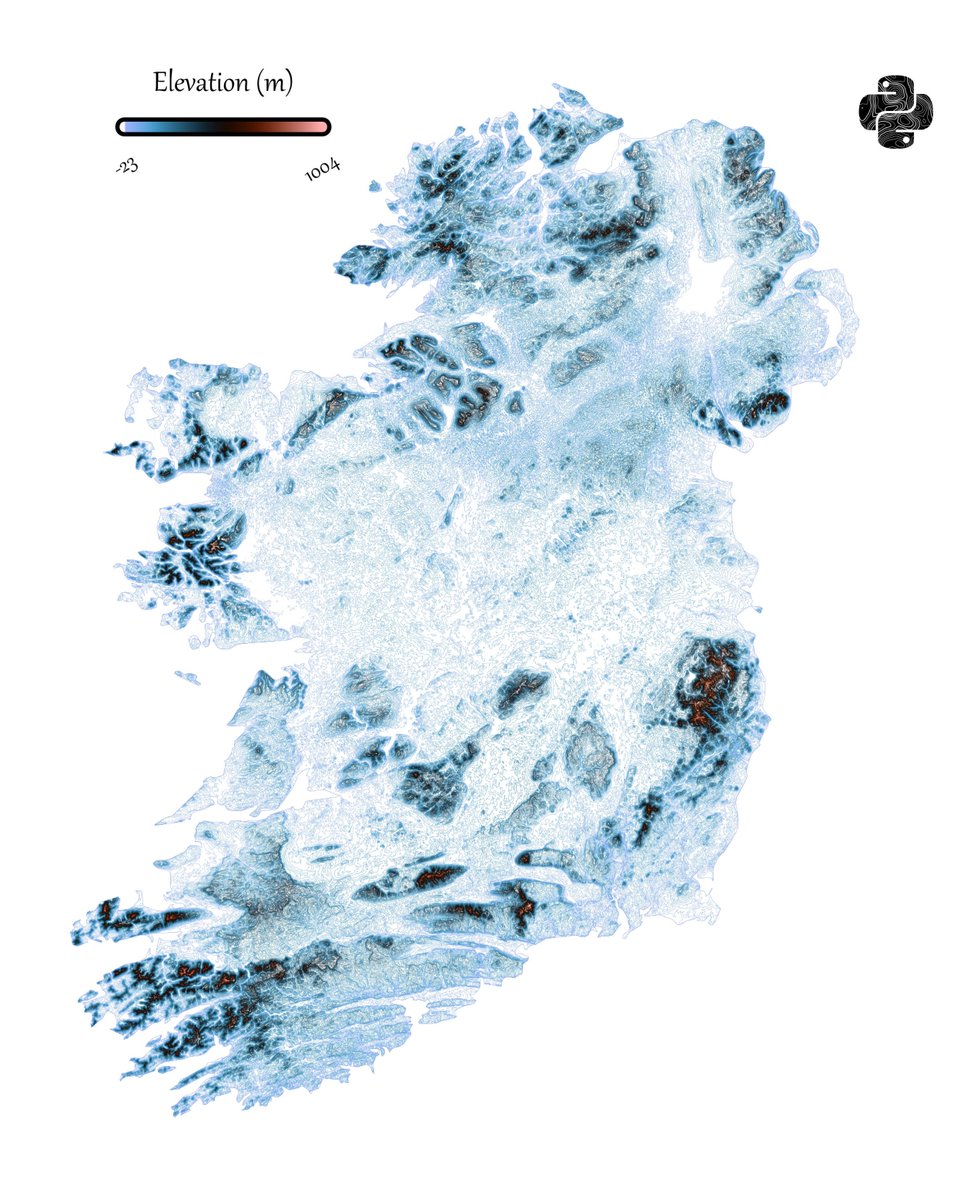
Day 12 of the #30DayMapChallenge - Map from 2125 - I think Northern Ireland and the Republic of Ireland could merge into a new country. So here is a topography map.


United States 트렌드
- 1. Syria 335K posts
- 2. The Quant 53K posts
- 3. ISIS 48.2K posts
- 4. #ThankYouCena 99.6K posts
- 5. Go Navy 9,929 posts
- 6. #CelebrationBowl N/A
- 7. Prairie View 1,393 posts
- 8. SC State 1,798 posts
- 9. #AskCena 3,391 posts
- 10. Polanco 9,946 posts
- 11. John Cena 137K posts
- 12. #SNME 36.2K posts
- 13. Martinelli 8,753 posts
- 14. Villanova 1,471 posts
- 15. South Carolina State 1,466 posts
- 16. FINALLY DID IT 664K posts
- 17. Dick Van Dyke 53K posts
- 18. Gyokeres 13.6K posts
- 19. #LightningStrikes N/A
- 20. Barry Sanders N/A
내가 좋아할 만한 콘텐츠
-
 Helen McKenzie
@helenmakesmaps -
 verygoodmaps
@verygoodmaps -
 svg
svg
@newgeographer2 -
 Remote Sensing MDPI
@RemoteSens_MDPI -
 SpatioTemporal Asset Catalog
@STACspec -
 Geo_Spatialist
@geo_spatialist -
 Earth Blox
@EarthBlox -
 terence
@researchremora -
 MapLibre
@maplibre -
 Spiros Staridas
@StaridasGeo -
 MappingGIS 🚀🌍
@MappingGIS -
 Qiusheng Wu
@giswqs -
 Matt Malone
@MatthewHMalone -
 Kurt Menke - @geomenke.bsky.social
@geomenke -
 Radiant Earth
@OurRadiantEarth
Something went wrong.
Something went wrong.