#datacomics search results

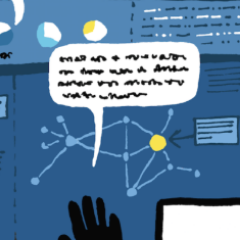
Design Patterns for Data Comics at #CHI2018 #datacomics #dataviz - check out the paper by @benjbach et al. for more details


What would interaction add to data comics? How to create interactive data comics? Together with @HugoRomat @fanny_uoft @nathriche @davemurrayrust @benjbach, see you on Friday @ieeevis 2021! Find more examples and documentations at interactivedatacomics.github.io. #dataviz #datacomics

Fantastic work on DataComics, one of my highlights from #CHI2019, by @nathriche @ken_hinckley @benjbach and so many others; really inspiring work and excellent talks! #datacomics #SketCHI #sketchnote


With an addition single line of code, `plt.xkcd()` you can create xkcd-styled bar chart races in @matplotlib @xkcdComic #datacomics #dataviz


Today, 2pm @chi2019: @namwkim85 on "DataToon: Drawing Dynamic Network Comics With Pen+ Touch Interaction": Session Storytelling with Visualizations, Boisdale 2 #dataviz #datacomics w/ @nathriche guangpeng xu @mattbrehmer @ken_hinckley Michel Pahud @HaijunXia @MJMcGuffin @hpfister


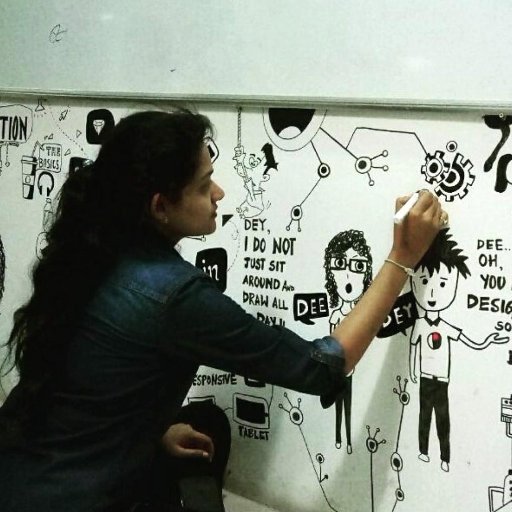
Congratulations @zezhong_w for passing your #phd viva on on Creating #datacomics @DesignInf @InfAtEd!! Thanks to his jury @NElmqvist & John Lee. We are sad to see you leaving and wish you the best w/ @SheelaghCarp! :D zezhongwang.com @benjbach & @davemurrayrust


🎉 Excited to unveil #MovingWhileWoman: Bindu's Big City Journey-a #datacomics that delves deep into the experiences of #women navigating #urbanmobility in India Check it out 👉lnkd.in/dg2fJmnx #GenderandMobility @OMIFoundation


Day 2 of #creativecommunities #datacomics #animation and #360video explorations of #ruralmentalhealth @GSofA


"Obey your husband" - Yup, that's the law in 19 countries! gramener.com/playground/dat… Check out our exploratory visual to know more about 'Challenges #Women Face' #dataviz #datacomics


Spearheading @OMIFoundation's #MovingWhileWoman campaign, I'm elated to see the #datacomics evolve from an idea to innovative & impactful visual #policy tool. Dive into the journey & explore the insightful narratives 👉lnkd.in/dg2fJmnx#Women… #WomenInMobility #SDG5 #SDG11 #SDGs

Save Jasper. Wear a mask😷! Here's my take on this week's #comicgenfriday #datacomics #comicgen @Gramener

@zezhong_w on #datacomics now at Edinburgh #dataviz meetup : datacomics.net @CreateInf @DesignInf @InfAtEd


Day3 #30DayChartChallenge! Makeover!.. Today I was telling the students about storytelling, so all thoughts are there! 🤣 And with stupid jokes! #datacomics


Data Visualization @LNF_Austria @fh_stpoelten @fhstp_icmt #Science #visualizationliteracy #datacomics #dataphysicalization


Data Problems 1: think about the data needed to answer the question before collecting data. #datacomics #comics #scicomics #drawing #data #dataproblems #collaborate

I spontaneously drew this data comic. At first, it seemed more intriguing, but it's still quite straightforward. I initially wanted to make a bar chart, but this type of data is rarely presented in bars. What do you think of this adventure? 😥 #datacomics #dataviz

Simple Tools to Help Data Artist! 😎 In this newsletter, I've gathered simple and useful free resources that will be helpful for beginner data artists! open.substack.com/pub/flowersnum… #dataviz #dataart #datacomics

#Day13 #30DayChartChallenge I'm later but! Family! I remembered about my old Mezen Family Tree project! I love it 🥰 eolay.tilda.ws/mezen_tree/en #datacomics #dataart

Too beautiful dashboard! I can't stop thinking about the aesthetic side of dashboards. On one hand, a pleasant design is a good thing. On the other hand, too much beauty can distract from the data. 🥰 What do you think? #businessintelligence #datavisualization #datacomics

#30DayChartChallenge #Day10 Physical! Well, it's important for us northerners to hold out until the summer and not fall apart... Oh, vitamins, my vitamins... #datacomics

Day5 #30DayChartChallenge So I've got myself into interesting theory, while drawing this comics 😁 #datacomics #dataviz

Day3 #30DayChartChallenge! Makeover!.. Today I was telling the students about storytelling, so all thoughts are there! 🤣 And with stupid jokes! #datacomics

First Data Comics: 'Moving While Woman: Bindu’s Big City Journey' - a powerful advocacy tool endorsed by officials like Shri R.K. Singh. Strengthening our global stance at G20 events on technology, security, and disability inclusion. #DataComics #G20

I love this! 🫶 #sciviz #datacomics

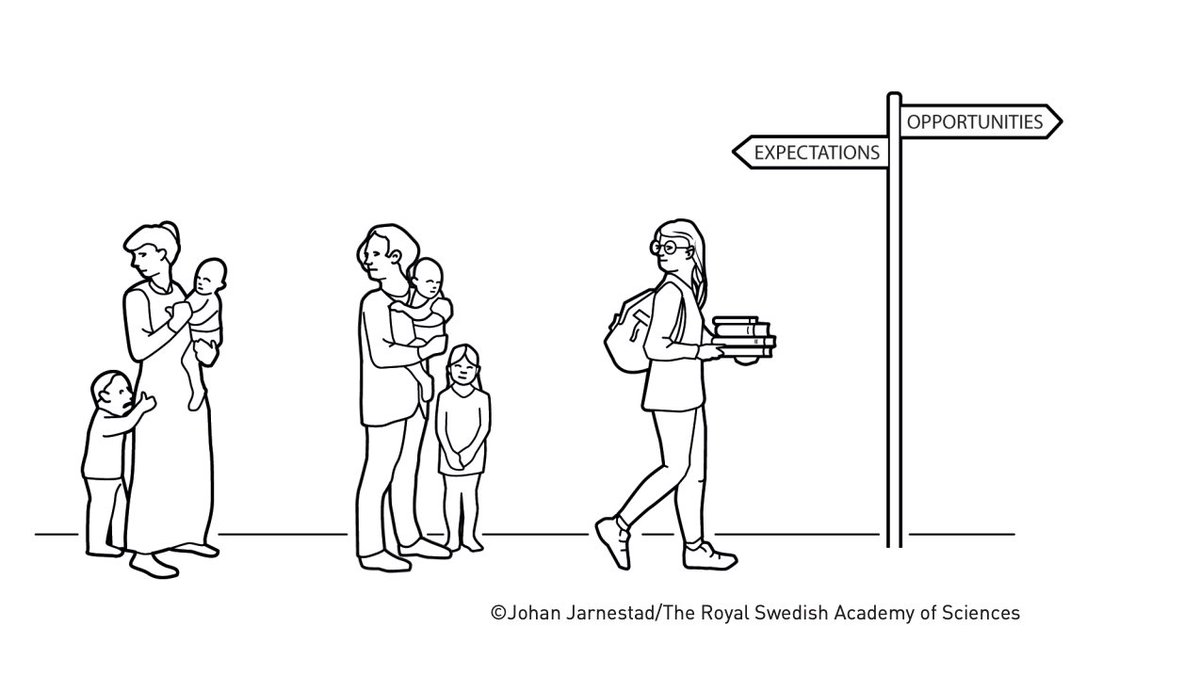
The use of #infographics in Claudia Goldin's @NobelPrize press release to represent the concepts and visually synthesise the content is brilliant. Simple and elegant #infographics ©Johan Jarnestad nobelprize.org/prizes/economi…


Check out this amazing comic showcasing data on women’s travel experience in a Indian cities! #datacomics #MovingWhileWoman #WomenMobilize 🌆🚶🏾♀️🚌🚇🛺🌃👇
🎉 Excited to unveil #MovingWhileWoman: Bindu's Big City Journey-a #datacomics that delves deep into the experiences of #women navigating #urbanmobility in India Check it out 👉lnkd.in/dg2fJmnx #GenderandMobility @OMIFoundation
Spearheading @OMIFoundation's #MovingWhileWoman campaign, I'm elated to see the #datacomics evolve from an idea to innovative & impactful visual #policy tool. Dive into the journey & explore the insightful narratives 👉lnkd.in/dg2fJmnx#Women… #WomenInMobility #SDG5 #SDG11 #SDGs
🎉 Excited to unveil #MovingWhileWoman: Bindu's Big City Journey-a #datacomics that delves deep into the experiences of #women navigating #urbanmobility in India Check it out 👉lnkd.in/dg2fJmnx #GenderandMobility @OMIFoundation
Delve into the data-driven exploration of Bindu's journey in an Indian metropolis. Discover if and how women's mobility experiences vary based on economic background, caste, religion and disabilities. #Inclusivity #DataComics #IndianCities

Collaboration in Practice: #DataComics in Learning Management Systems Elisabeth Königshofer & Katharina Wünsche (@ACDH_OeAW) foster data comics potential as educational tool by running user tests & evaluating the amount of retained knowledge 👉 comic.acdh-dev.oeaw.ac.at #DH2023


Did blog after a long gap on some blind bids and beautiful data. #NewBlog #DataComics medium.com/datacomics/the…

Data Visualization @LNF_Austria @fh_stpoelten @fhstp_icmt #Science #visualizationliteracy #datacomics #dataphysicalization
Thank you @senantix for the insightful review on the book “From Data to Stories” authored by @richielionell and @MylavarapuRamya. . Read the full review here: hubs.li/Q013ktdJ0 #Datacomics #Cricket #Bookreview @cricmash

"The book itself demonstrates of how gently and seamlessly mixing visual and storytelling techniques can produce a successful data visualisation." Read this review of #FromDataToStories by @theneilrichards #datacomics @MylavarapuRamya @richielionell @Gramener @WileyGlobal

Are you a storyteller, a #dataviz enthusiast, a cricket fan, or do you just love a good comic story? If so, From Data to Stories, by @richielionell & @MylavarapuRamya , won't disappoint. @theneilrichards (all of the above) reviews this delightful read nightingaledvs.com/how-can-we-use…
nightingaledvs.com
REVIEW: How Can We Use Comics to Tell Data Stories? - Nightingale
The book demonstrates how gently and seamlessly mixing visual and storytelling techniques can produce a successful data visualisation.
Congratulations @zezhong_w for passing your #phd viva on on Creating #datacomics @DesignInf @InfAtEd!! Thanks to his jury @NElmqvist & John Lee. We are sad to see you leaving and wish you the best w/ @SheelaghCarp! :D zezhongwang.com @benjbach & @davemurrayrust

Spearheading @OMIFoundation's #MovingWhileWoman campaign, I'm elated to see the #datacomics evolve from an idea to innovative & impactful visual #policy tool. Dive into the journey & explore the insightful narratives 👉lnkd.in/dg2fJmnx#Women… #WomenInMobility #SDG5 #SDG11 #SDGs
🎉 Excited to unveil #MovingWhileWoman: Bindu's Big City Journey-a #datacomics that delves deep into the experiences of #women navigating #urbanmobility in India Check it out 👉lnkd.in/dg2fJmnx #GenderandMobility @OMIFoundation
What would interaction add to data comics? How to create interactive data comics? Together with @HugoRomat @fanny_uoft @nathriche @davemurrayrust @benjbach, see you on Friday @ieeevis 2021! Find more examples and documentations at interactivedatacomics.github.io. #dataviz #datacomics
Design Patterns for Data Comics at #CHI2018 #datacomics #dataviz - check out the paper by @benjbach et al. for more details
@Dey_ComicGen is actually 1cm shorter than the average Dutch woman! Here's my take on this week's #comicgenfriday #comicgen #datacomics @Gramener

Save Jasper. Wear a mask😷! Here's my take on this week's #comicgenfriday #datacomics #comicgen @Gramener
Reporting your controlled user study and statistical analysis with a data comic? The paper is together with @jwkritchie @Cyphexl @fanny_uoft @benjbach. We'll see you in @ieeevis 2020! Find more examples and read the paper on statscomics.github.io. #dataviz #datacomics


"Obey your husband" - Yup, that's the law in 19 countries! gramener.com/playground/dat… Check out our exploratory visual to know more about 'Challenges #Women Face' #dataviz #datacomics

This week's collection of @MSPowerBI #data funnies, brought to you by our @sqlgearhead !! #datacomics #bigdata #datavisualization #datawarehouse #datanerds #dataanalytics #DAX #PowerBI

@zezhong_w on #datacomics now at Edinburgh #dataviz meetup : datacomics.net @CreateInf @DesignInf @InfAtEd
Fantastic work on DataComics, one of my highlights from #CHI2019, by @nathriche @ken_hinckley @benjbach and so many others; really inspiring work and excellent talks! #datacomics #SketCHI #sketchnote

Data Visualization @LNF_Austria @fh_stpoelten @fhstp_icmt #Science #visualizationliteracy #datacomics #dataphysicalization
Day 2 of #creativecommunities #datacomics #animation and #360video explorations of #ruralmentalhealth @GSofA
On my way to @sig_chi, talking about >Design Patterns for Data Comics<, joint work with @zezhong_w, @matteofarinella, @davemurrayrust @nathriche #dataviz #datacomics. 1st session Tue! aviz.fr/~bbach/datacom…

First evaluation of #datacomics presented by @zezhong_w at #CHI19 - find all the results online: researchgate.net/publication/33… #dataviz #scicomm #comics


Paper "Design Patterns for Data Comics" at @ACMDL: dl.acm.org/citation.cfm?d… #DataComics #Comics #InfoVis

Something went wrong.
Something went wrong.
United States Trends
- 1. Jeremiyah Love 2,256 posts
- 2. Texas A&M 6,356 posts
- 3. Dylan Stewart N/A
- 4. Malachi Fields N/A
- 5. #GoIrish 2,504 posts
- 6. Massie 102K posts
- 7. Andrew Marsh N/A
- 8. LaNorris Sellers N/A
- 9. #Varanasi 289K posts
- 10. Bryce Underwood N/A
- 11. Narduzzi N/A
- 12. Zvada N/A
- 13. Mike Shula N/A
- 14. #NotreDame N/A
- 15. #GoBlue 1,915 posts
- 16. #CollegeGameDay 2,597 posts
- 17. Tae Johnson N/A
- 18. South Carolina 8,319 posts
- 19. Todd Snider N/A
- 20. Marcel Reed N/A