#datascienceandanalytics search results

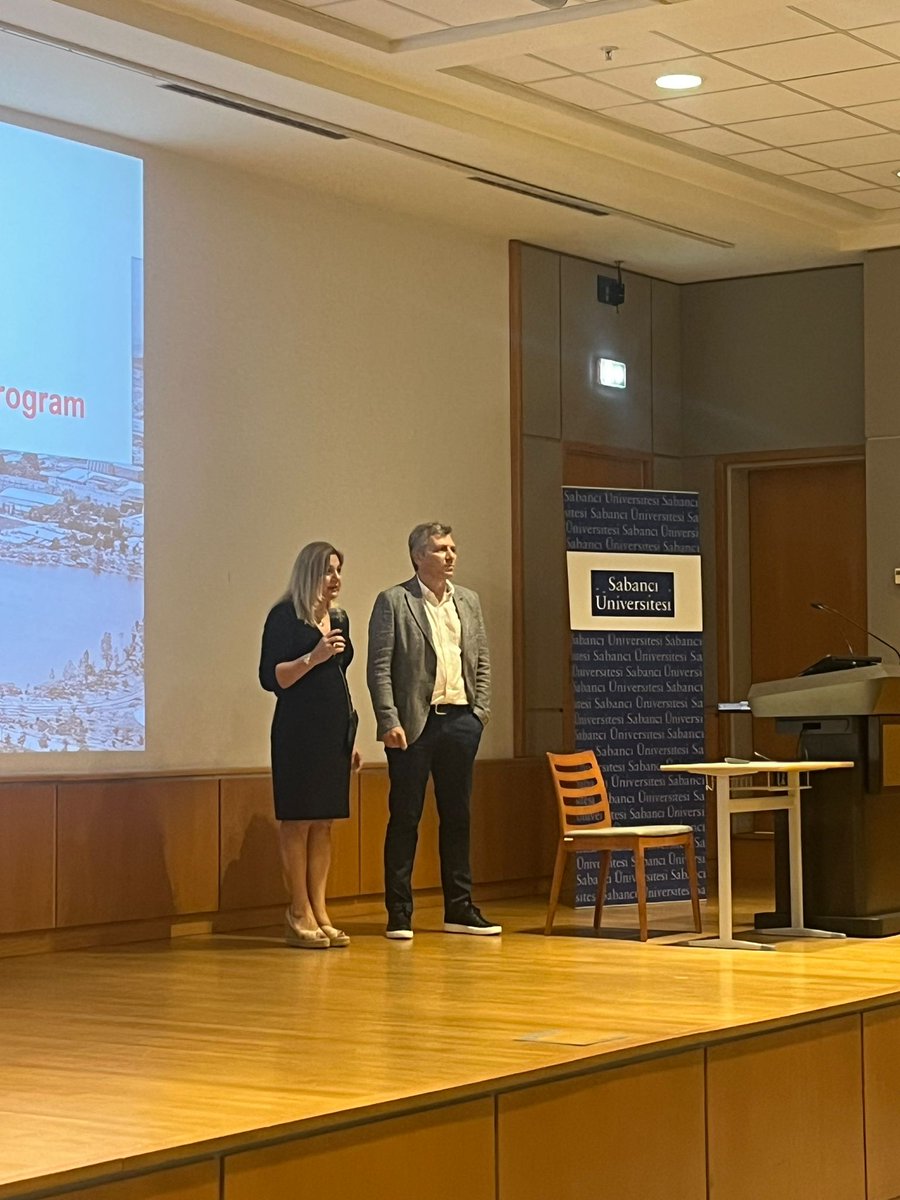
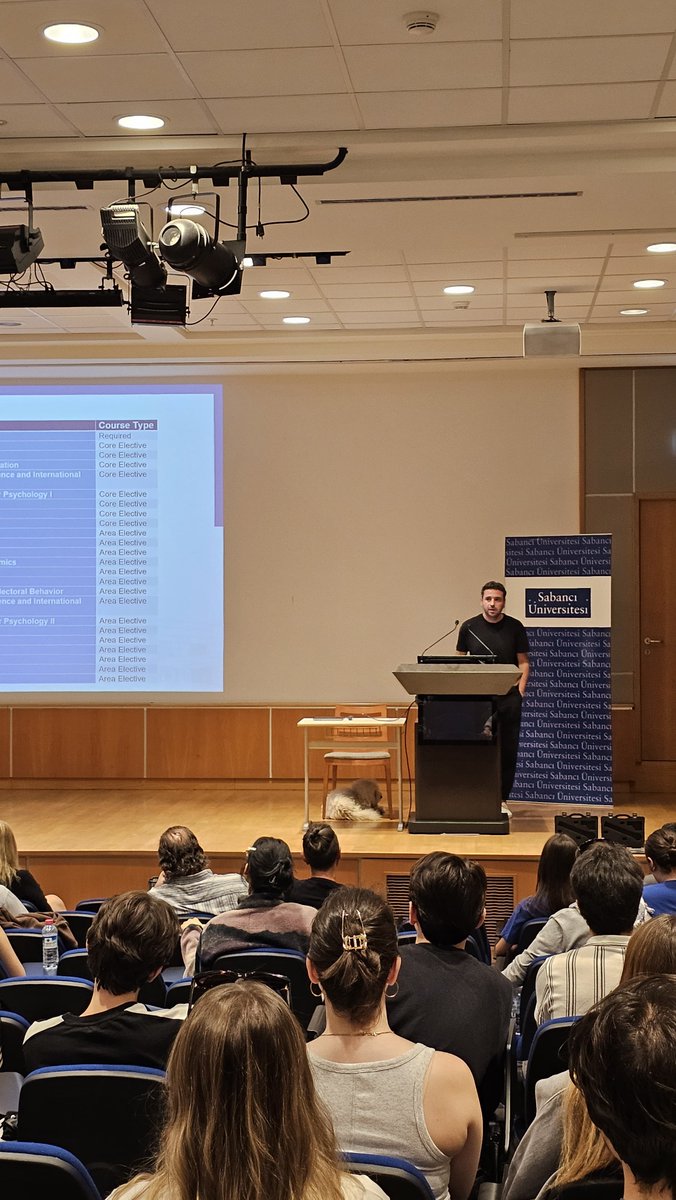
Data Science and Analytics Undergraduate Program Info Session w @fenssabanci👩💻 📊 #newprogram #datascienceandanalytics


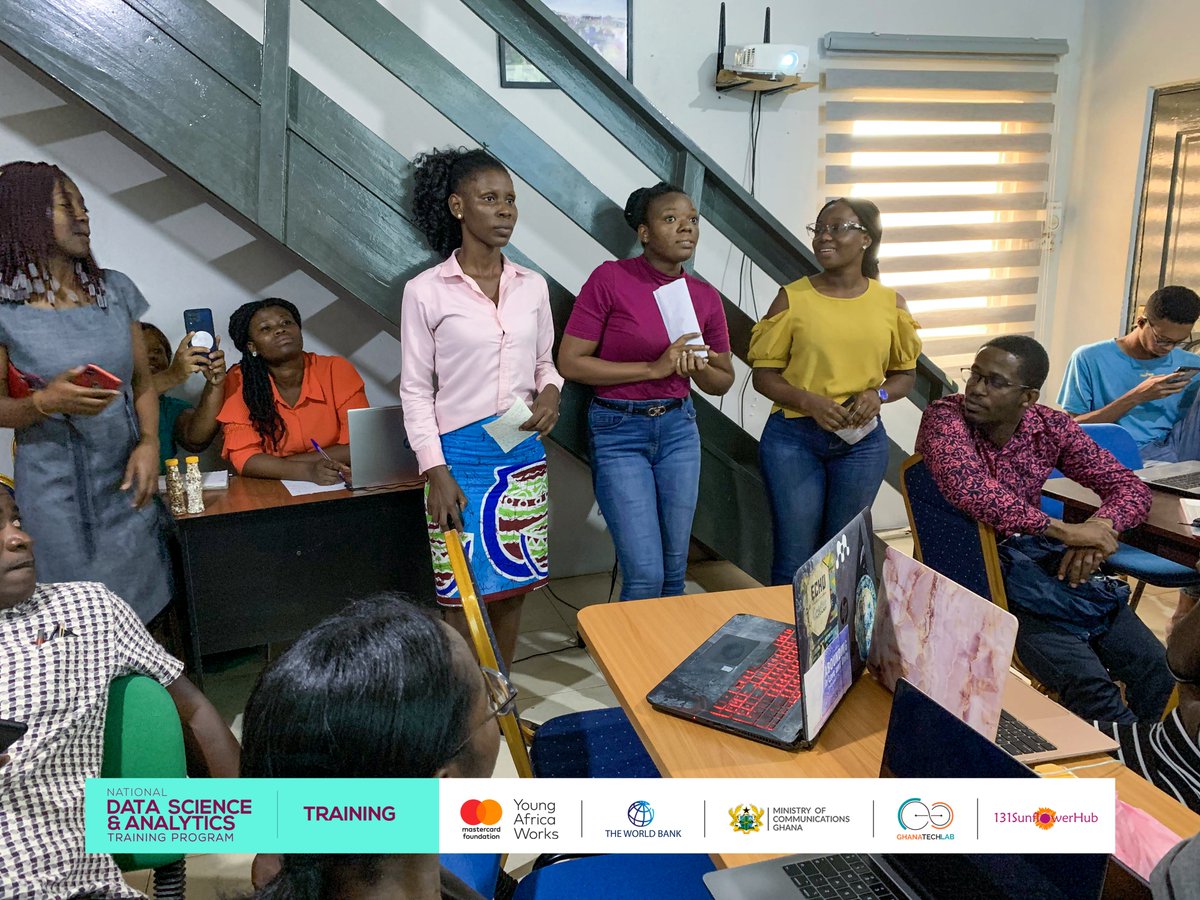
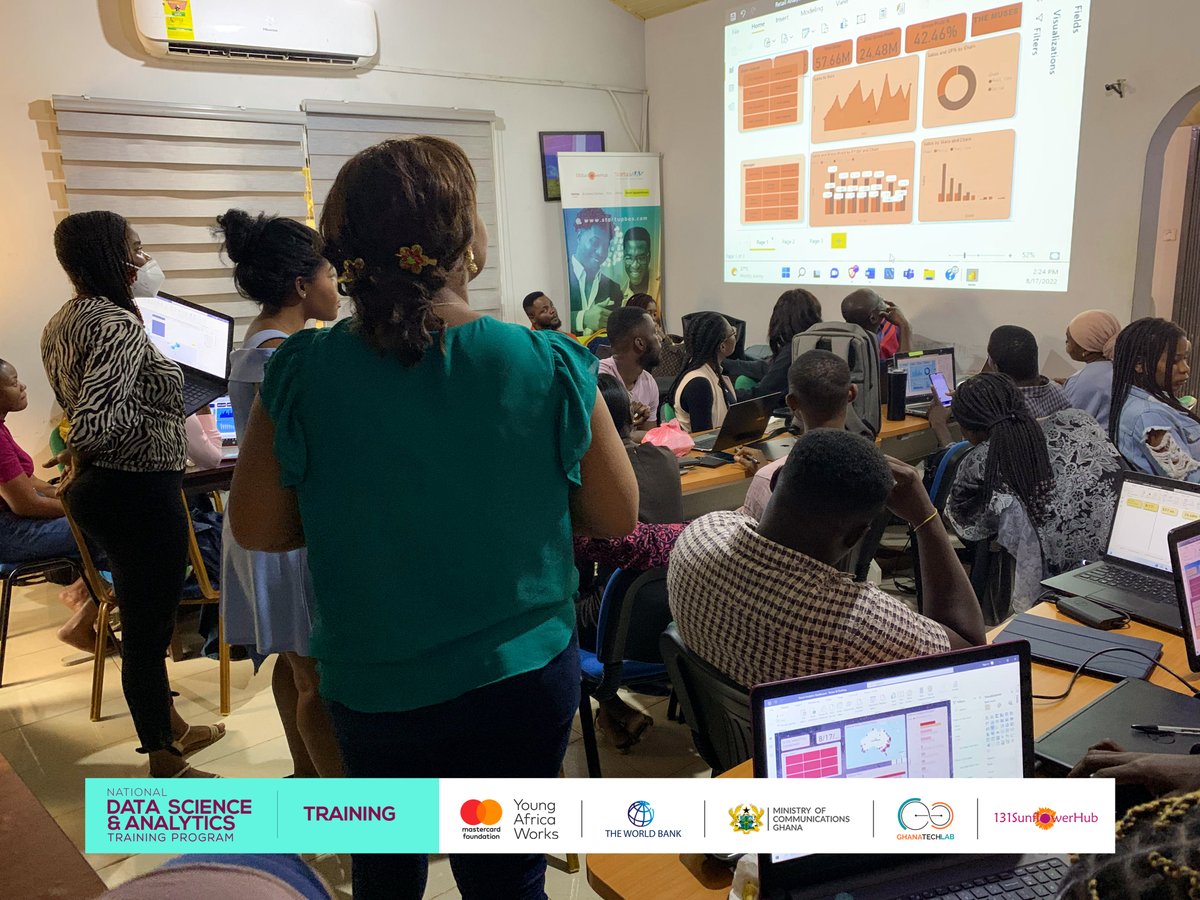
In our data visualization class yesterday, trainees presented their findings from their analysis and visualization of Australian retail data. Presentations were done in groups and showcased great teamwork, data storytelling and collaboration skills. #datascienceandanalytics

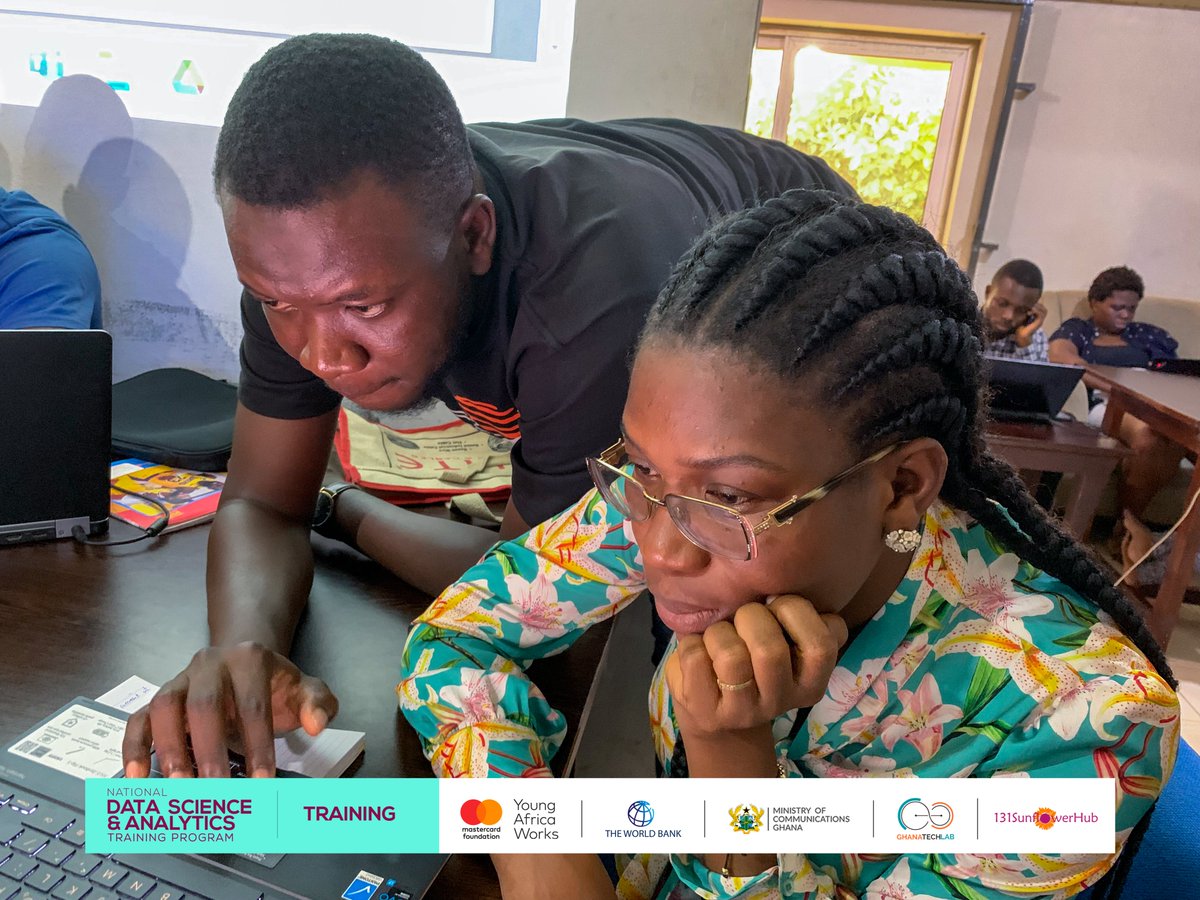
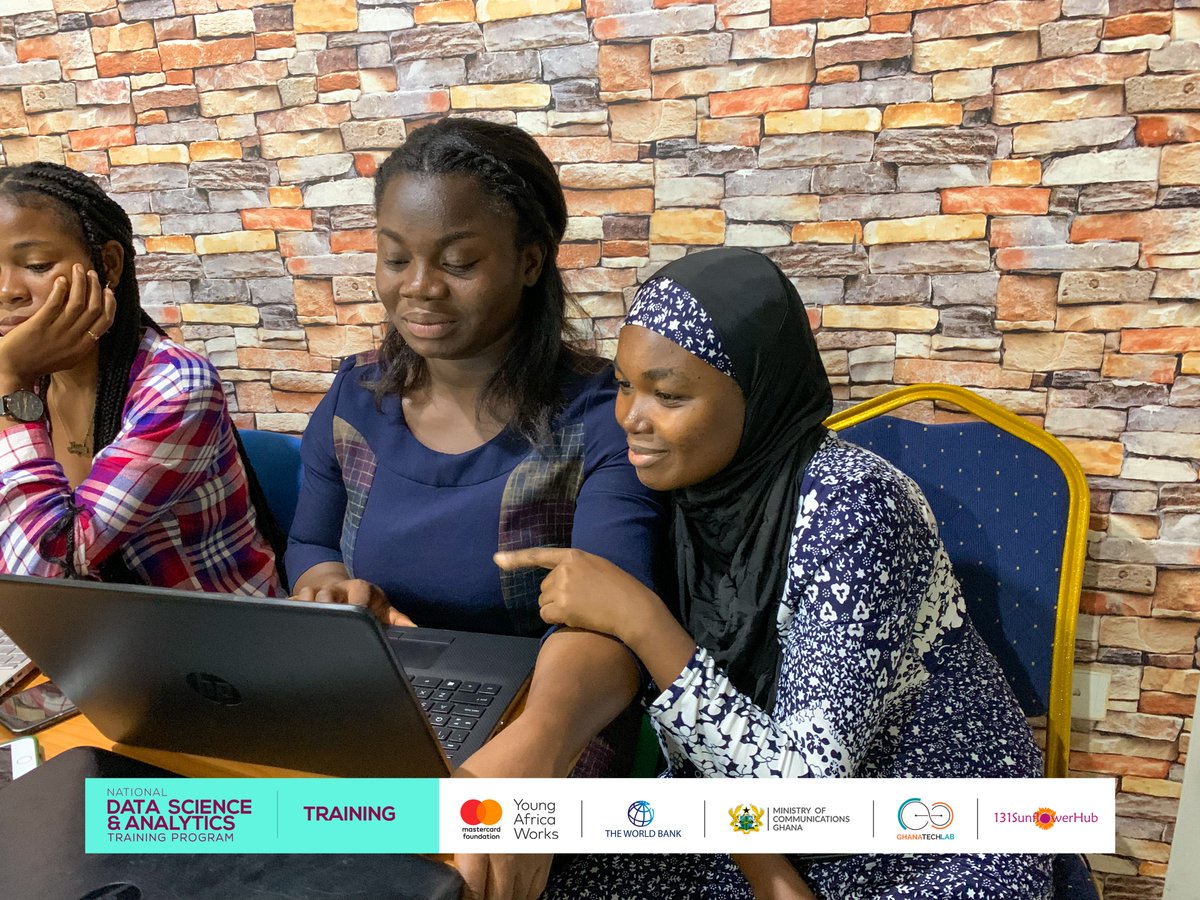
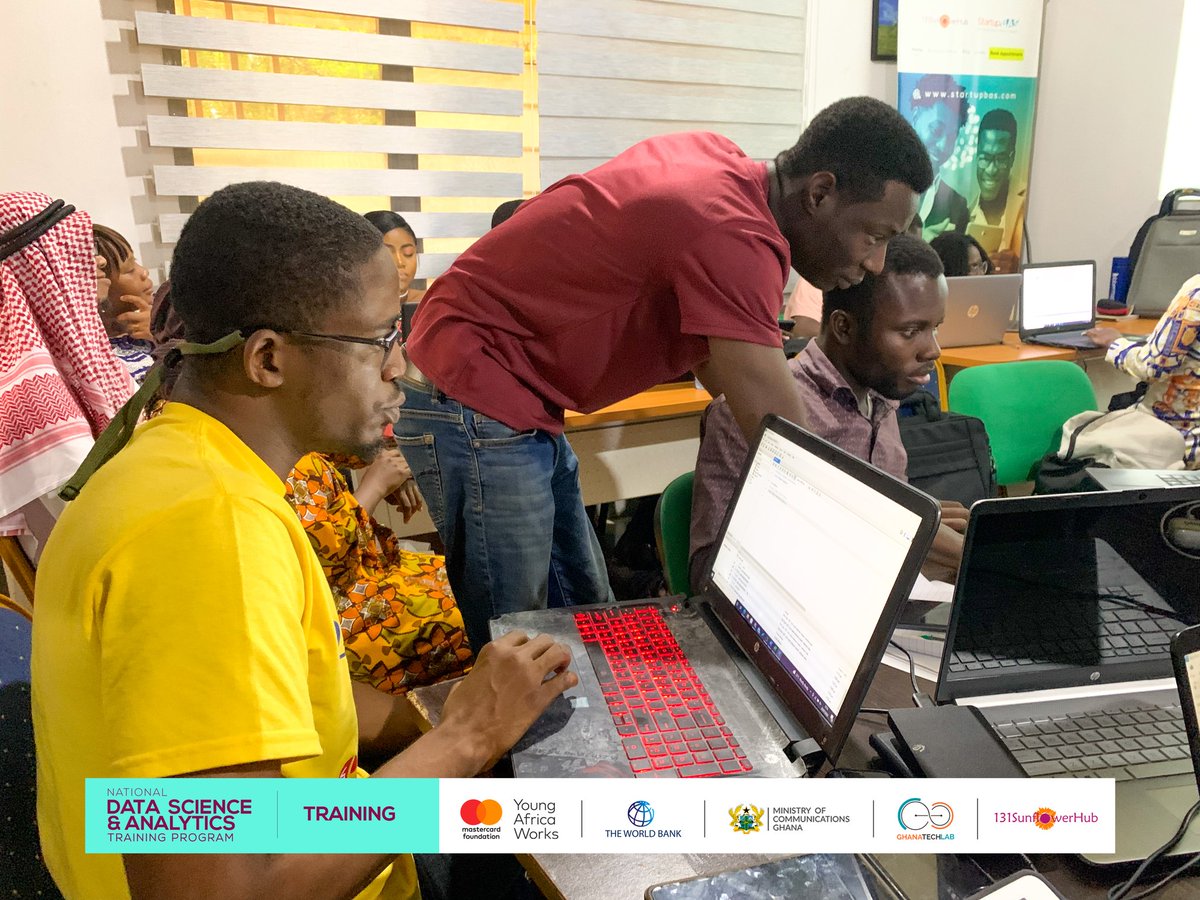
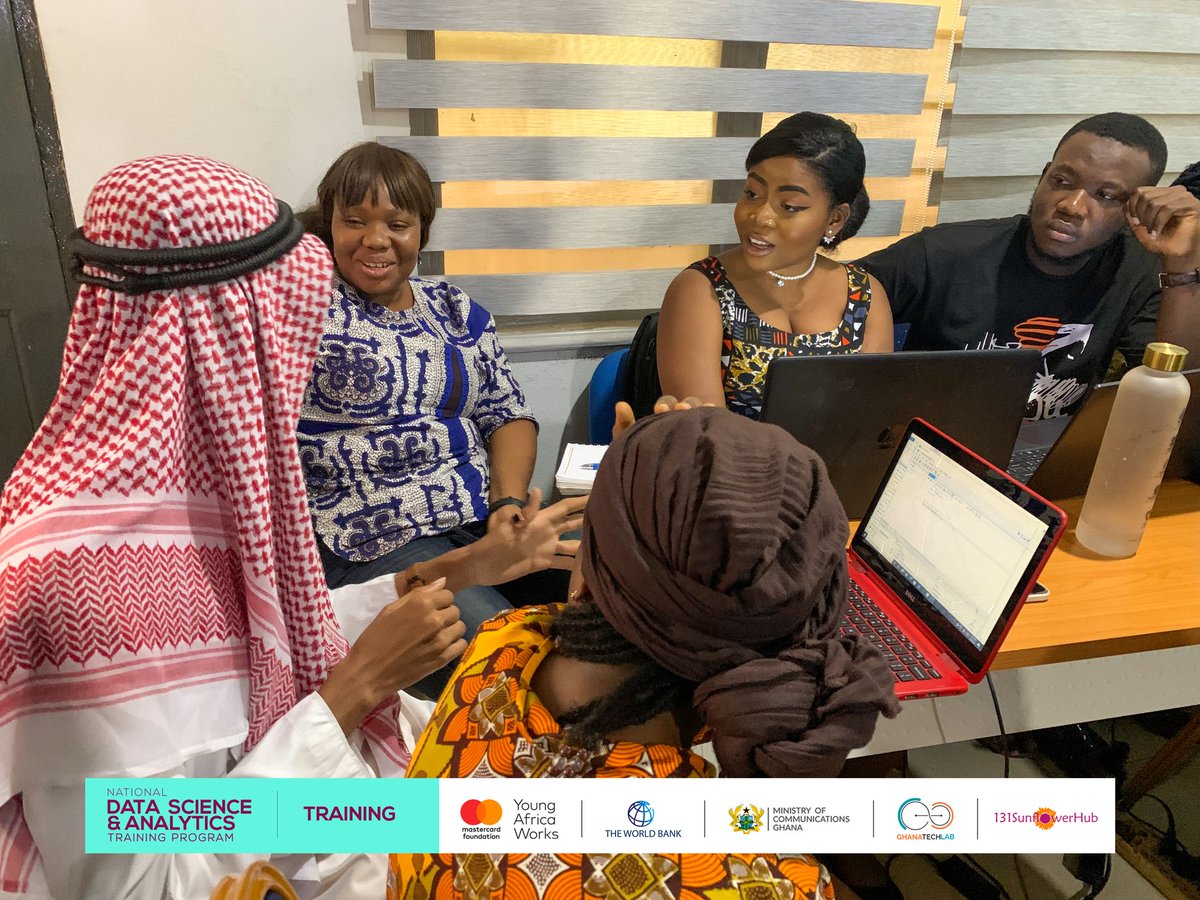
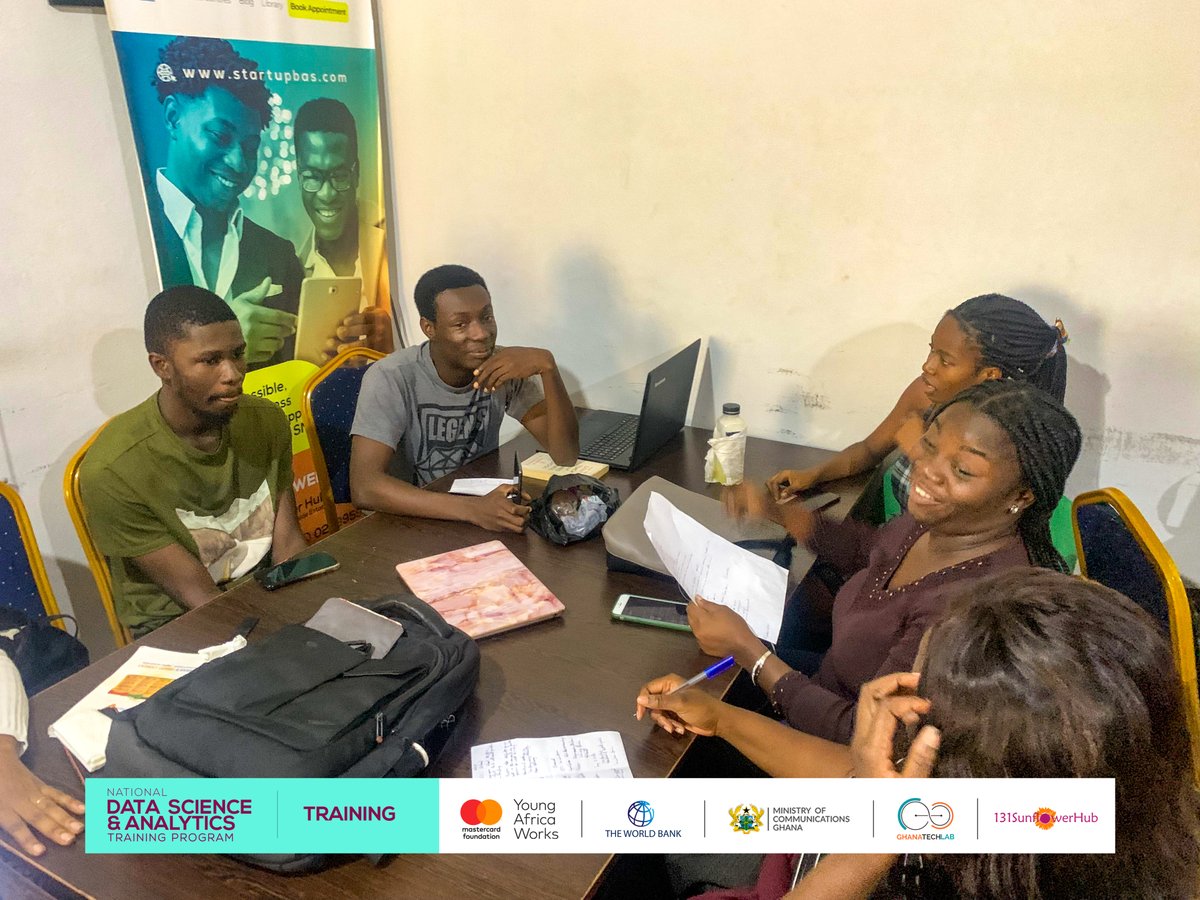
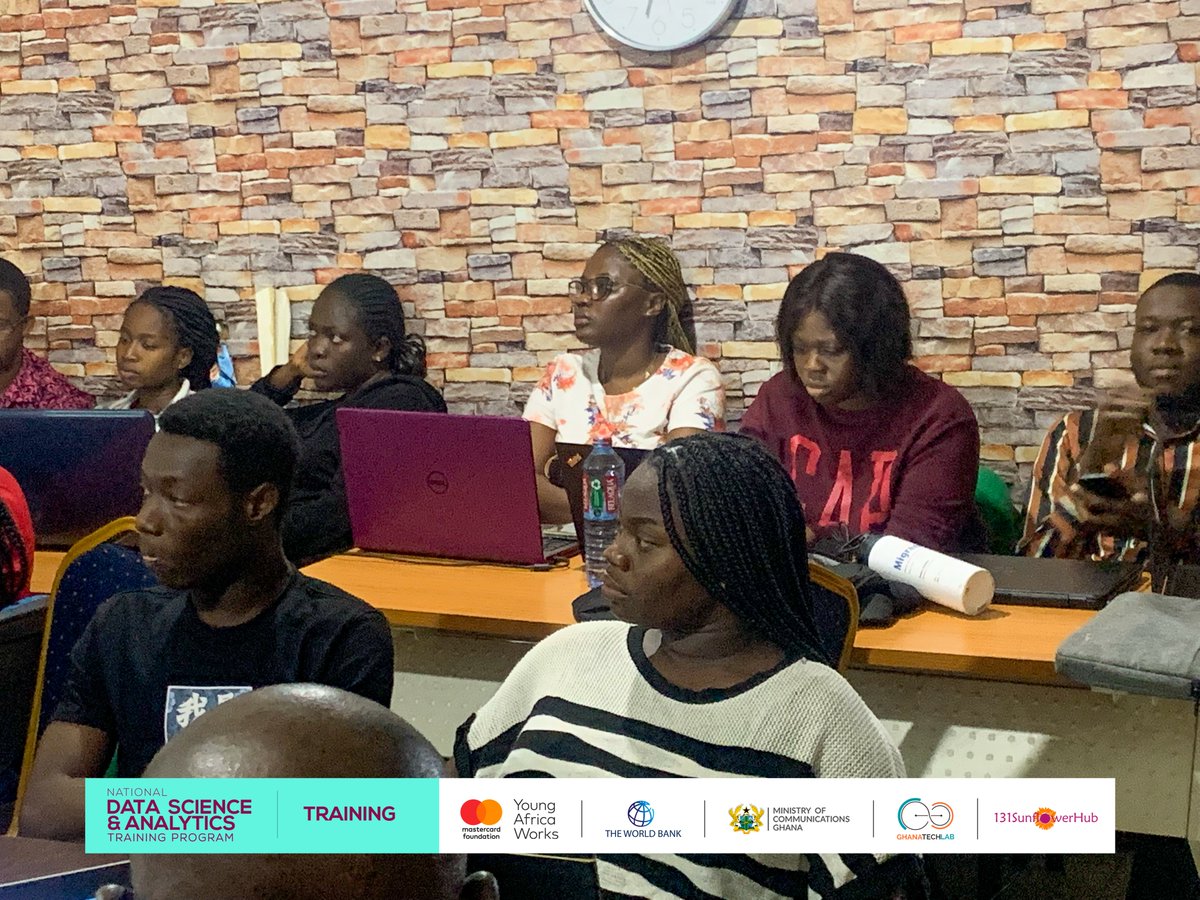
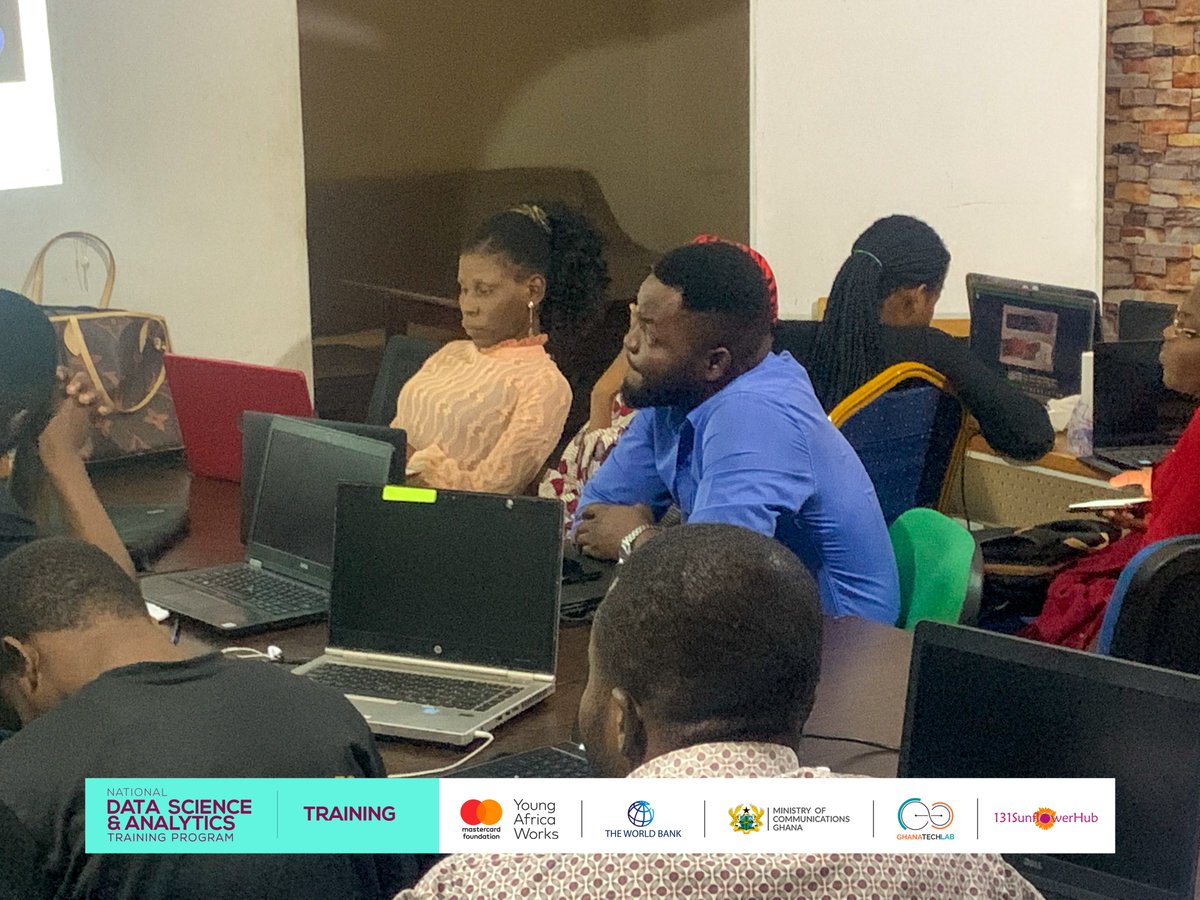
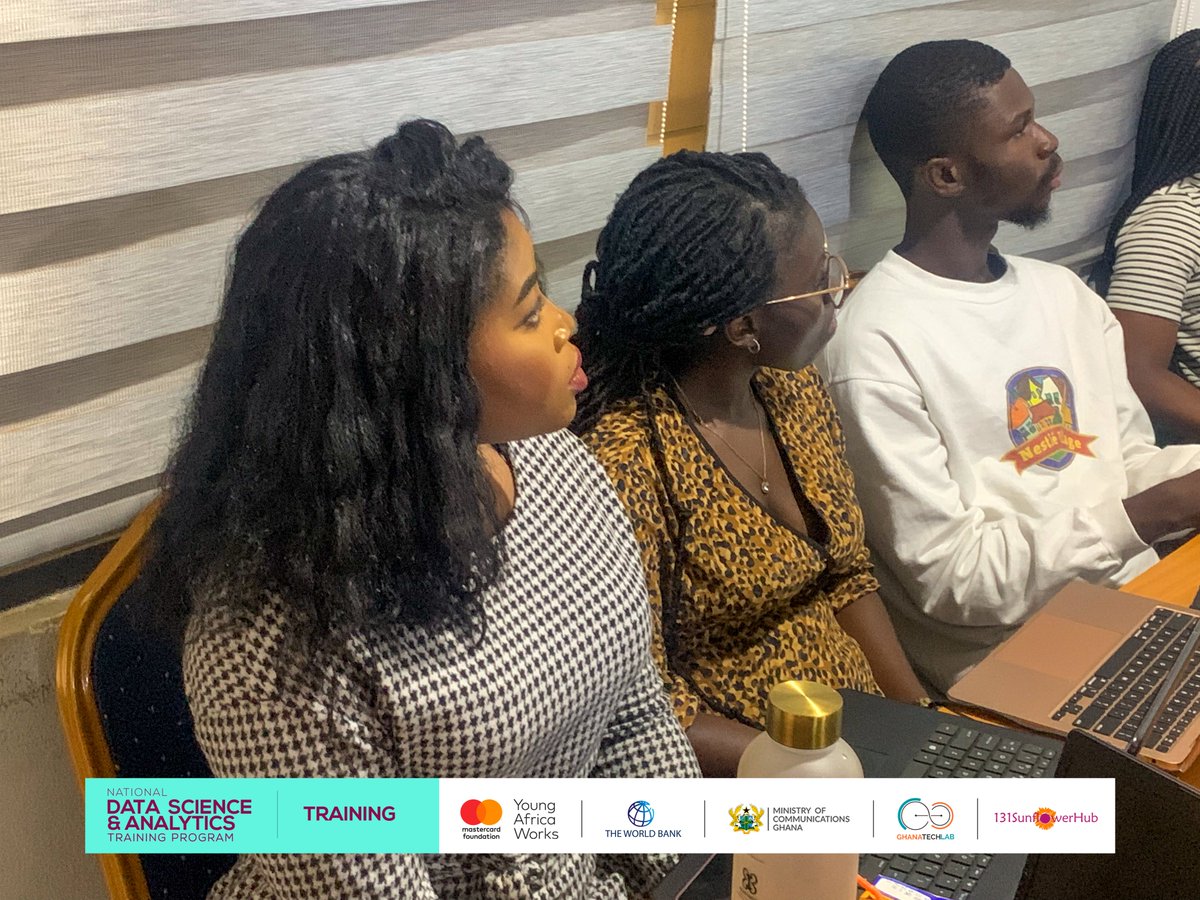
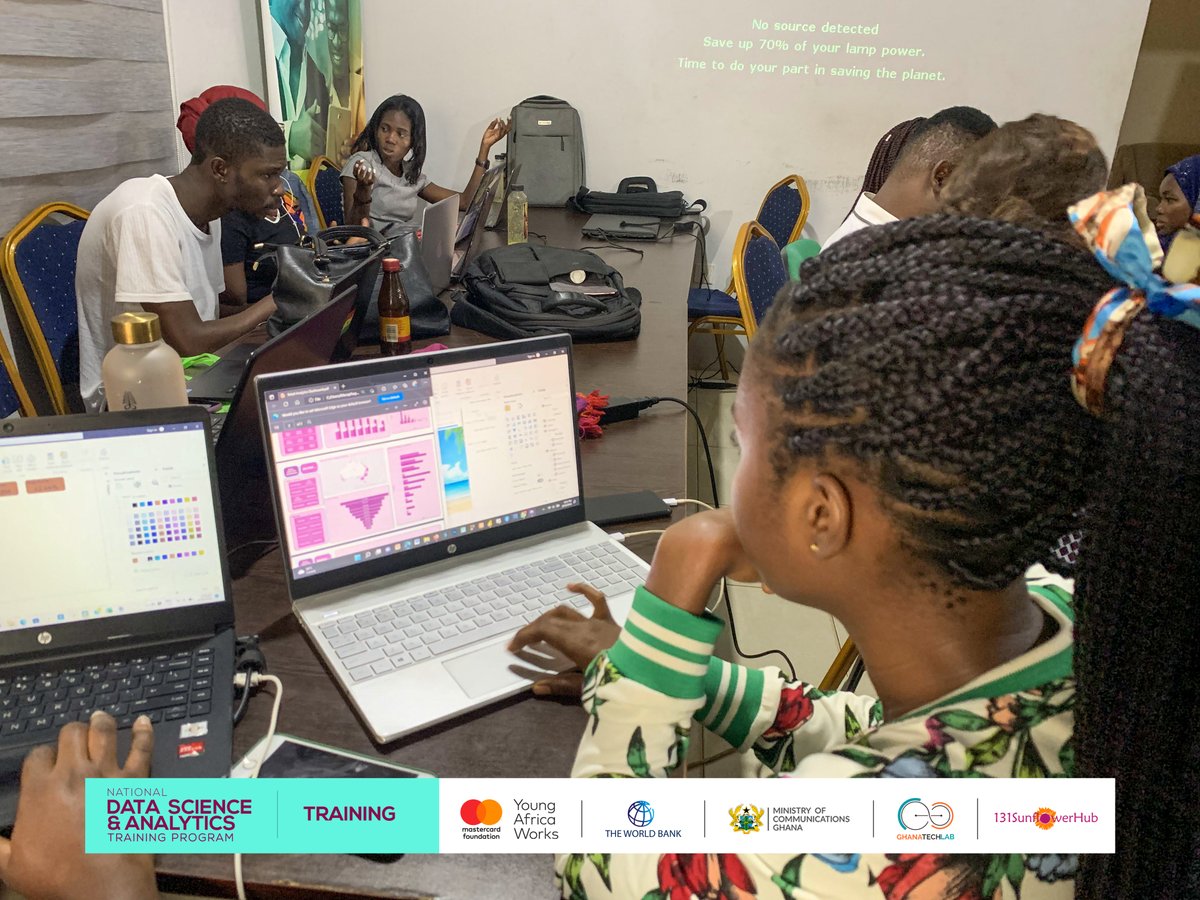
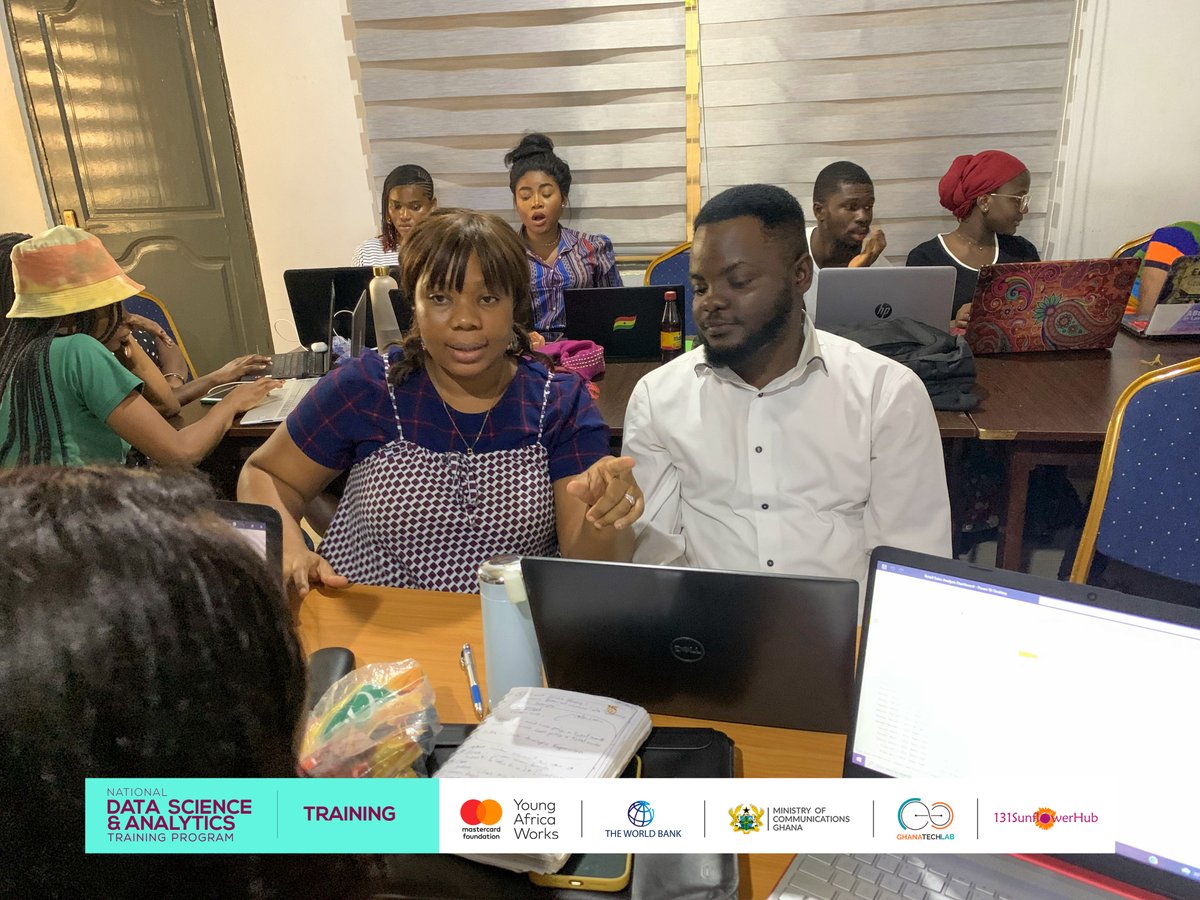
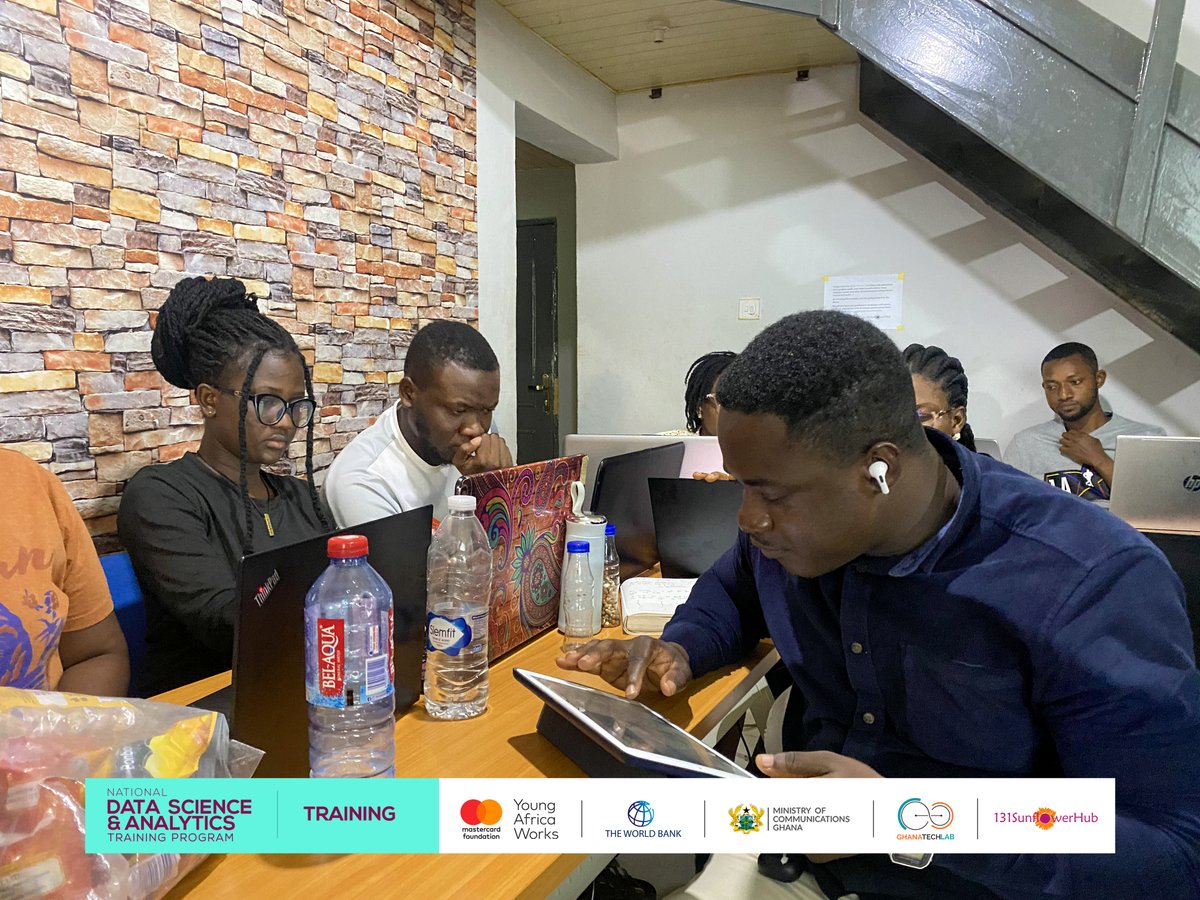
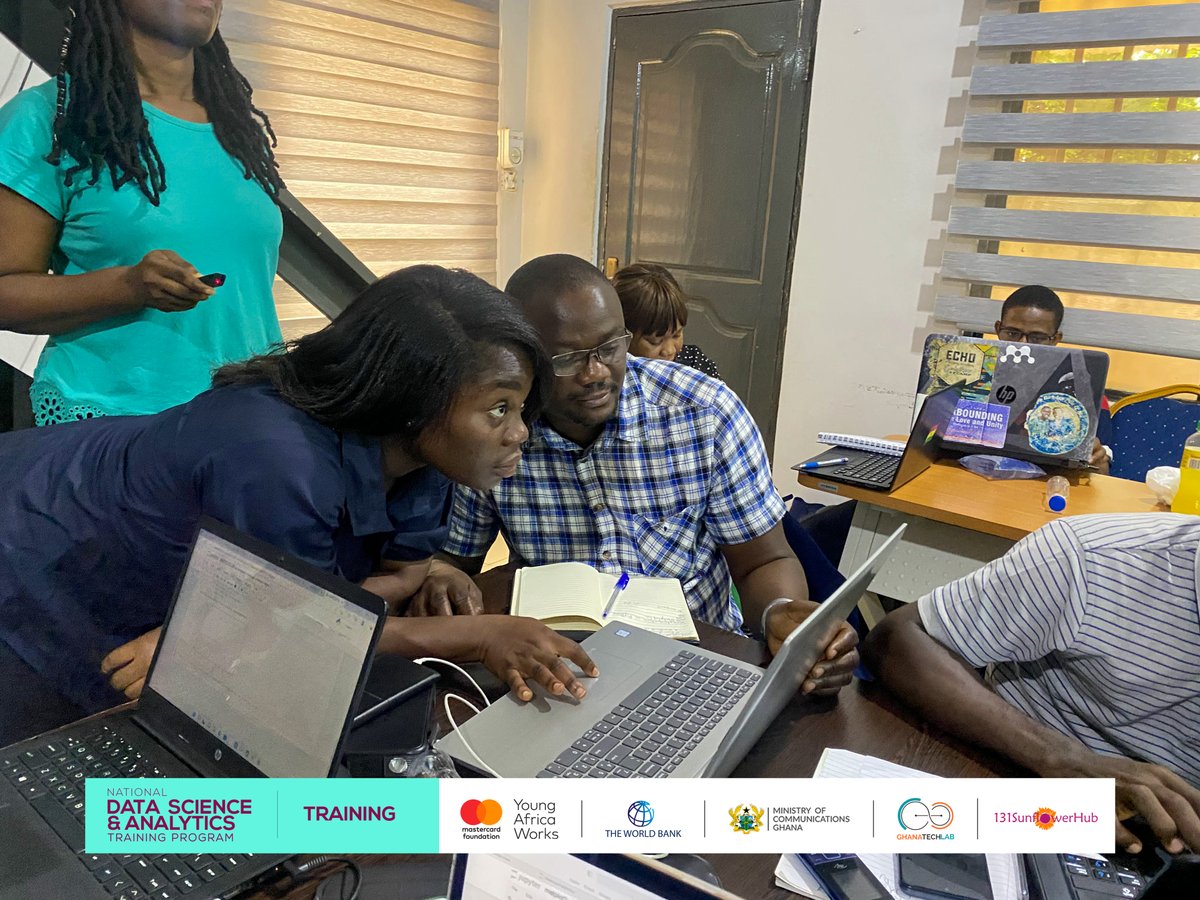
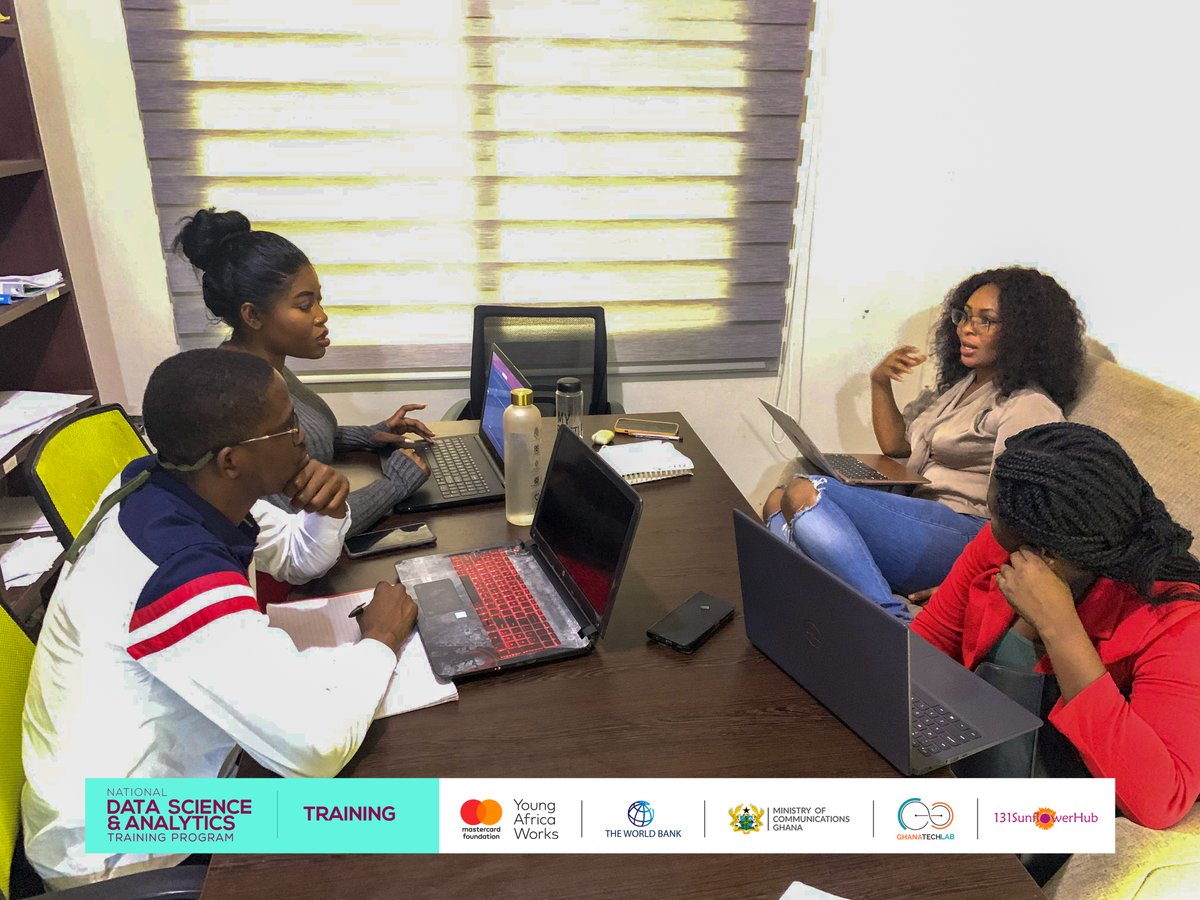
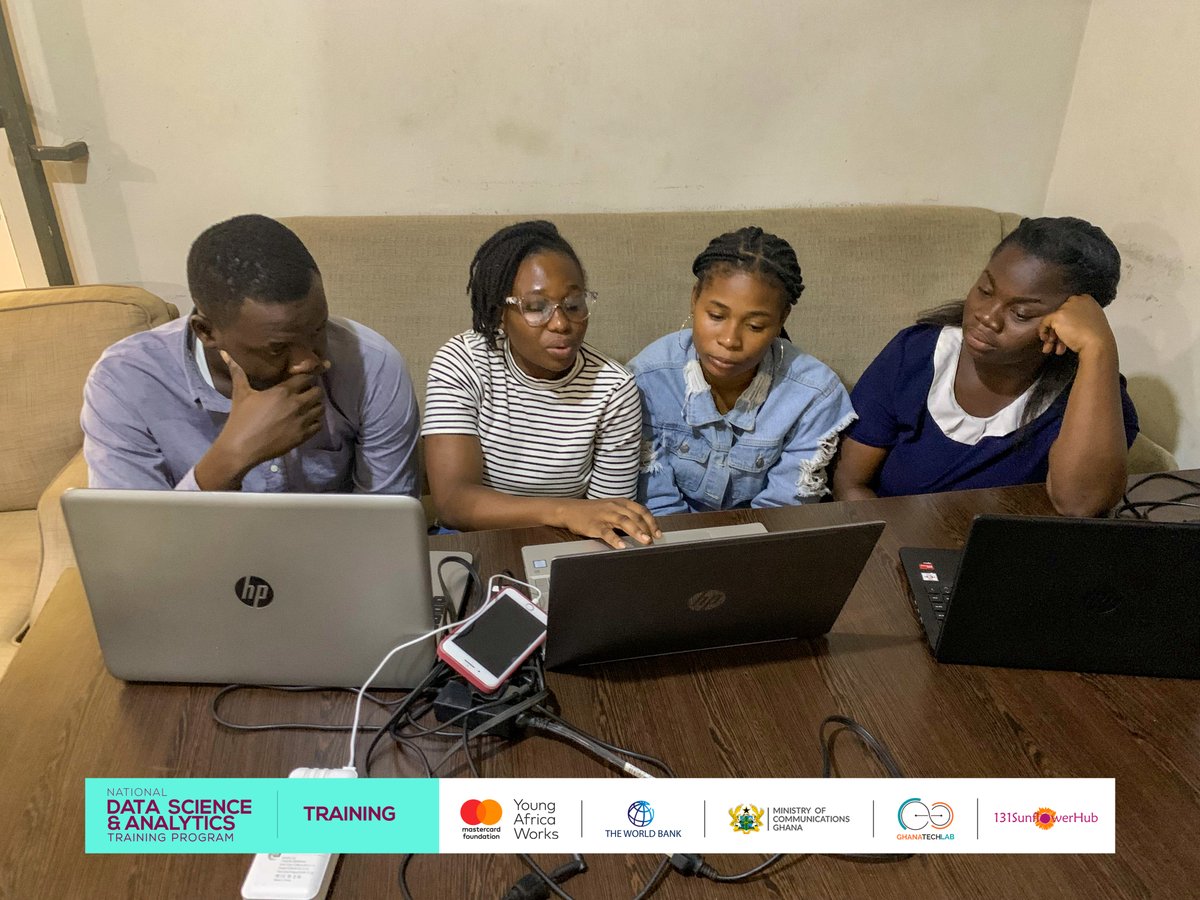
Snippets from our data science and analytics training week 1 #gtlimpact #gtlbaseprogram #datascienceandanalytics #evimpact

Businesses don’t fail from lack of data. They fail from too much of it, with no clarity. If your team is stuck in “analysis paralysis,” it’s not a data problem. It’s a decision problem. #DataScienceandAnalytics

Confusion Matrix? At first, it definitely lived up to its name. I was completely confused! But after taking the time to understand it, I moved past that stage, and it turned out to be pretty interesting. 1/3 #DataScienceandAnalytics

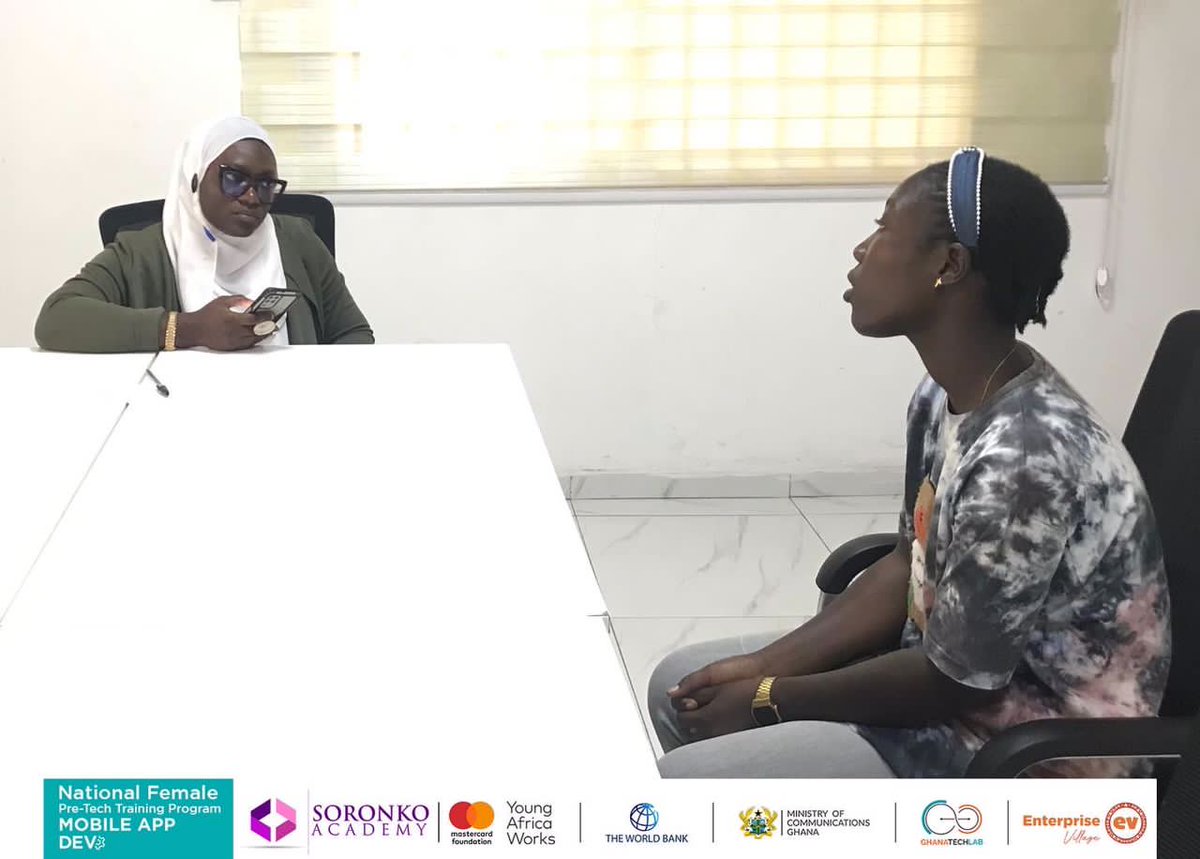
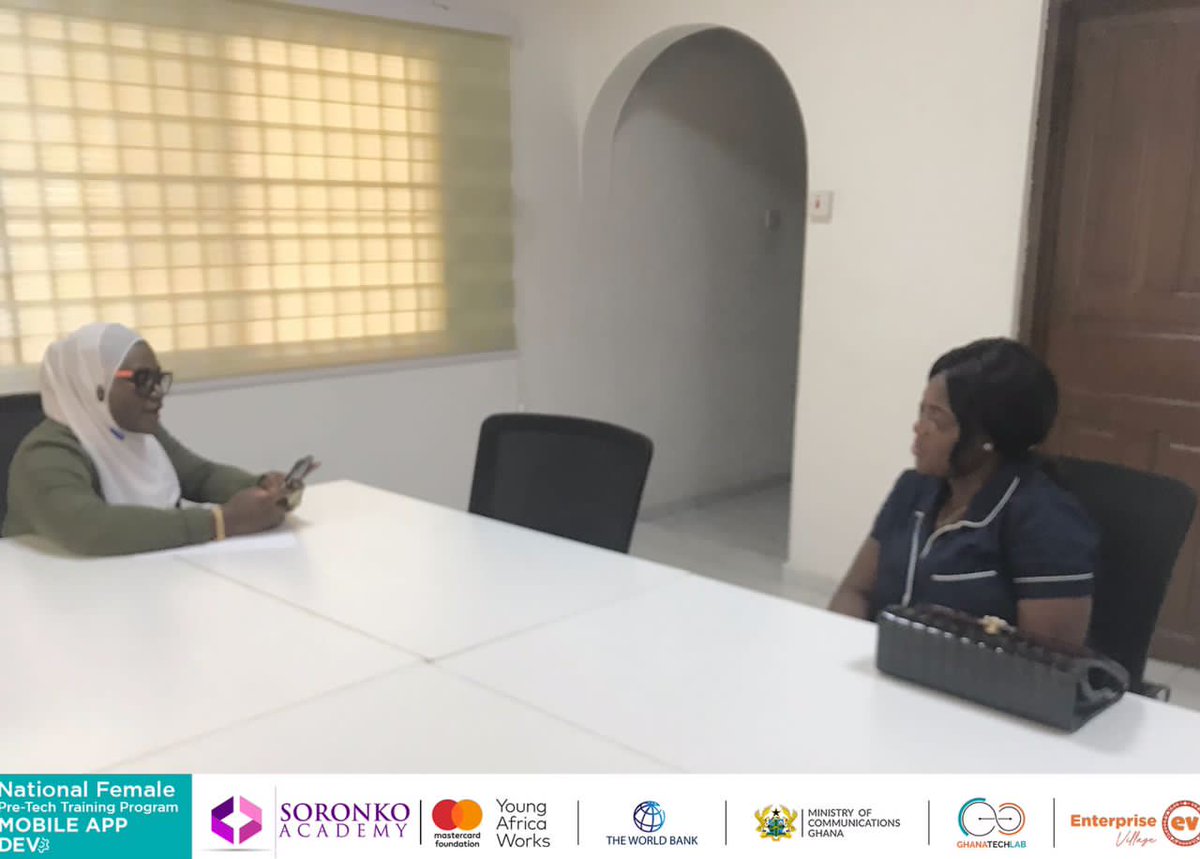
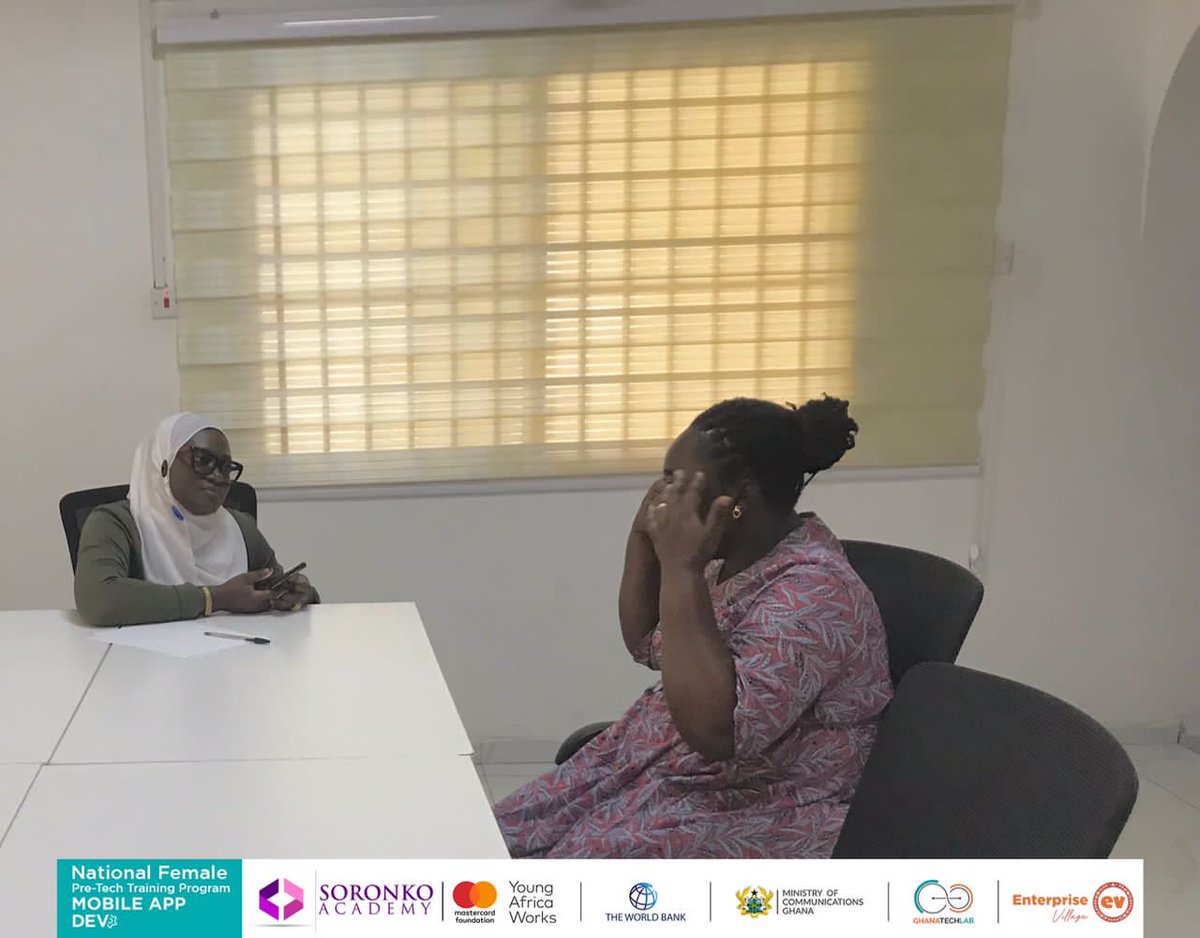
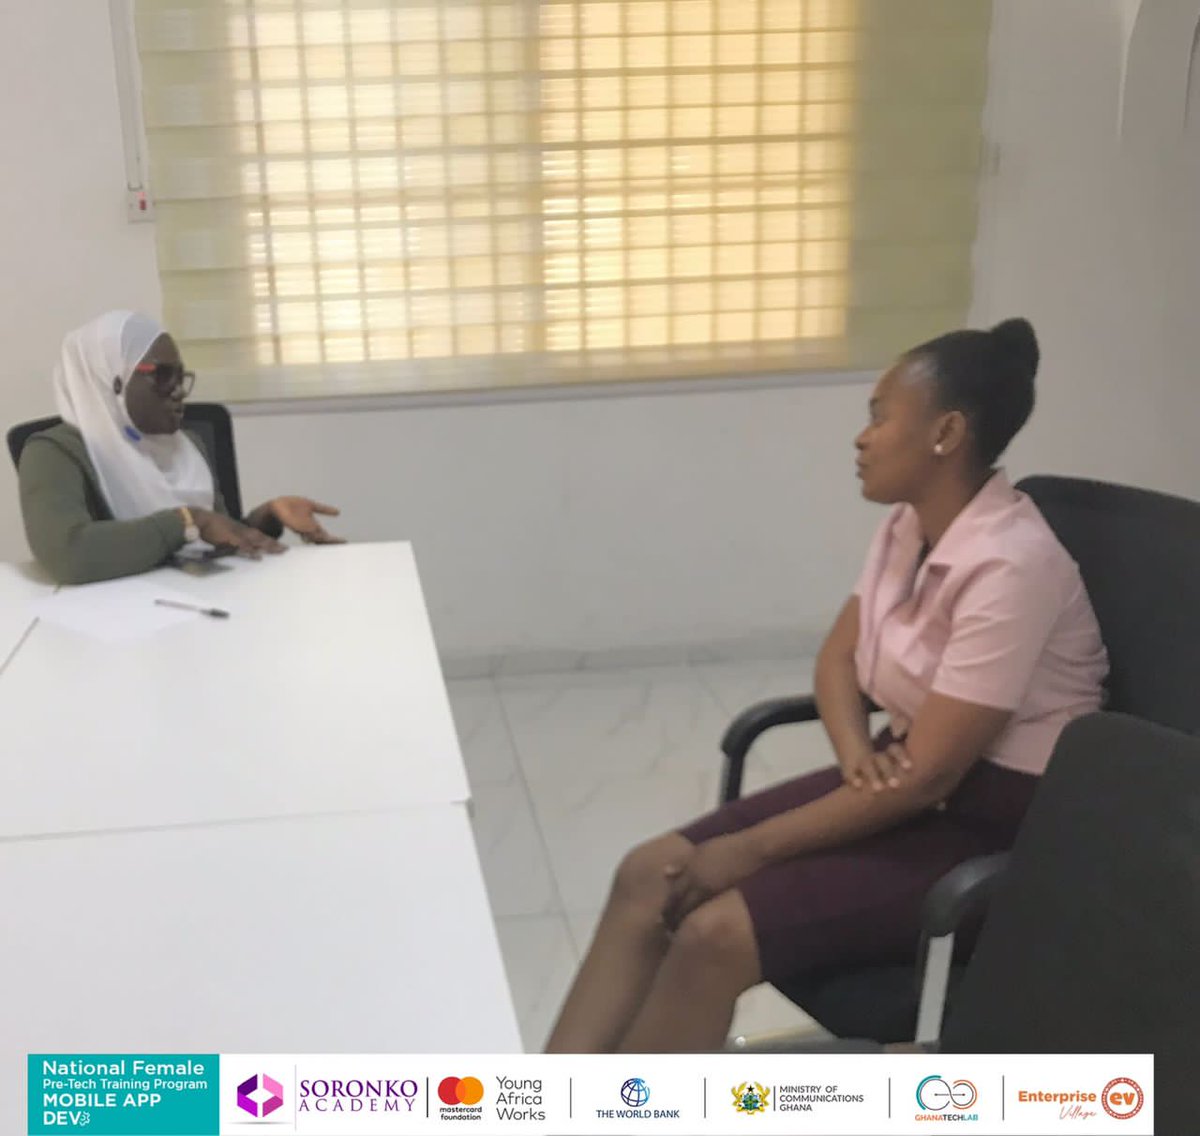
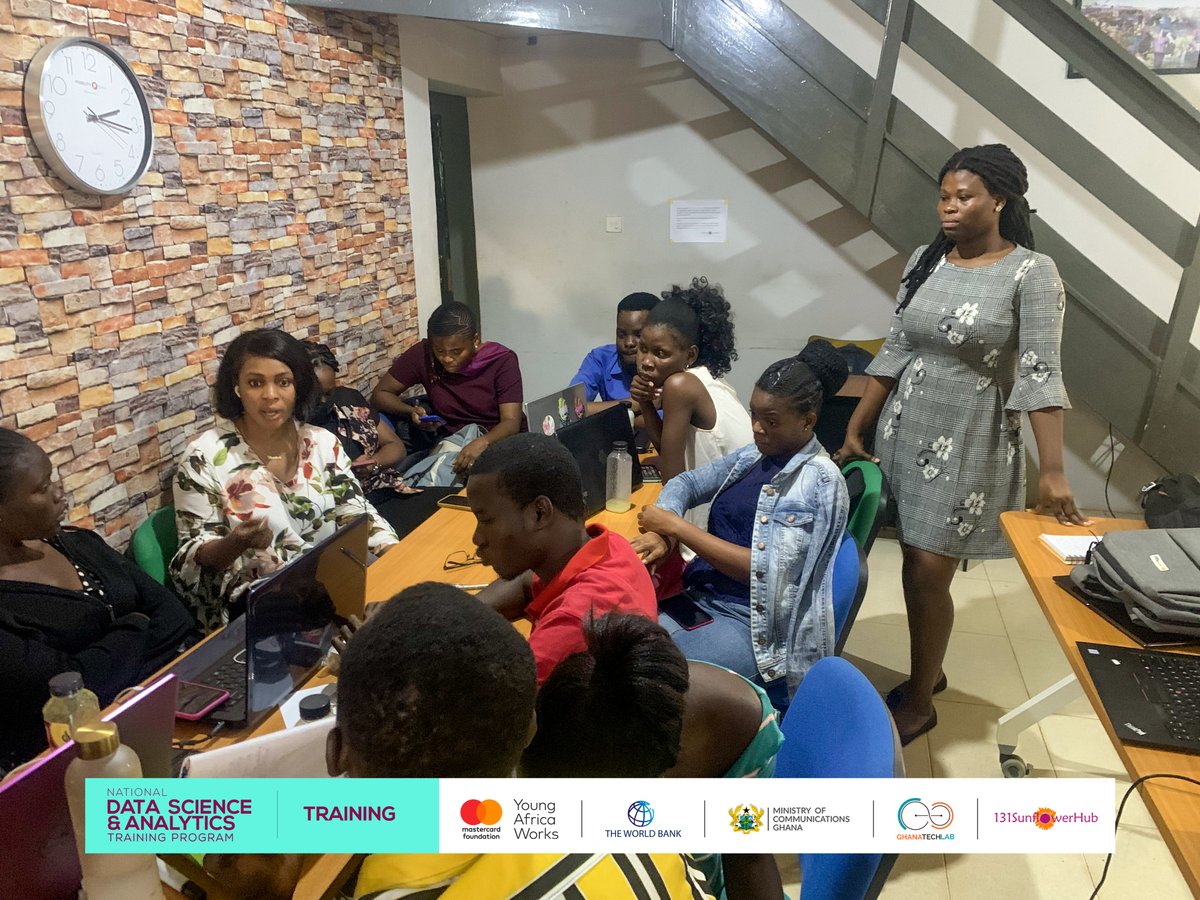
Interviews for the upcoming National Female PreTech Training Program in Data Science and Analytics commenced today. They assured us maximum commitment to the training once it begins. #GTLImpact #PreTechtraining #DataScienceAndAnalytics #YoungAfricanWorks #soronkoimpact
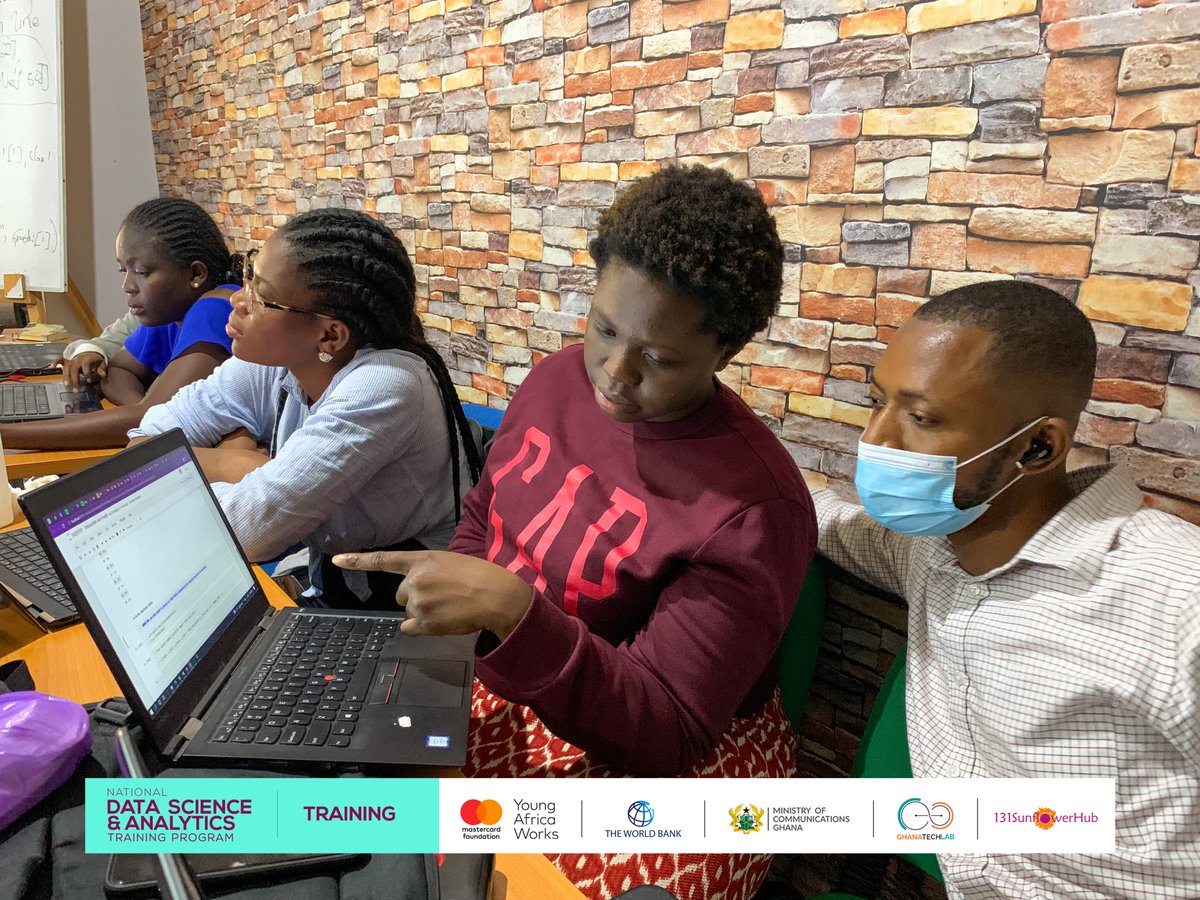
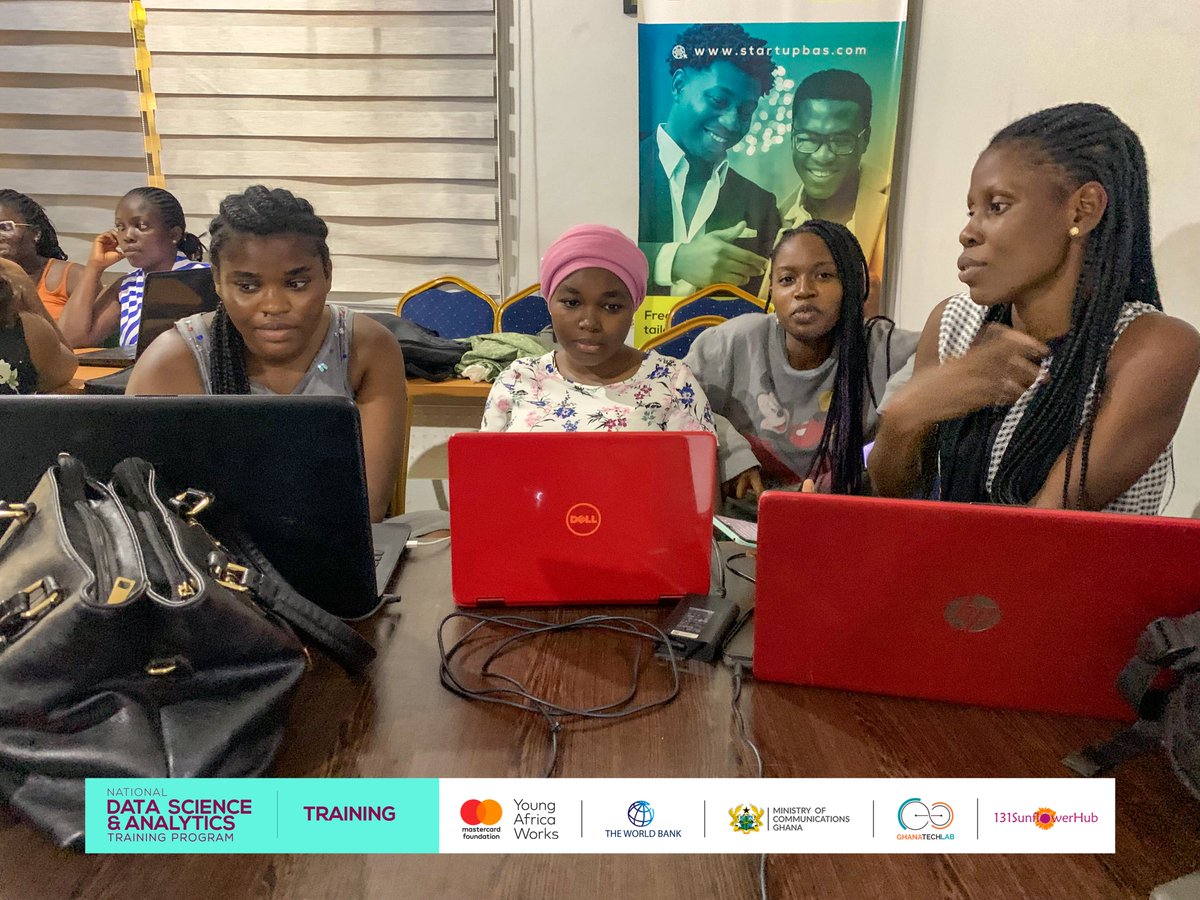
A #database is an organized collection of data. Trainees in today's class learnt the types of Databases, Database Management systems and #MySQL. #datascienceandanalytics #DataScience #Analytics #sunimpact #Python #datavisualization
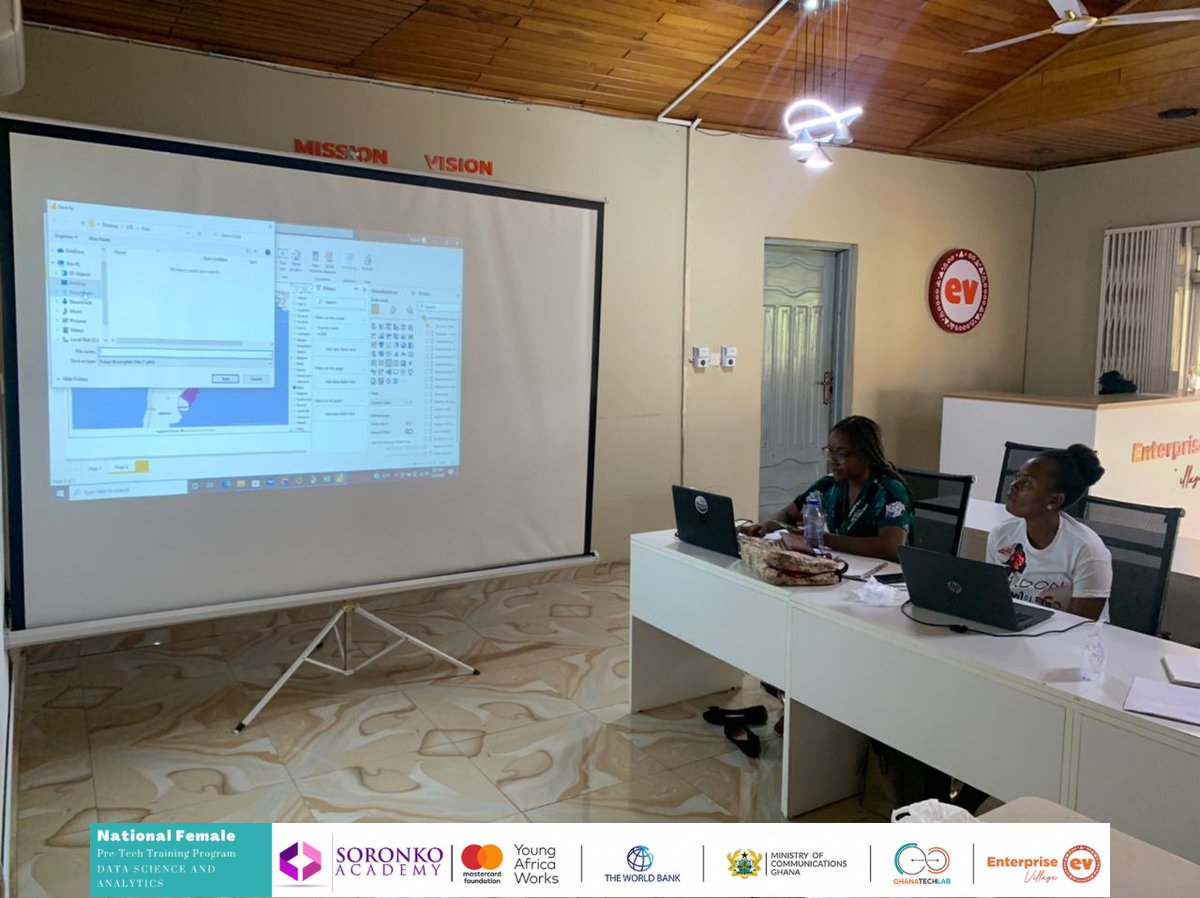
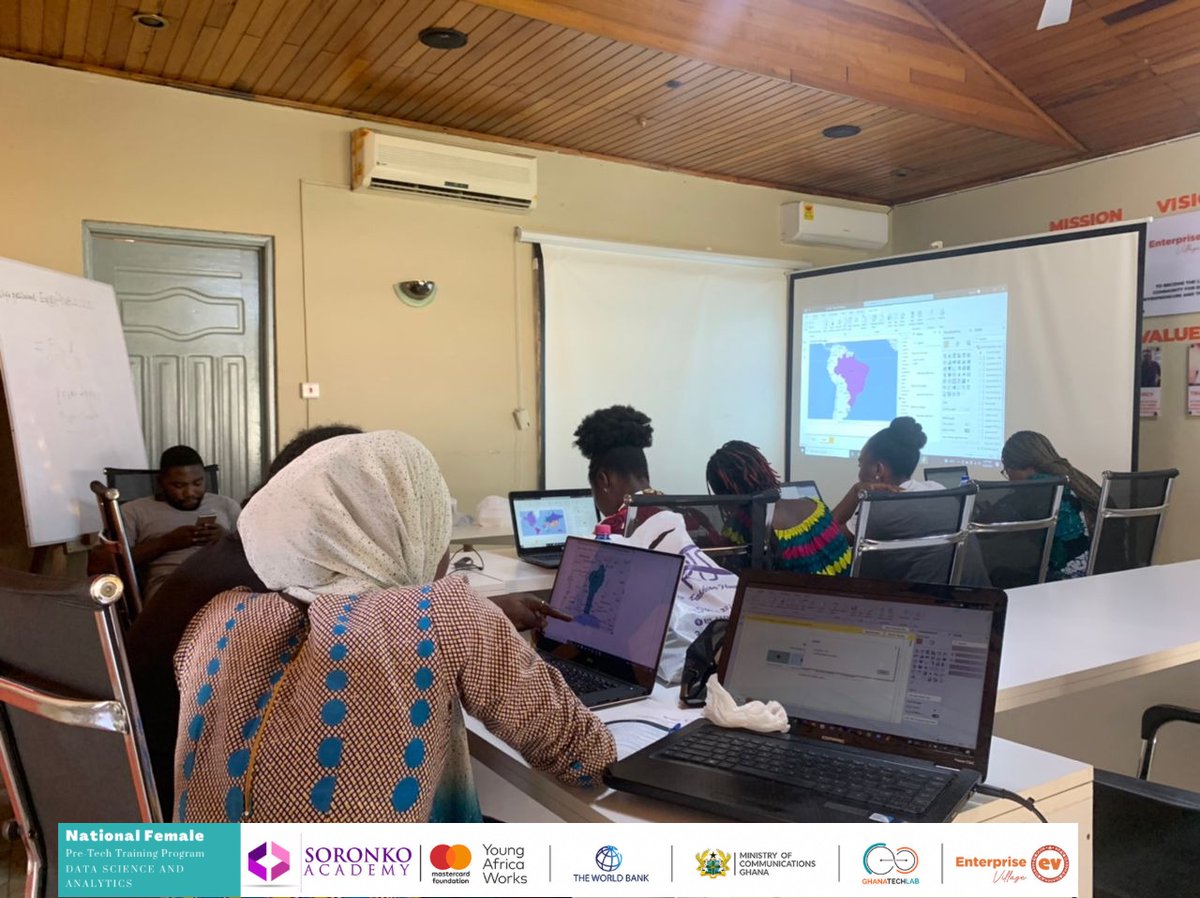
National Female Pre-tech training - Day 5 The trainer took the ladies through the visualization types in power bI. They learnt how to use the power bI with maps, and how to export a report to power bI #soronkoimpact #gtlimapct #datascienceandanalytics #evimpact

In yesterday's lesson, the trainees were introduced to Machine Learning and the life cycle of any Machine Learning project. 1/2 #datascienceandanalytics #DataScience #Analytics #machinelearning
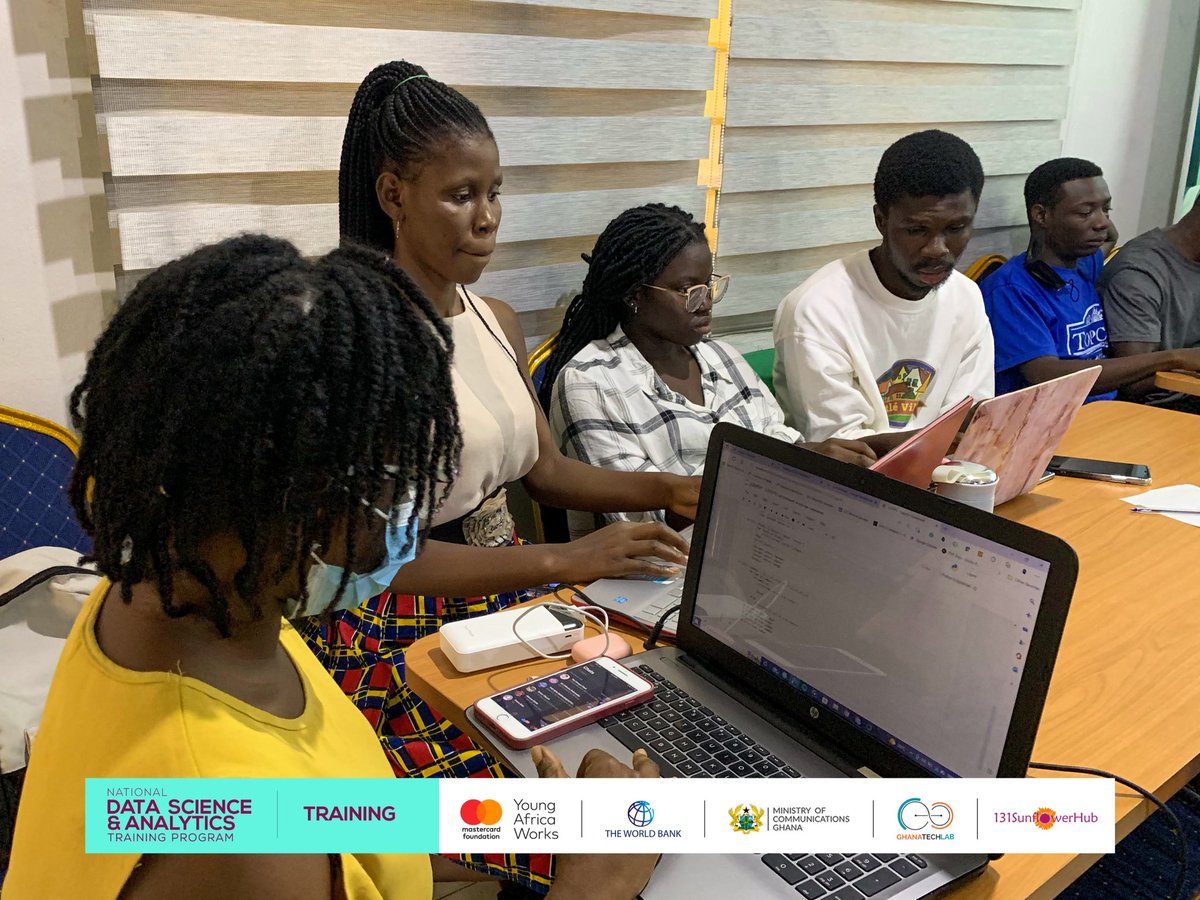
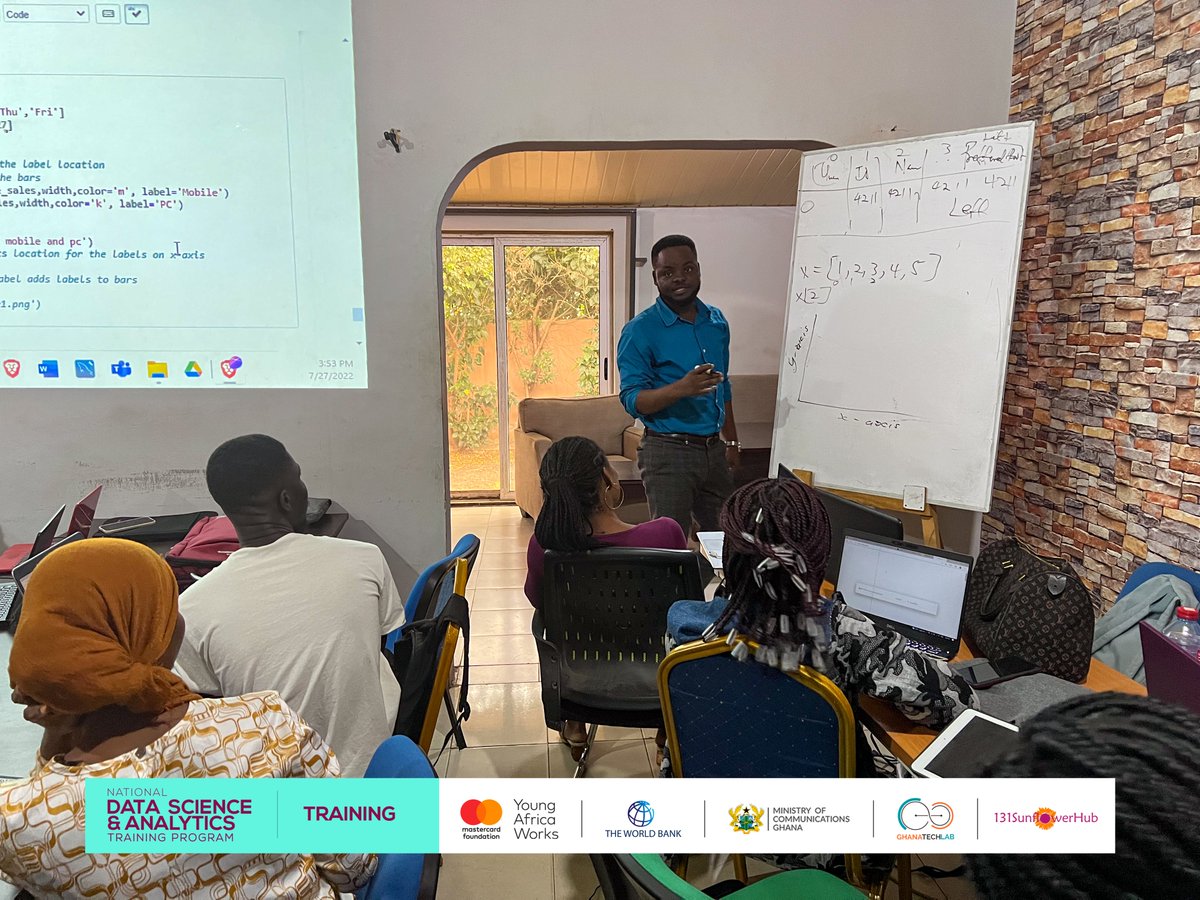
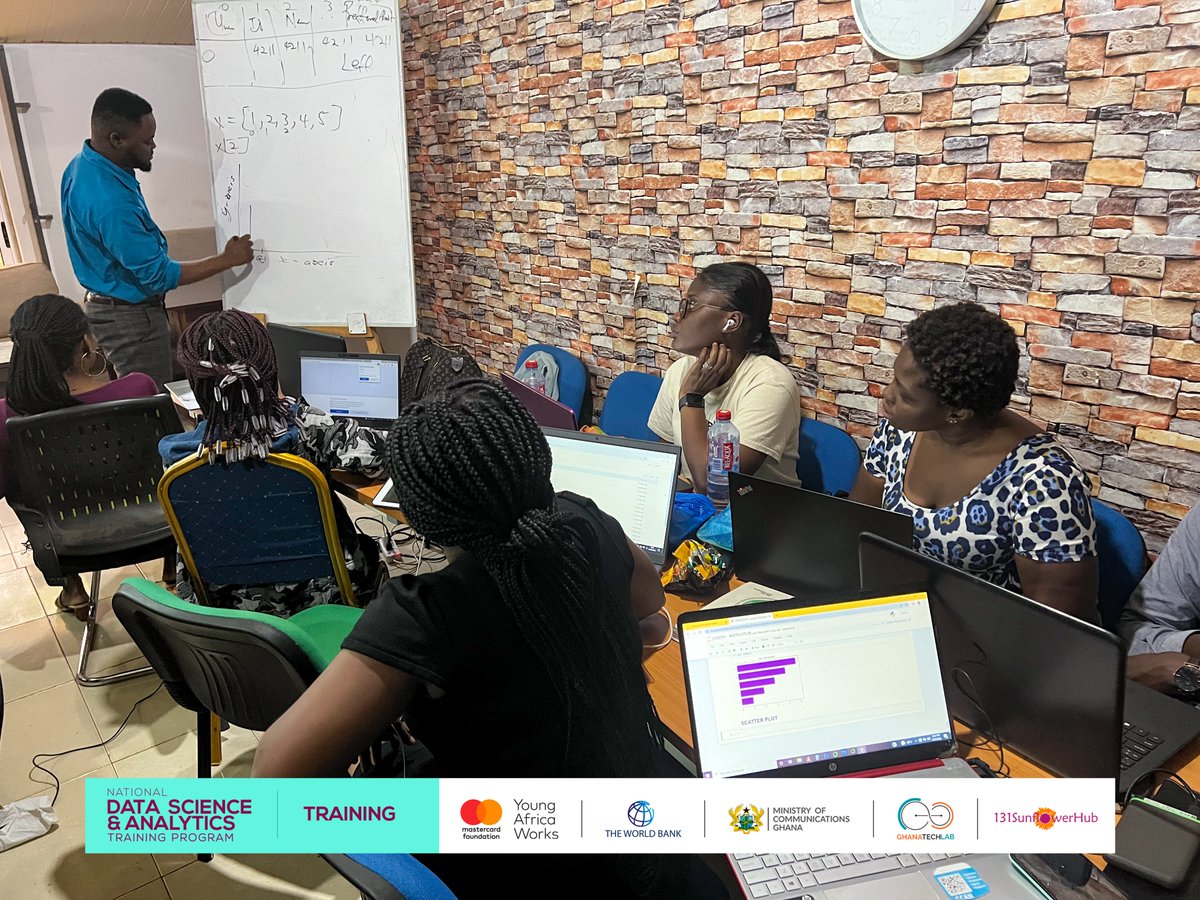
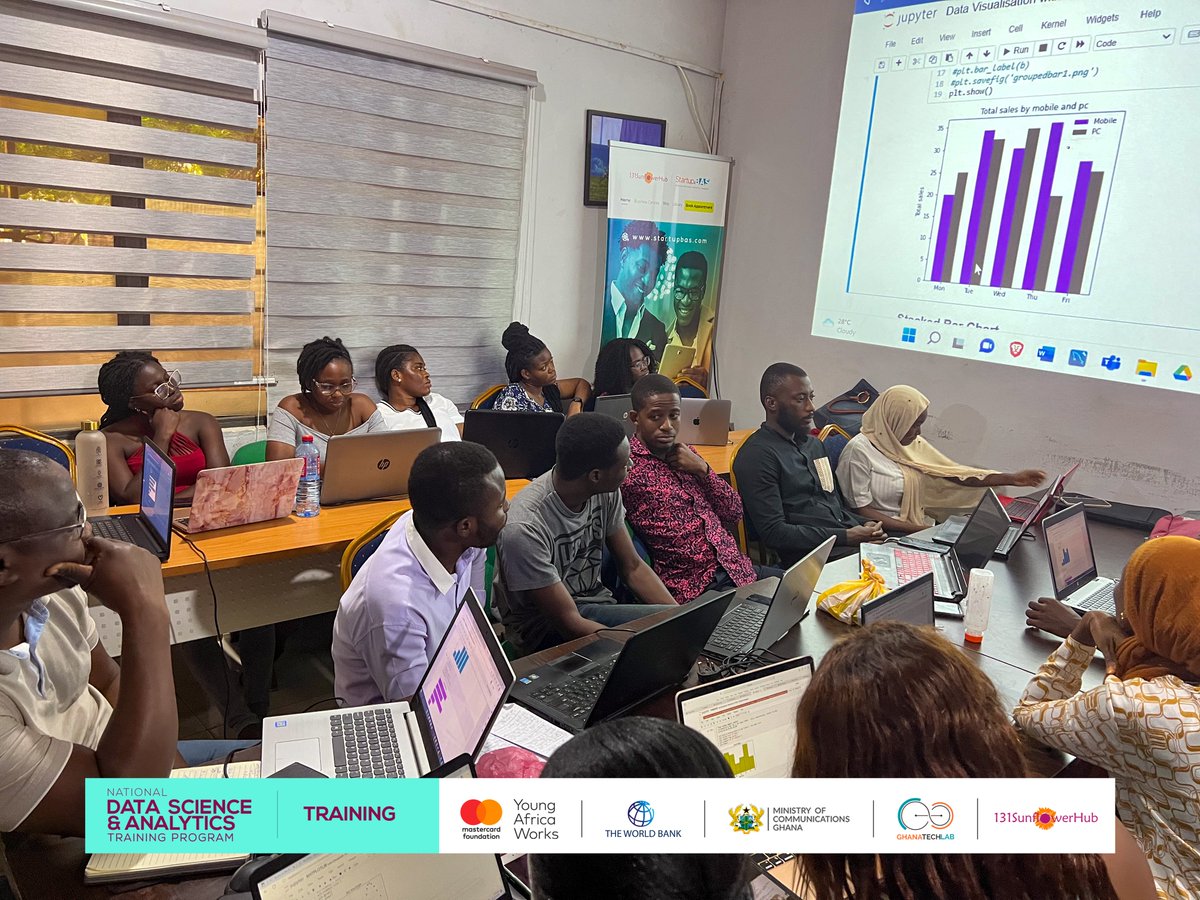
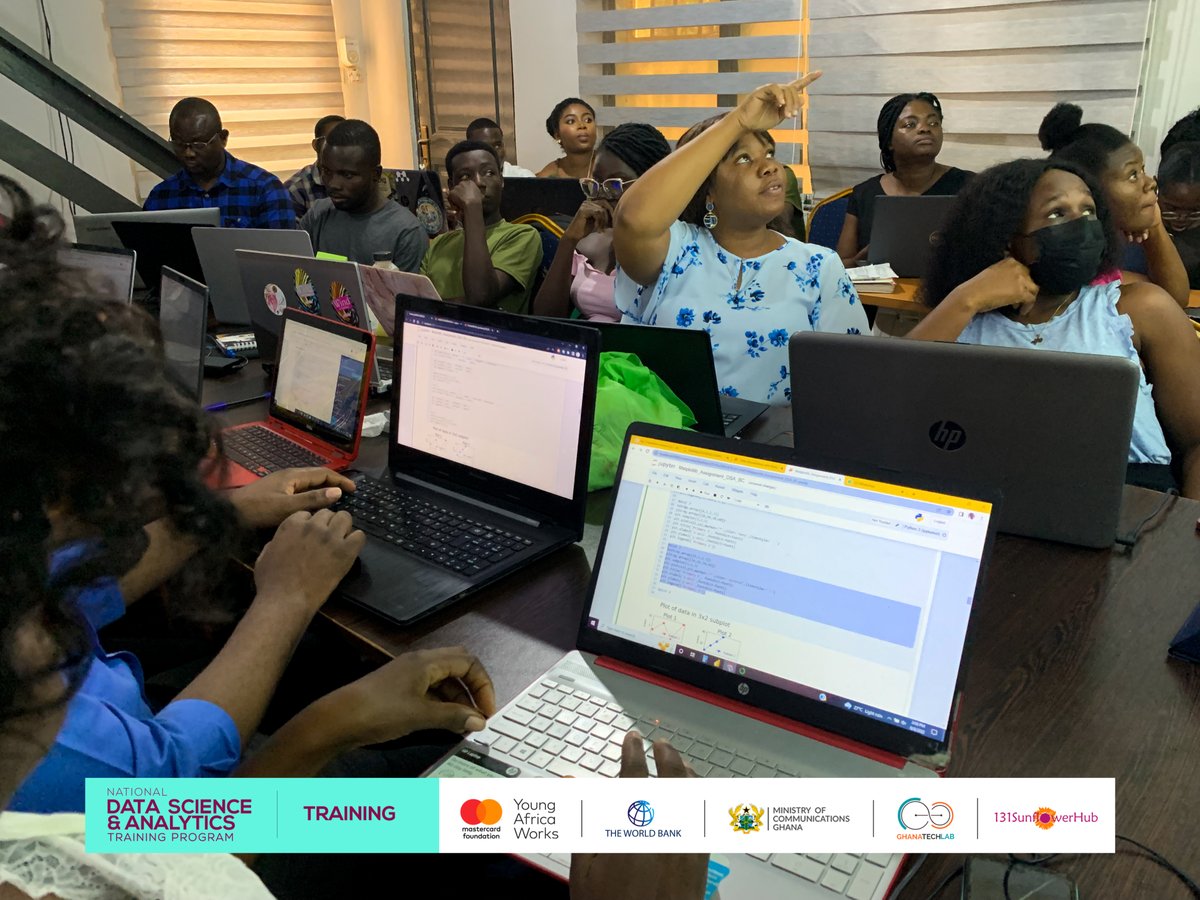
Today's training saw the trainees creating visualizations from scratch in #python using the #Matplotlib library. Some charts plotted include line plot, pie plot, bar plot, box plot, histogram plot, etc. #datascienceandanalytics #DataScience #Analytics #Python #datavisualization
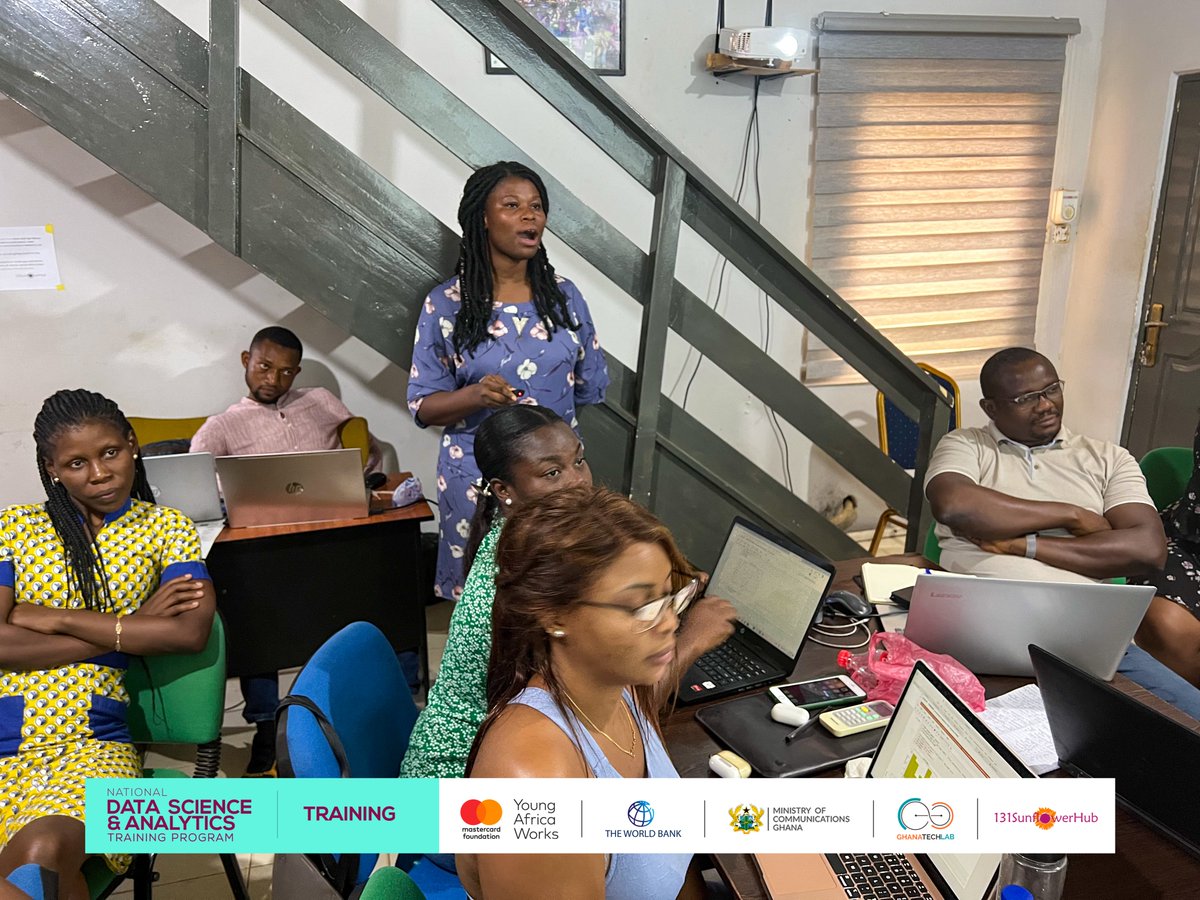
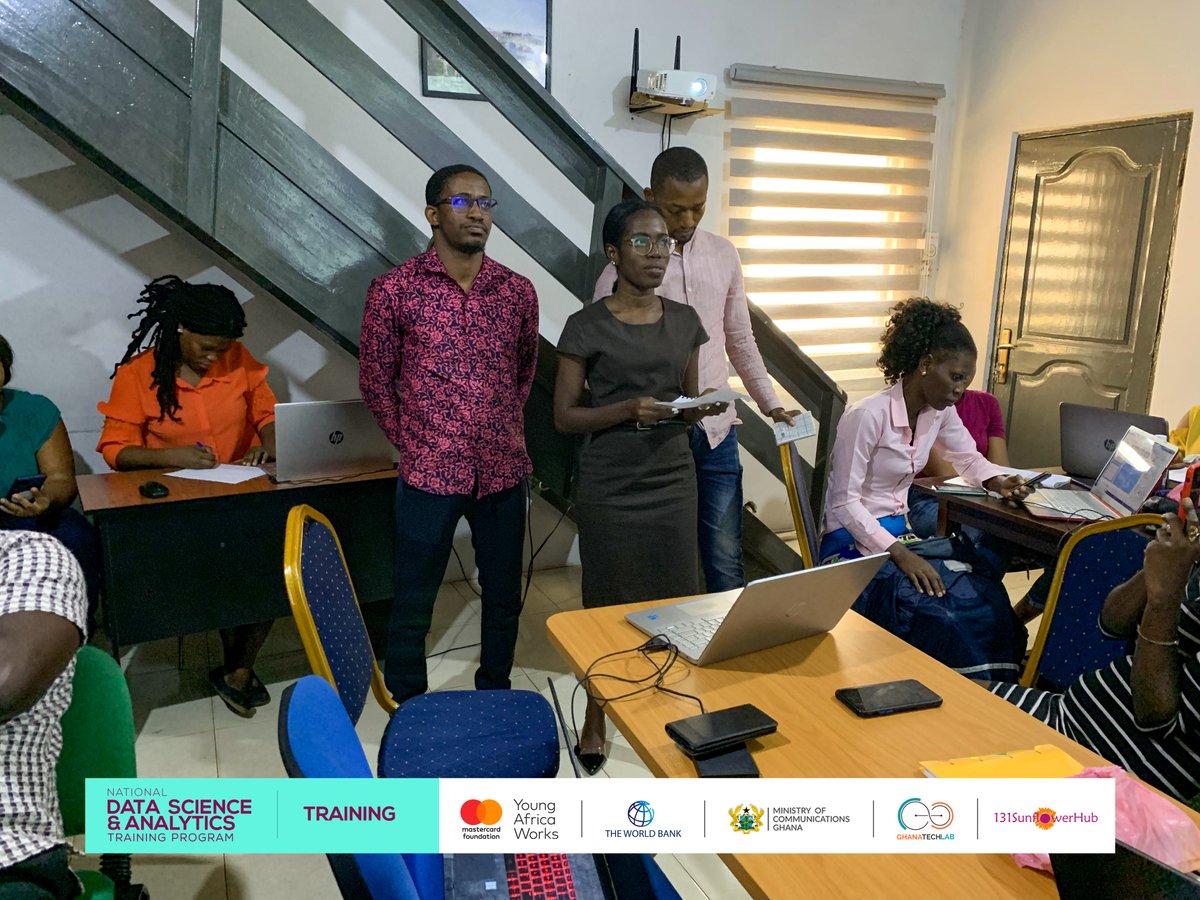
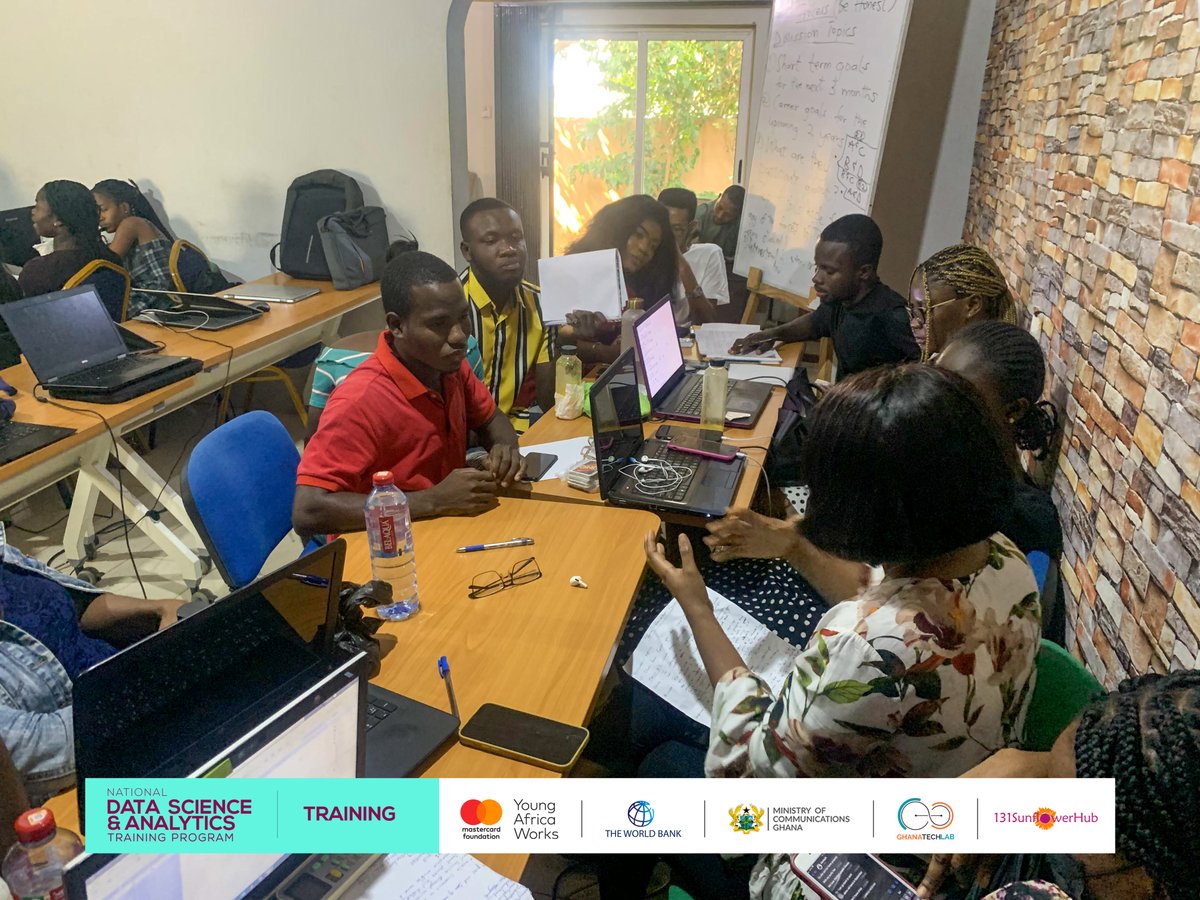
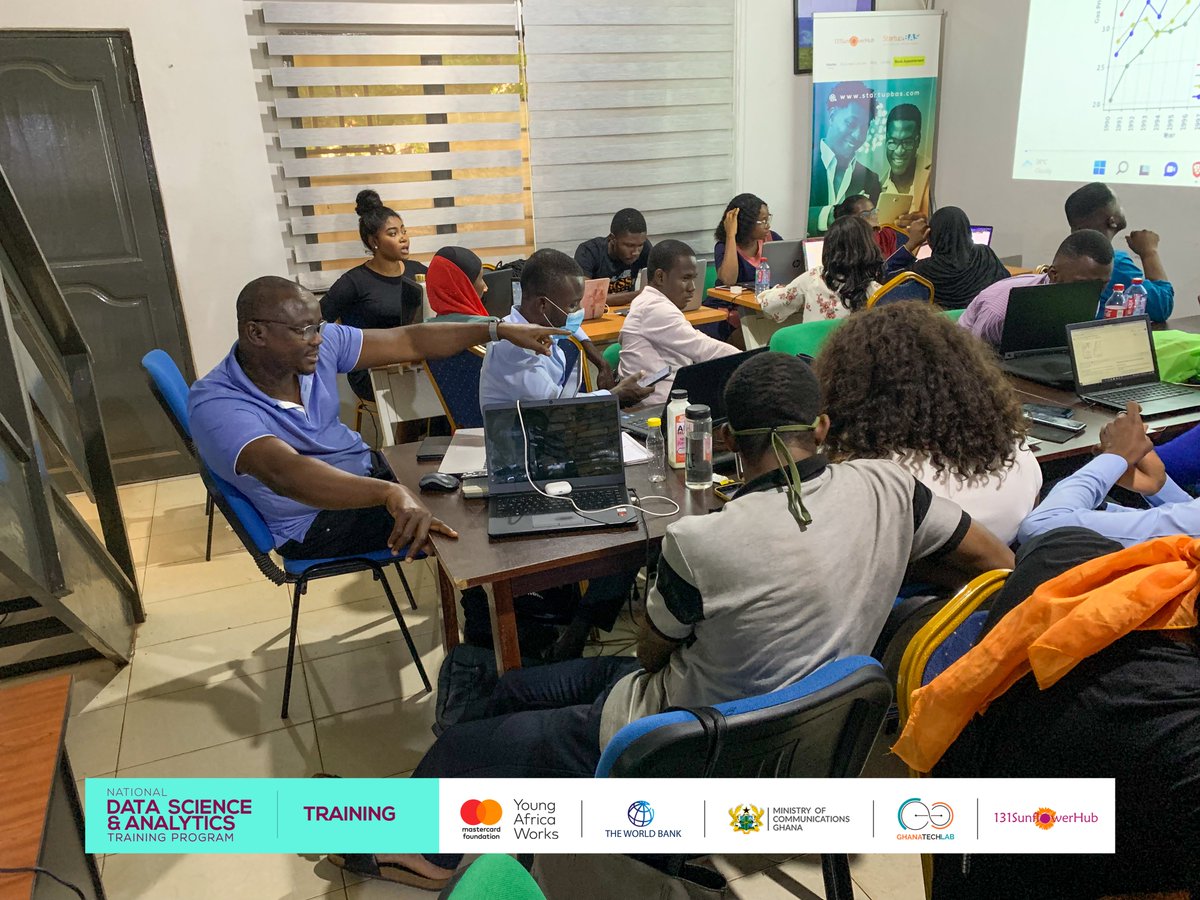
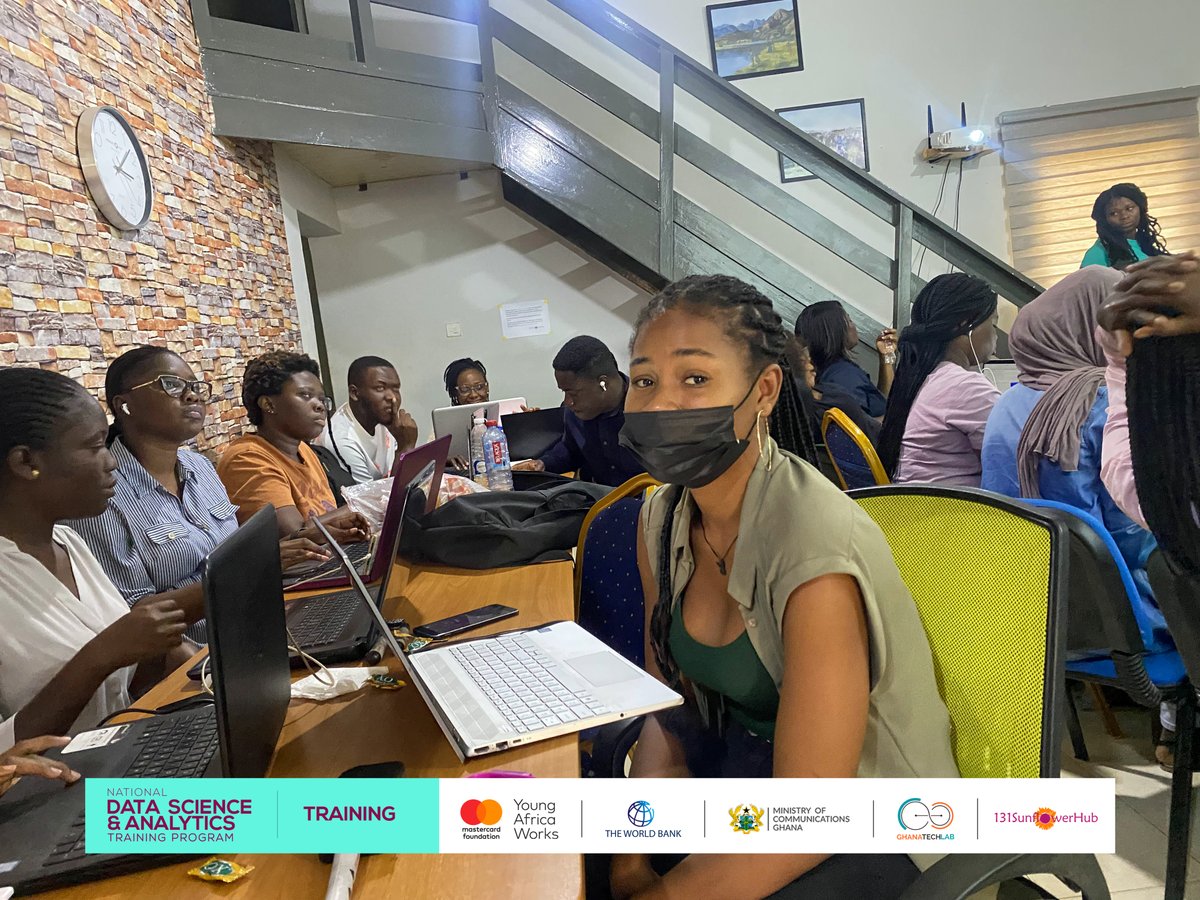
As they draw closer to the end of their training, trainees went through a team formation process; profiling other trainees, their short and long-term goals, top skills, and passions among others yesterday. #datascienceandanalytics #teamworkmakesthedreamwork #teams
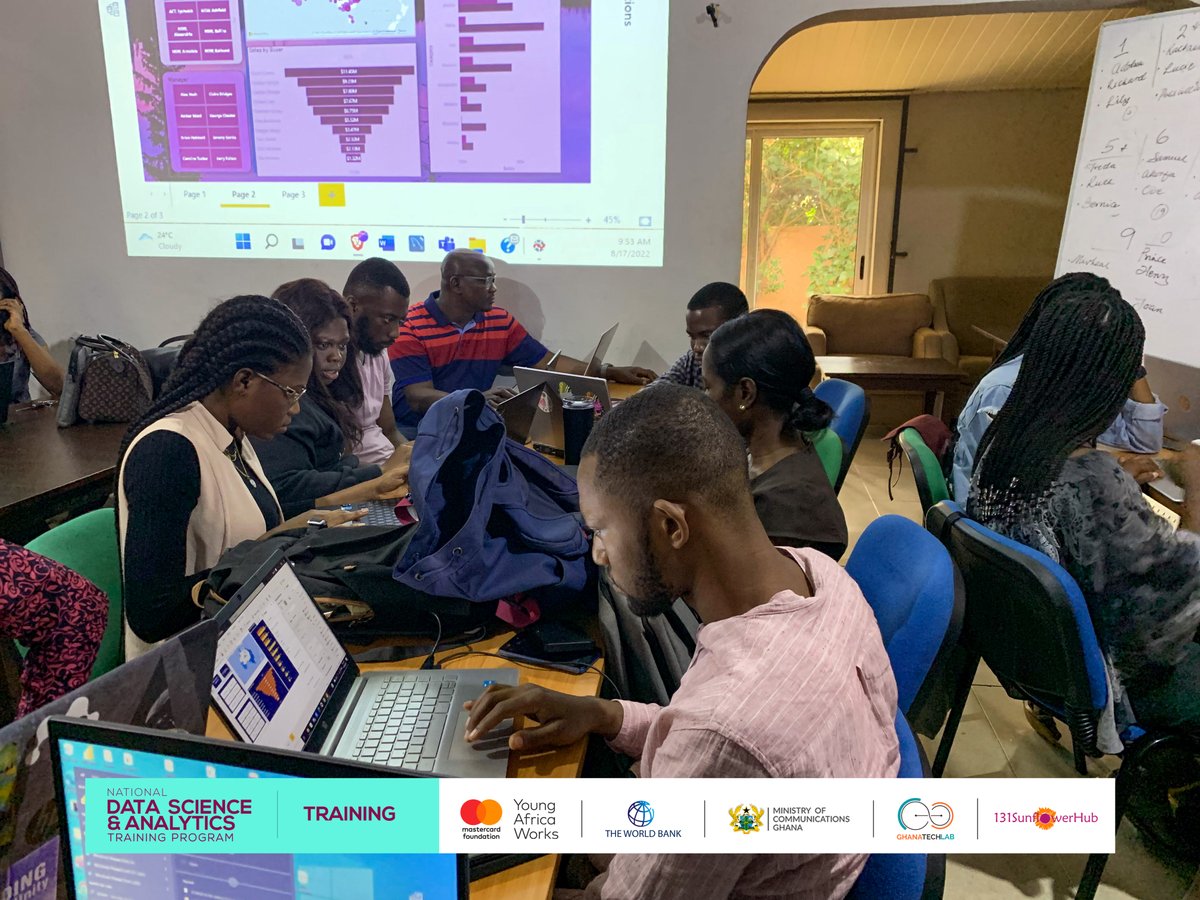
We're in the last week of training, and today the trainees were taken through creating a retail analytics dashboard to derive actionable insights for a retail company with identified metrics using #PowerBI. #datascienceandanalytics #DataScience #Analytics #datavisualization

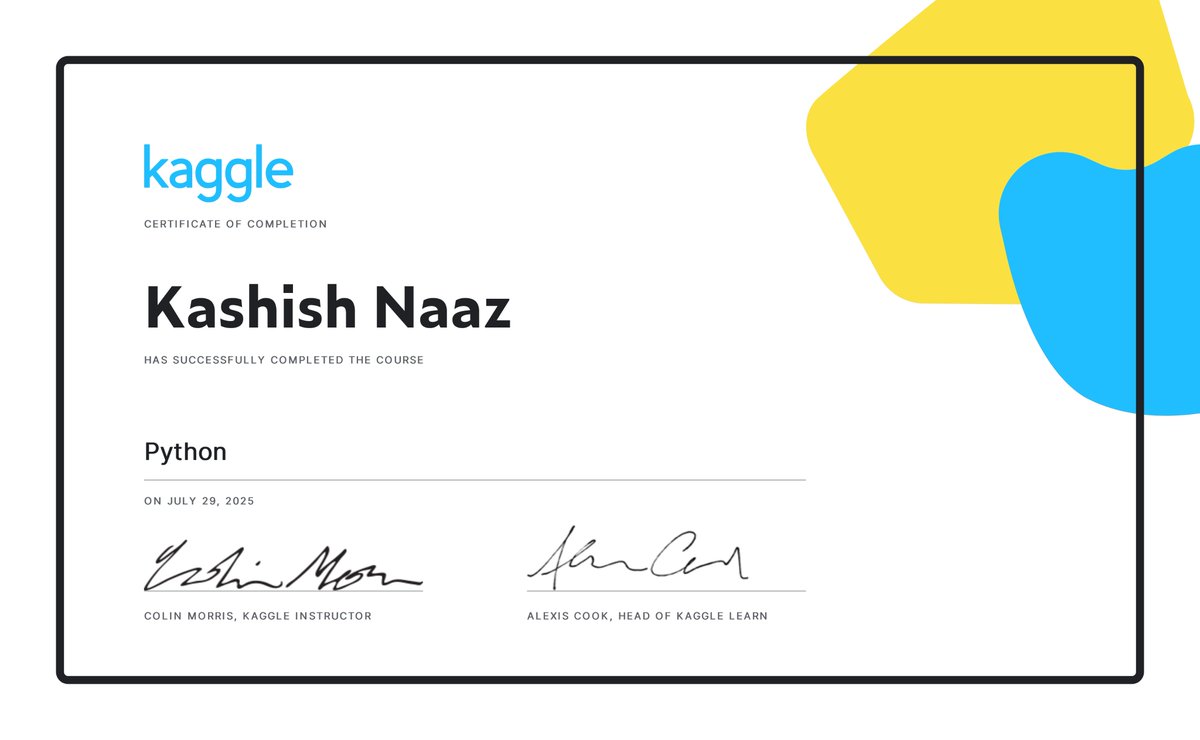
statistics = week 4 python= mini course done pandas = solve leetcode challenge EDA= 1/2 all update my data science journey.... #DataScientist #datascienceandanalytics @KaggleCareers @kaggle @womeninkaggle I've completed the Python course on Kaggle! kaggle.com/learn/certific…
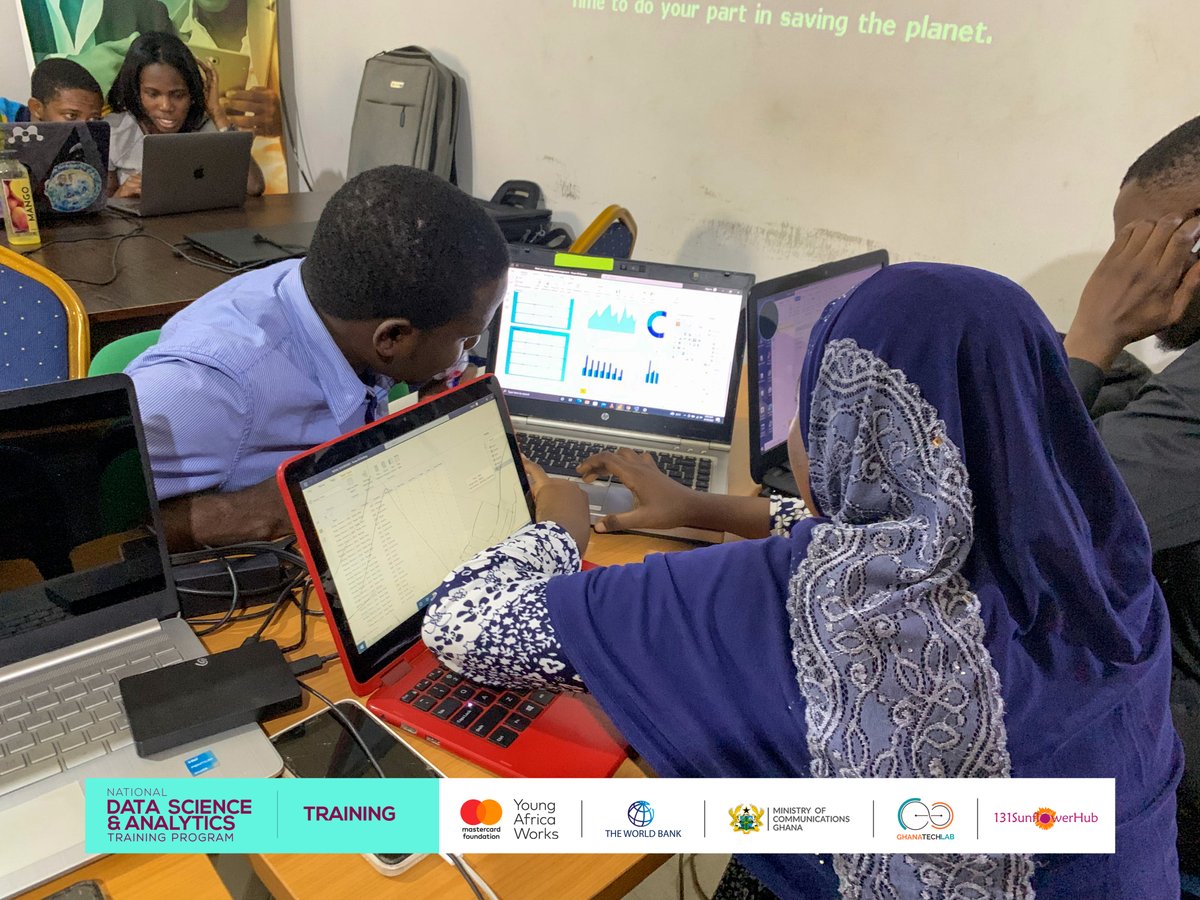
In the data visualization class today, trainees were taken through Data Analysis Expressions(DAX) queries for calculated columns in #PowerBI. #datascienceandanalytics #DataScience #Analytics #datavisualization #DAX
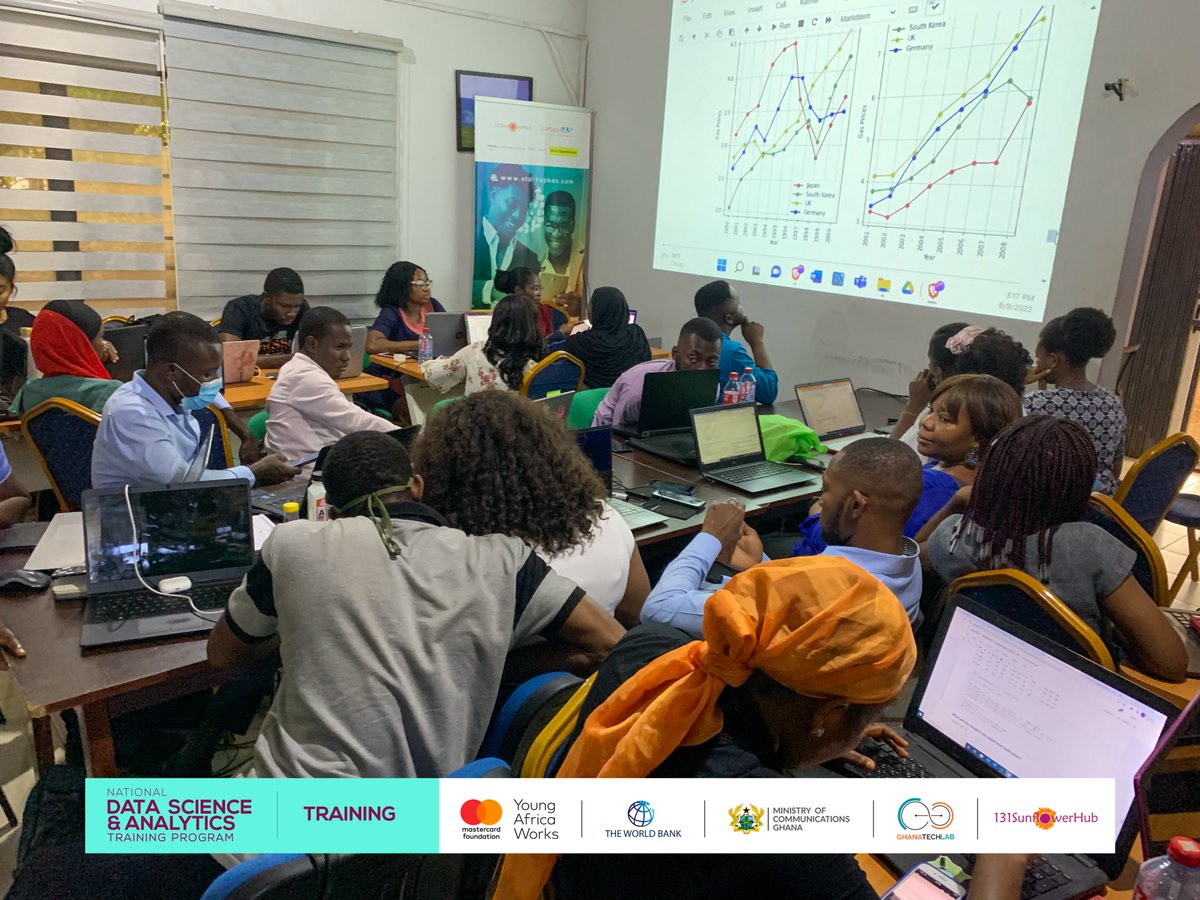
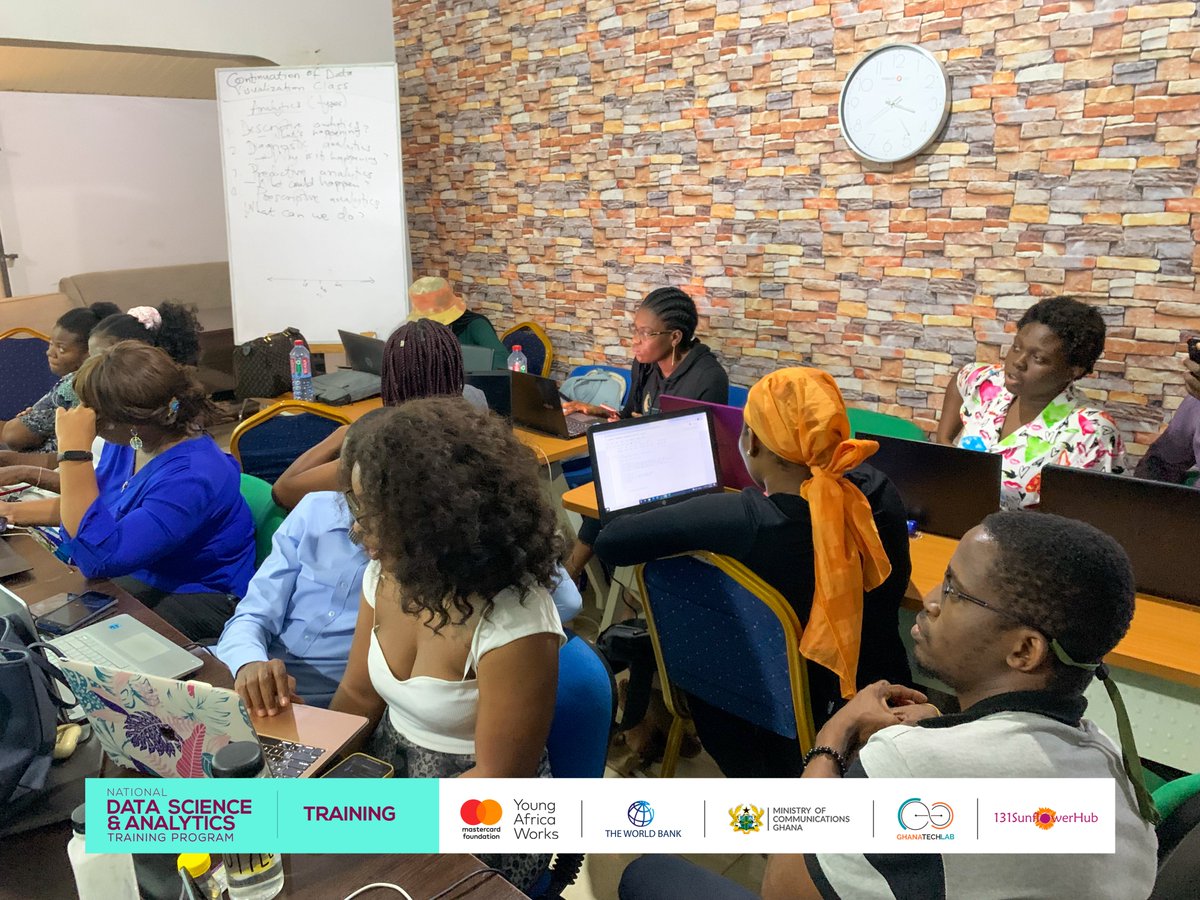
In today's lesson, the trainees created and reviewed #matplotlib visualizations with 2016 gas prices data of some countries. They also learnt about descriptive, diagnostic, predictive and prescriptive analysis. #datascienceandanalytics #DataScience #Analytics #datavisualization

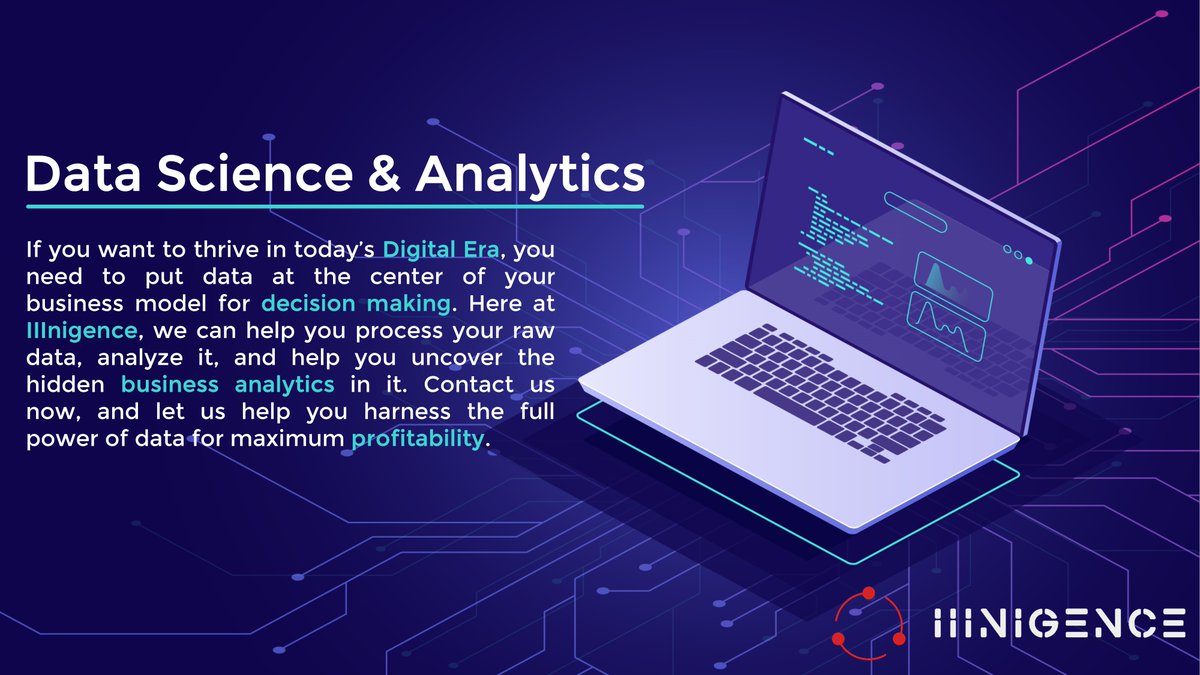
Do you want to conquer the industry and lead the competition? Acquire our Data Science & Analytics services to get valuable business insights for making well-informed & calculated decisions before your competitors! #datascience #dataanalytics #datascienceandanalytics #datamining
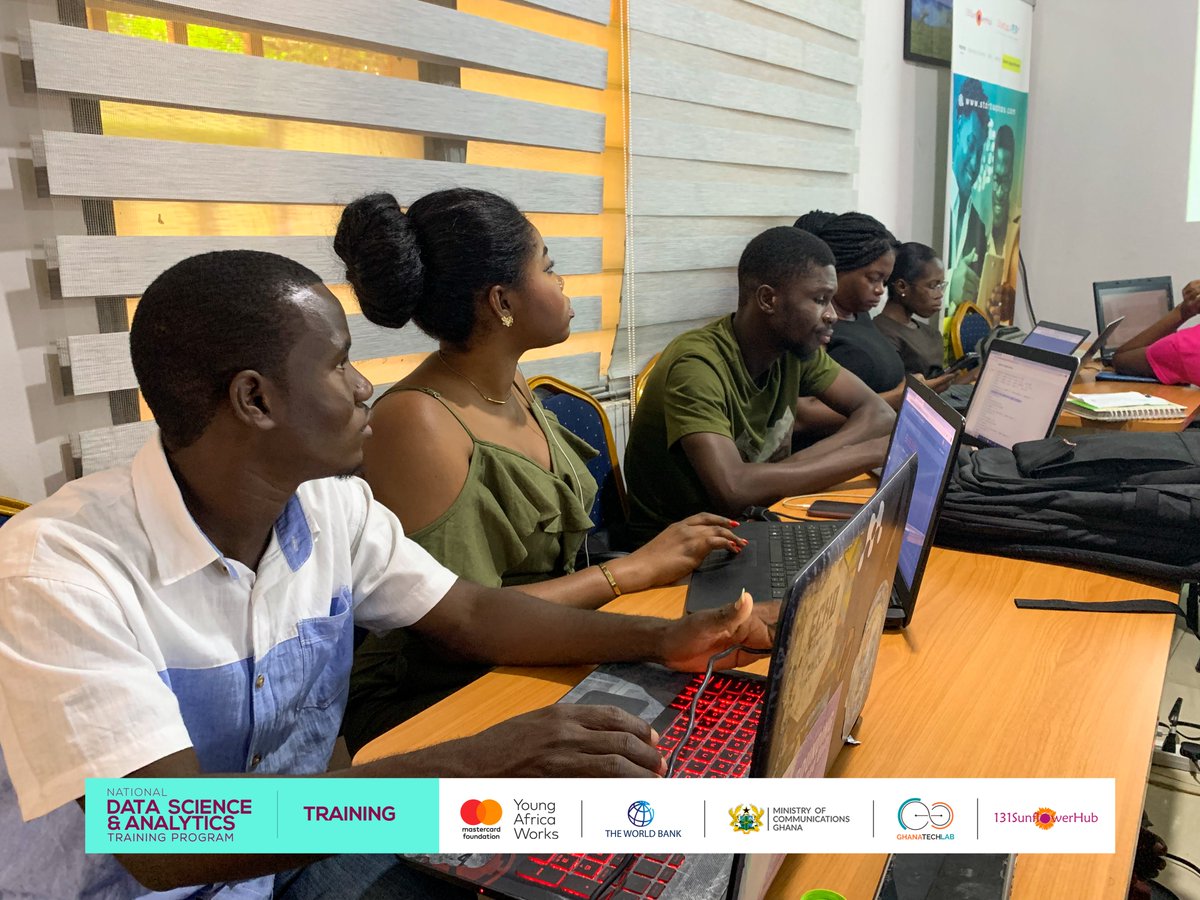
In today's Data Science & Analytics class, trainees worked and reviewed some data visualizations using #python #Matplotlib library. #datascienceandanalytics #DataScience #Analytics #Python #datavisualization
Too much data can be just as dangerous as not enough. Let’s talk about data overload and why it's causing decision paralysis in most businesses. 🧵 A thread on how to fix it. #DataScienceandAnalytics #DataDrivenBusiness
6. df.shape: Shows dataset size (rows, cols). Also, it helps you to quickly gauge your data volume. 7. df.dtypes: Check data types by column. Useful before: Cleaning, Converting types, and Plotting That’s it! Save this thread for your next project. #DataScienceandAnalytics
statistics = week 4 python= mini course done pandas = solve leetcode challenge EDA= 1/2 all update my data science journey.... #DataScientist #datascienceandanalytics @KaggleCareers @kaggle @womeninkaggle I've completed the Python course on Kaggle! kaggle.com/learn/certific…
Businesses don’t fail from lack of data. They fail from too much of it, with no clarity. If your team is stuck in “analysis paralysis,” it’s not a data problem. It’s a decision problem. #DataScienceandAnalytics
Too much data can be just as dangerous as not enough. Let’s talk about data overload and why it's causing decision paralysis in most businesses. 🧵 A thread on how to fix it. #DataScienceandAnalytics #DataDrivenBusiness
Confusion Matrix? At first, it definitely lived up to its name. I was completely confused! But after taking the time to understand it, I moved past that stage, and it turned out to be pretty interesting. 1/3 #DataScienceandAnalytics

Olx is hiring a Principal Data Scientist | Pricing #DataScienceandAnalytics #Fulltime #Germany #hiring #jobs 👇 arbeitnow.com/jobs/companies…
Want to work as Principal Data Scientist | Pricing? #DataScienceandAnalytics #Fulltime #Germany #hiring #jobs 👇 arbeitnow.com/jobs/companies…
Olx is hiring a Principal Data Scientist | Pricing #DataScienceandAnalytics #Fulltime #Germany #hiring #jobs 👇 arbeitnow.com/jobs/companies…

I'm super excited to be a part of this innovative journey with @ForvisMazarsNG as a member of Team RiskRover. @jay_hunts #InnovateWithForvisMazars #TeamRiskrover #Datascienceandanalytics
Olx is hiring a Principal Data Scientist | Pricing #DataScienceandAnalytics #Fulltime #Germany #hiring #jobs 👇 arbeitnow.com/jobs/companies…
Data Science and Analytics Undergraduate Program Info Session w @fenssabanci👩💻 📊 #newprogram #datascienceandanalytics
𝗛𝗼𝘄 𝗗𝗮𝘁𝗮 𝗦𝗰𝗶𝗲𝗻𝗰𝗲 𝗮𝗻𝗱 𝗔𝗻𝗮𝗹𝘆𝘁𝗶𝗰𝘀 𝗪𝗶𝗹𝗹 𝗦𝗵𝗮𝗽𝗲 𝘁𝗵𝗲 𝗙𝘂𝘁𝘂𝗿𝗲 𝗼𝗳 𝗪𝗼𝗿𝗸 tinyurl.com/hv4dehpf #DataScienceandAnalytics #DataScience #DataAnalytics #Analytics #DataScientist #AI #AINews #AnalyticsInsight #AnalyticsInsightMagazine


About to start a 'Tech School'..'Ideas be rolling,would definitely need some insight'..#CloudComputing, #DataScienceAndAnalytics, #ArtficialIintelligence, #UI/UX, #Blockchaintechnology, #FrontAndBackend, #CodePlateau, #PPMFoundation. #GoogleAfrica, #Microsoft365.
Data Science and Analytics Undergraduate Program Info Session w @fenssabanci👩💻 📊 #newprogram #datascienceandanalytics
Interviews for the upcoming National Female PreTech Training Program in Data Science and Analytics commenced today. They assured us maximum commitment to the training once it begins. #GTLImpact #PreTechtraining #DataScienceAndAnalytics #YoungAfricanWorks #soronkoimpact
National Female Pre-tech training - Day 5 The trainer took the ladies through the visualization types in power bI. They learnt how to use the power bI with maps, and how to export a report to power bI #soronkoimpact #gtlimapct #datascienceandanalytics #evimpact
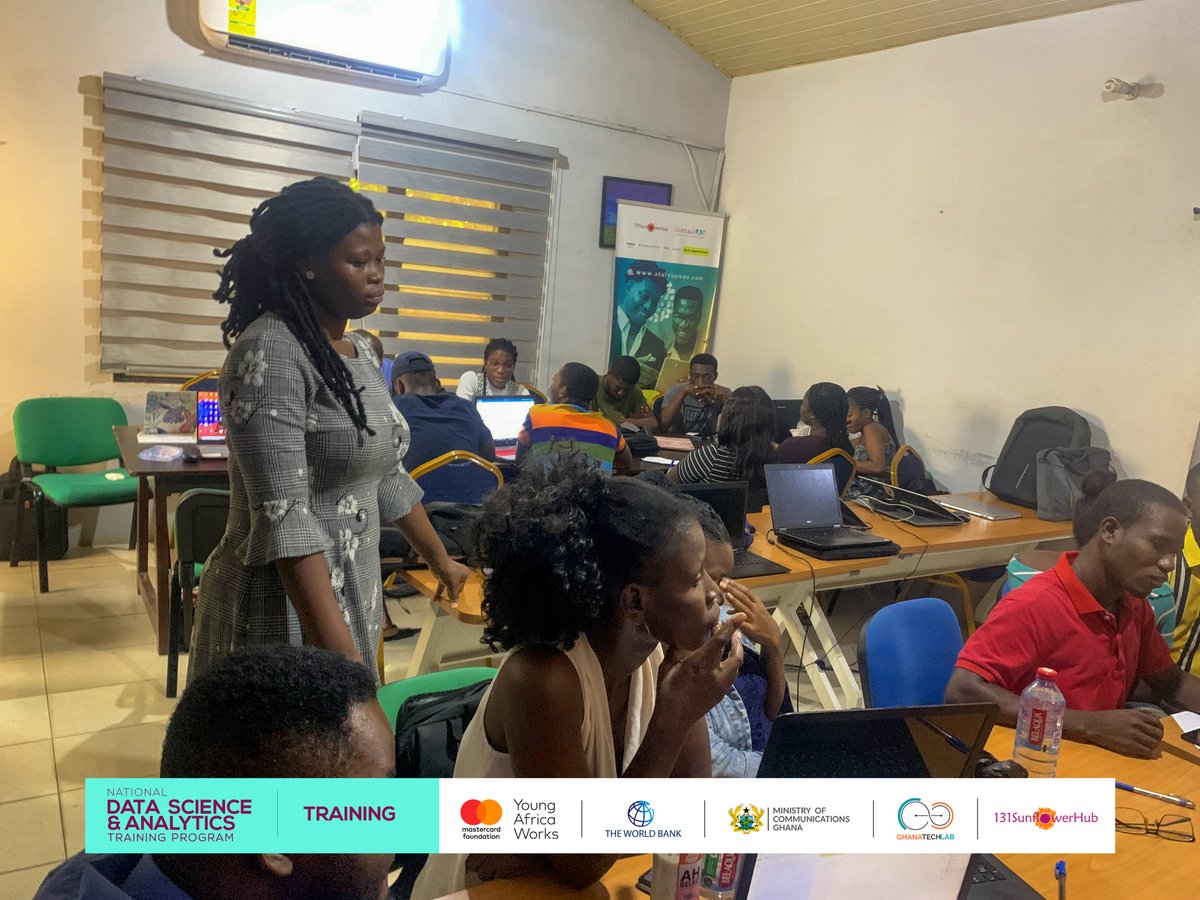
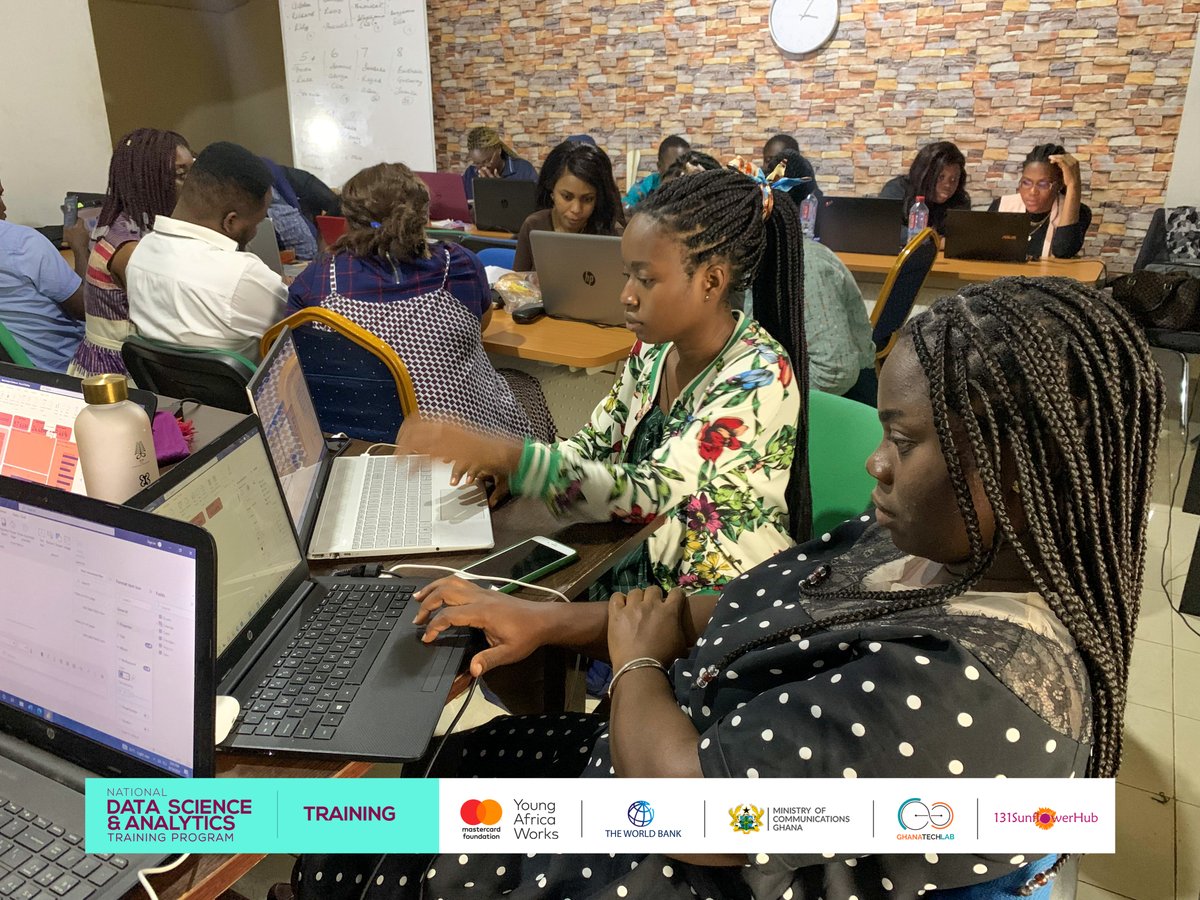
Here are excerpts of today's training where the participants reviewed some #pandas methods for analyzing data frames and got an introduction to python #Matplotlib library. #datascienceandanalytics #DataScience #Analytics #sunimpact #Python #datavisualization
A #database is an organized collection of data. Trainees in today's class learnt the types of Databases, Database Management systems and #MySQL. #datascienceandanalytics #DataScience #Analytics #sunimpact #Python #datavisualization
In yesterday's lesson, the trainees were introduced to Machine Learning and the life cycle of any Machine Learning project. 1/2 #datascienceandanalytics #DataScience #Analytics #machinelearning
Do you want to conquer the industry and lead the competition? Acquire our Data Science & Analytics services to get valuable business insights for making well-informed & calculated decisions before your competitors! #datascience #dataanalytics #datascienceandanalytics #datamining
In our data visualization class yesterday, trainees presented their findings from their analysis and visualization of Australian retail data. Presentations were done in groups and showcased great teamwork, data storytelling and collaboration skills. #datascienceandanalytics
Businesses don’t fail from lack of data. They fail from too much of it, with no clarity. If your team is stuck in “analysis paralysis,” it’s not a data problem. It’s a decision problem. #DataScienceandAnalytics
Confusion Matrix? At first, it definitely lived up to its name. I was completely confused! But after taking the time to understand it, I moved past that stage, and it turned out to be pretty interesting. 1/3 #DataScienceandAnalytics
Today's training saw the trainees creating visualizations from scratch in #python using the #Matplotlib library. Some charts plotted include line plot, pie plot, bar plot, box plot, histogram plot, etc. #datascienceandanalytics #DataScience #Analytics #Python #datavisualization
𝗛𝗼𝘄 𝗗𝗮𝘁𝗮 𝗦𝗰𝗶𝗲𝗻𝗰𝗲 𝗮𝗻𝗱 𝗔𝗻𝗮𝗹𝘆𝘁𝗶𝗰𝘀 𝗪𝗶𝗹𝗹 𝗦𝗵𝗮𝗽𝗲 𝘁𝗵𝗲 𝗙𝘂𝘁𝘂𝗿𝗲 𝗼𝗳 𝗪𝗼𝗿𝗸 tinyurl.com/hv4dehpf #DataScienceandAnalytics #DataScience #DataAnalytics #Analytics #DataScientist #AI #AINews #AnalyticsInsight #AnalyticsInsightMagazine
As they draw closer to the end of their training, trainees went through a team formation process; profiling other trainees, their short and long-term goals, top skills, and passions among others yesterday. #datascienceandanalytics #teamworkmakesthedreamwork #teams
We're in the last week of training, and today the trainees were taken through creating a retail analytics dashboard to derive actionable insights for a retail company with identified metrics using #PowerBI. #datascienceandanalytics #DataScience #Analytics #datavisualization
In the data visualization class today, trainees were taken through Data Analysis Expressions(DAX) queries for calculated columns in #PowerBI. #datascienceandanalytics #DataScience #Analytics #datavisualization #DAX
In today's lesson, the trainees created and reviewed #matplotlib visualizations with 2016 gas prices data of some countries. They also learnt about descriptive, diagnostic, predictive and prescriptive analysis. #datascienceandanalytics #DataScience #Analytics #datavisualization
In today's Data Science & Analytics class, trainees worked and reviewed some data visualizations using #python #Matplotlib library. #datascienceandanalytics #DataScience #Analytics #Python #datavisualization
The trainees reviewed a python pandas library assignment in today's lesson using wine review data. They were also segregated into groups to revise certain topics from previous lessons. #datascienceandanalytics #DataScience #Analytics #sunimpact #Python #datavisualization #Pandas

Something went wrong.
Something went wrong.
United States Trends
- 1. Wemby 10.9K posts
- 2. Maxey 7,583 posts
- 3. Maxey 7,583 posts
- 4. Sixers 18.9K posts
- 5. Clippers 7,484 posts
- 6. Embiid 12.1K posts
- 7. #AEWDynamite 20.8K posts
- 8. Knicks 31.1K posts
- 9. Celtics 25K posts
- 10. #Survivor49 2,355 posts
- 11. Cooper Flagg 8,371 posts
- 12. Pistons 5,934 posts
- 13. Pritchard 1,919 posts
- 14. Cavs 15.5K posts
- 15. #SistasOnBET 2,302 posts
- 16. #NewYorkForever 3,122 posts
- 17. 76ers 5,110 posts
- 18. Brunson 6,803 posts
- 19. Athena 8,264 posts
- 20. Donovan Mitchell 2,718 posts