#data_visualization ผลการค้นหา

تمثيل البيانات في power bi ... #powerpi #data_visualization #visualization #DataAnalytics #data_analysis #analysis #DataScience #تحليل_البيانات #تمثيل_البيانات #علم_البيانات #تصور_البيانات


#نشست_۲۳۸ #شیرازلاگ 🎯 موضوع: مقدمهای بر مصورسازی داده با پایتون Introduction to Data Visualization with Python 👨💻 ارائهدهنده: حمید نامجو #Data_Visualization #Python #پایتون #مصورسازی_داده


في اليوم الأخير 3️⃣: كنا مع الخبراء 👨🏻💻: د. محمد مستور د. حامد القحطاني @Hsqahtani3 د. محمد عبود @Dr_MSAbood واستمرت الحديث عن #computer_vision، #data_visualization فلم تكتفي المدرسة بالحديث عن ماضي وتاريخ وحاضر AI، بل سافرنا إلى المستقبل من خلال #رؤية_2030 فعلاً ختامها مسك🤍


You'll forgive my OSM, I was offline while rendering. Also, data for Ngara Sub County was in a different drive I left home accidentally. Meanwhile, it was just a brain jogging morning with QGIS. #Geospatial #Survey #Data_Visualization #GIS


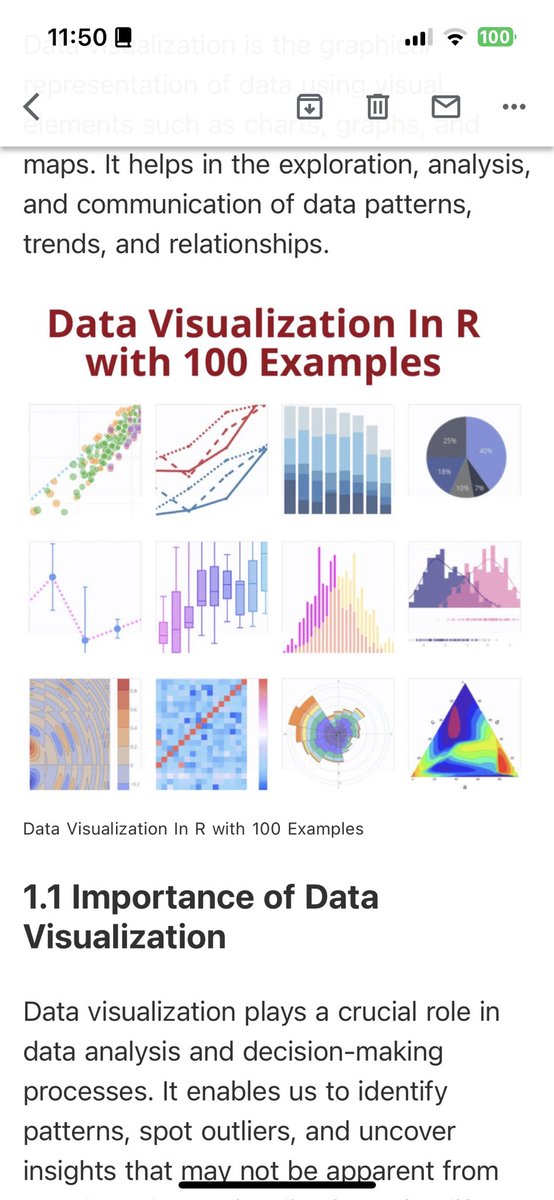
That moment when the teacher tells you that your solution is better! 😂 #data_visualization #R #Claude


ワークシートのことを試行錯誤しながらも、なぜか少しだけ[データの可視化]について知るなど...... v2020からの機能なのですね #Vectorworks #ベクターワークス #data_visualization #データの可視化
![machi_syo_g's tweet image. ワークシートのことを試行錯誤しながらも、なぜか少しだけ[データの可視化]について知るなど......
v2020からの機能なのですね
#Vectorworks
#ベクターワークス
#data_visualization
#データの可視化](https://pbs.twimg.com/media/GKTK7ZtasAAdz3k.png)
![machi_syo_g's tweet image. ワークシートのことを試行錯誤しながらも、なぜか少しだけ[データの可視化]について知るなど......
v2020からの機能なのですね
#Vectorworks
#ベクターワークス
#data_visualization
#データの可視化](https://pbs.twimg.com/media/GKTLDCfb0AA8O-6.png)

Best Data Visualization Tools In Riyadh Jeddah, Saudi Arabia, Dubai, UAE 👉 Click and read: bit.ly/3T70xkg 👉 For more details, visit website: bit.ly/3Lw3MxN NTERNATIONAL STUDENT CALL/WHATSAPP +92-312-2169325 #shortvideo #data_visualization #data_visualization

🚀 Learned SQL, Excel, & Power BI and created a dashboard of a Coffee Shop Sales data from Data Tutorials! ☕📊 #project #data_visualization #dailylearnings #DataAnalysis #PowerBI #dailymotivation

A heat map is a 2-dimensional data visualization technique that represents the magnitude of individual values within a dataset as a color. The variation in color may be by hue or intensity. #Heat_map #Data_visualization #Hue searcheng.in/e/s/Heat+map


هل تساءلت يومًا عن طرق تمثيل البيانات الكمّيّة Quantitative Data؟ أو ما هي البيانات الكمّيّة؟ وما الذي نستفيده من تمثيلها في مخطّطات بيانيّة؟ تابع المقال للتّعرّف على طرق تمثيل البيانات الكمّيّة عند تحليل البيانات. aiinarabic.com/plotting-a-qua… #Quantitative_Data, #Data_Visualization,


الرائدون في مجال التحول الرقمي وادارة البيانات المرئية والرقمية #ADAA #Digital_Transformation #Data_Visualization


실무에서 통하는 ‘데이터 시각화’ 준비 가이드 yozm.wishket.com/magazine/detai… #cloud101 #data_visualization


A Multi-Purpose Shallow Convolutional Neural Network for Chart Images mdpi.com/1424-8220/22/2… @SveucilisteZG #chart_classification #data_visualization #convolutional_neural_network #Siamese_neural_network #shallow_neural_network #generative_adversarial_network


Exploring Data Visualization in Python The process of creating images or graphs to help us understand data is known as data visualization. Learn more: sirisarah.com/2023/03/explor… #Data_Visualization #Python #Tutorials #SiriSarahLLC


#نشست_۲۳۸ #شیرازلاگ 🎯 موضوع: مقدمهای بر مصورسازی داده با پایتون Introduction to Data Visualization with Python 👨💻 ارائهدهنده: حمید نامجو #Data_Visualization #Python #پایتون #مصورسازی_داده
me llama la atencion la señalacion de la variacion interanual #data_science #data #data_visualization

En los '90, con la convertibilidad, no había inflación. El dólar era barato (1 a 1) y algunos viajaban al exterior mientras en el país crecían la desocupación, el desempleo y la pobreza a la par que sucumbía la industria. En 2001, cuando todo explotó, incluso la medición dio…

실무에서 통하는 ‘데이터 시각화’ 준비 가이드 yozm.wishket.com/magazine/detai… #cloud101 #data_visualization
That moment when the teacher tells you that your solution is better! 😂 #data_visualization #R #Claude
si no te queda claro, te lo explico de otra forma "el asteroide ... si colisionara con la Tierra en 2182, aunque la probabilidad estimada es de 1 entre 2.700 (algo así como lanzar una moneda 11 veces seguidas con el mismo resultado). #statistic #data #data_visualization

Can anyone provide me with a #GeoJSON file of the Indian map where Jammu and Kashmir is not in a distorted format? All the files available on the internet seem to distort J&K. If you have one, please share it with me. I need it urgently. #JSON #data_visualization #data #map
Plotly :- - Use it when there is no restriction of customisation. - When you need a predefined colour theme. - When you want to create more attractive visuals. - Want to complete your work in less time. - It's easy to learn. - Generally startups use it. #data_visualization #tech

امشب پروف نهایی مقاله ام و گرفتم :) هر چند که قراره با ایرادات صفحه آرایی دفتر مجله رو بسابم اما همزمان تو دلم گفتم چقدر قشنگ شدی آخه خوشگگل من 😍🥹🤌🏻 #data_visualization #راست_مغز_افراطی
في اليوم الأخير 3️⃣: كنا مع الخبراء 👨🏻💻: د. محمد مستور د. حامد القحطاني @Hsqahtani3 د. محمد عبود @Dr_MSAbood واستمرت الحديث عن #computer_vision، #data_visualization فلم تكتفي المدرسة بالحديث عن ماضي وتاريخ وحاضر AI، بل سافرنا إلى المستقبل من خلال #رؤية_2030 فعلاً ختامها مسك🤍
🚀 Learned SQL, Excel, & Power BI and created a dashboard of a Coffee Shop Sales data from Data Tutorials! ☕📊 #project #data_visualization #dailylearnings #DataAnalysis #PowerBI #dailymotivation
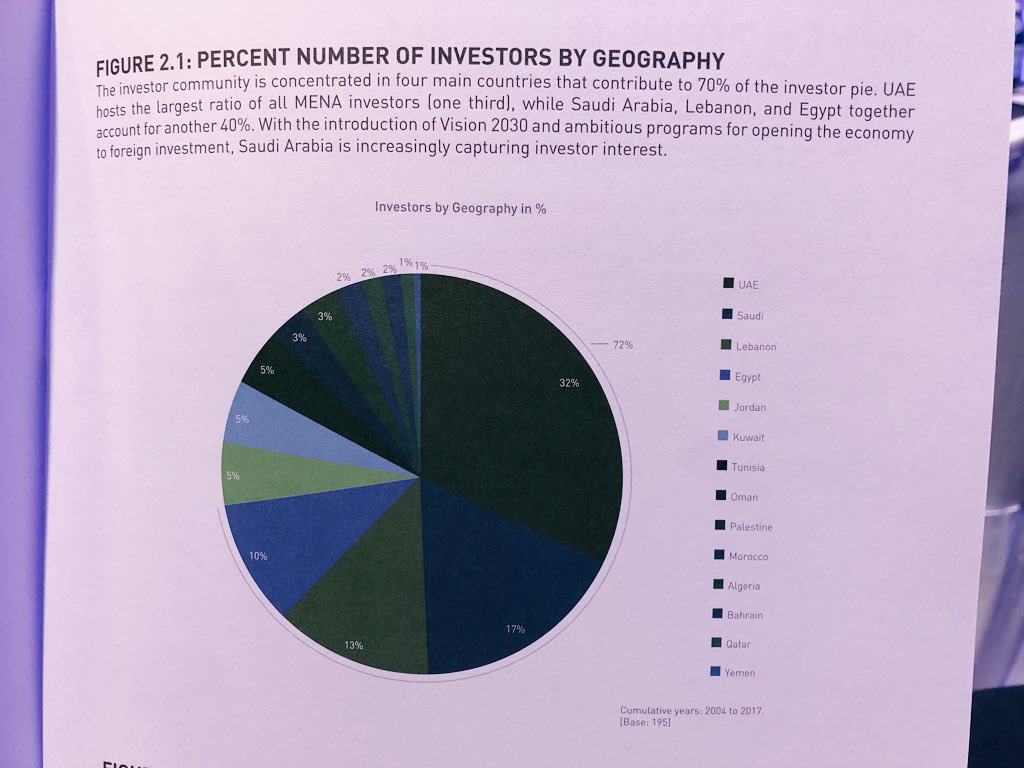
تمثيل البيانات في power bi ... #powerpi #data_visualization #visualization #DataAnalytics #data_analysis #analysis #DataScience #تحليل_البيانات #تمثيل_البيانات #علم_البيانات #تصور_البيانات


#نشست_۲۳۸ #شیرازلاگ 🎯 موضوع: مقدمهای بر مصورسازی داده با پایتون Introduction to Data Visualization with Python 👨💻 ارائهدهنده: حمید نامجو #Data_Visualization #Python #پایتون #مصورسازی_داده


Thanks for @MiriahMeyer give a amazing speech about design #Data_Visualization to explain complex #Big_Data story @WiDS_Conference


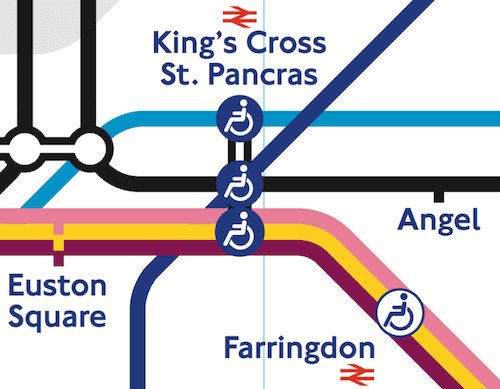
Things To Keep In Mind When Designing A Transportation Map dlvr.it/PTX4sC #Design #Data_Visualization


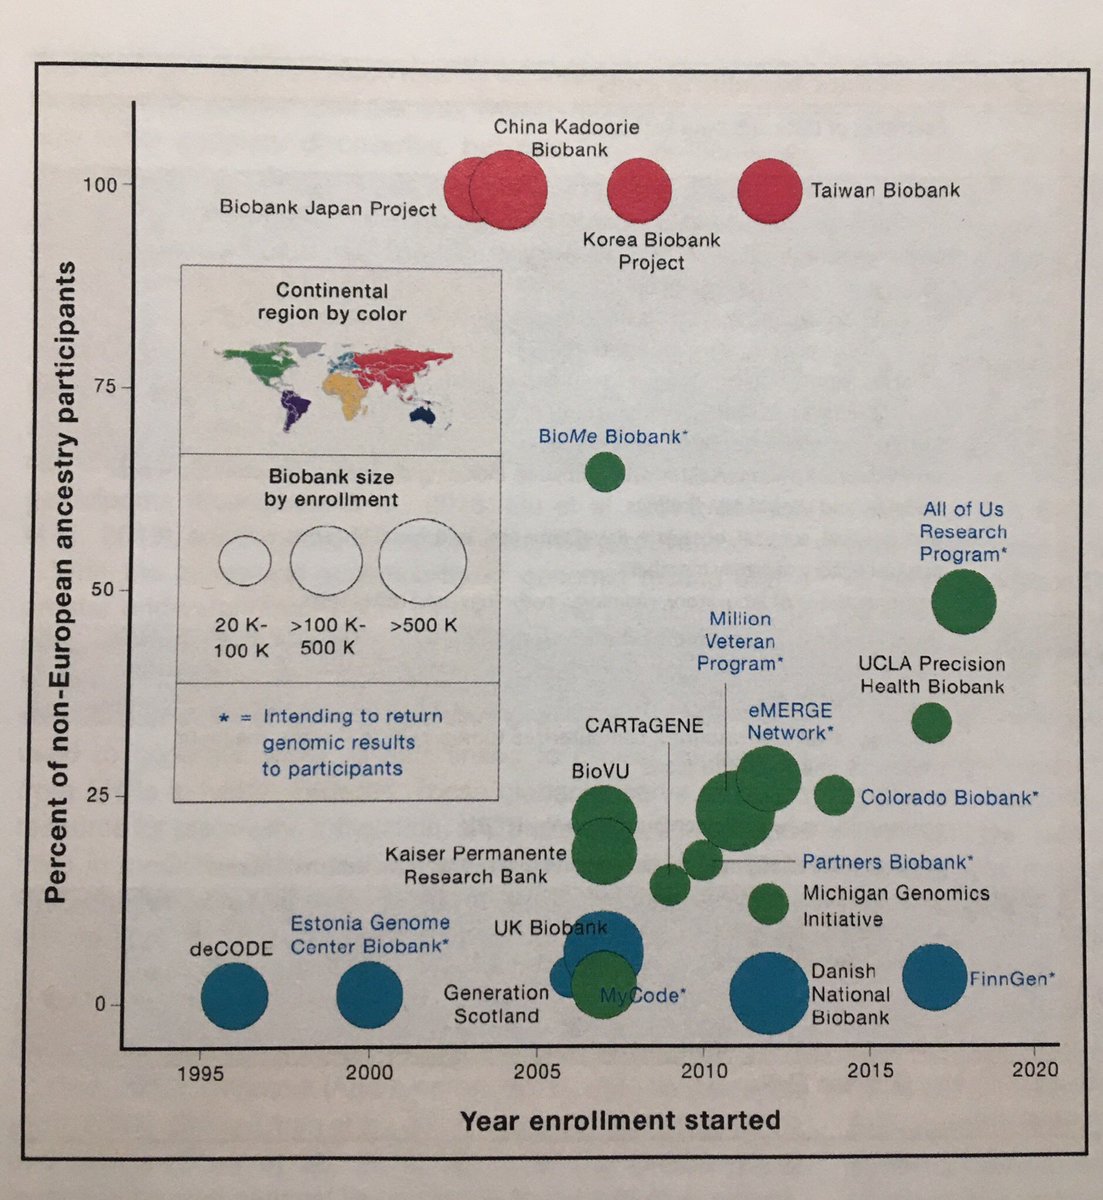
Really love this figure. This should be an example for #data_visualization lessons. Current #biobanks in the world. This figure contains so much information, the time,population ancestry, the biobank size, the geographic, and #ROR. And it is beautiful too, that makes me happy.
Having a wonderful time with @heathershaw and other @lesley_u faculty exploring #data_visualization & #visual_literacy

You'll forgive my OSM, I was offline while rendering. Also, data for Ngara Sub County was in a different drive I left home accidentally. Meanwhile, it was just a brain jogging morning with QGIS. #Geospatial #Survey #Data_Visualization #GIS


#Design #Data_Visualization #User_Experience Things To Keep In… destyy.com/qCcnN5 #Website #WebDesign #WebDevelopment #HTML #PHP
Visualize your ... - managedsolution.com/?p=5403 #Business_Intelligence #Data_Analytics #Data_Visualization


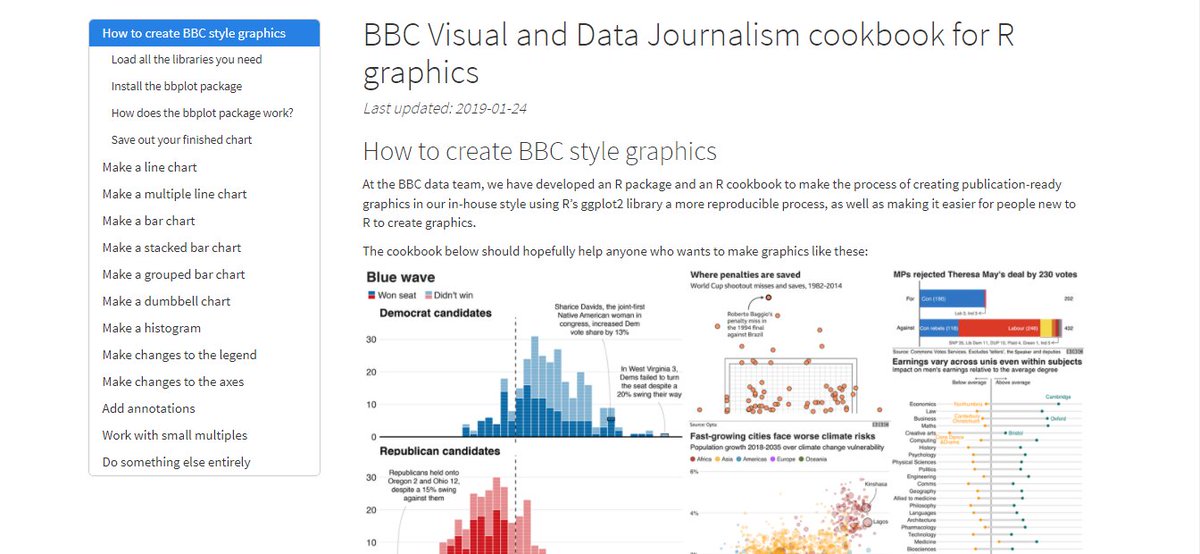
#Data_Visualization are a way to show off how important is the numbers that you collected in any Survey or Study. #BBC Visual and Data Journalism cookbook for R graphics: bbc.github.io/rcookbook/ Really amazed how @BBCWorld have their own Visual and Data Journalism team 🥳
Something went wrong.
Something went wrong.
United States Trends
- 1. #DWTS 24.4K posts
- 2. #WWENXT 12.5K posts
- 3. Robert 103K posts
- 4. #DWCS 3,866 posts
- 5. Carrie Ann 2,559 posts
- 6. #RHOSLC 3,324 posts
- 7. Elaine 49.6K posts
- 8. Whitney 13.7K posts
- 9. Max Muncy 1,857 posts
- 10. Dylan 31.8K posts
- 11. Young Republicans 44.9K posts
- 12. Roldan 1,739 posts
- 13. #USMNT N/A
- 14. Haji Wright N/A
- 15. Politico 254K posts
- 16. Peralta 5,535 posts
- 17. The Rangers 8,494 posts
- 18. D’Angelo 399K posts
- 19. Rahiki 1,217 posts
- 20. Charlie 787K posts