#datagraph search results


#DataGraph day. Cases and deaths to date USA. Cases and deaths year to year compared. Data from Our World in Data


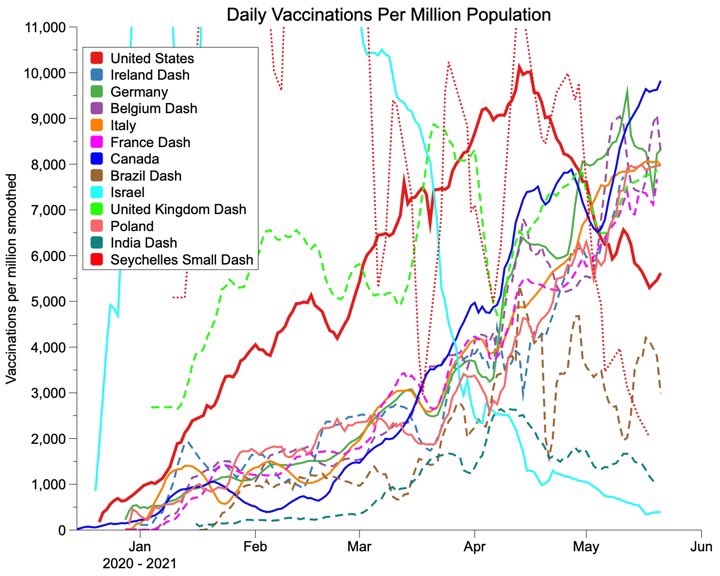
#Datagraph Saturday. Rate of vaccination for my countries of interest. Canada now in the lead for rates per million.

COVID update. Year to year USA trends cases and deaths per day. Cases and deaths still below last year. Cases leveling off. #DataGraph


More plots from #datagraph. Race to 80 percent vaccination. I think this 1 or 2 shots. How much does vaccine help?A trend of lower deaths with more vaccine. Not super strong.


#datagraph day. Year over year US cases and deaths. Cases on a slight upturn about same level as last year. Deaths still headed down. Falling below 5% total deaths.
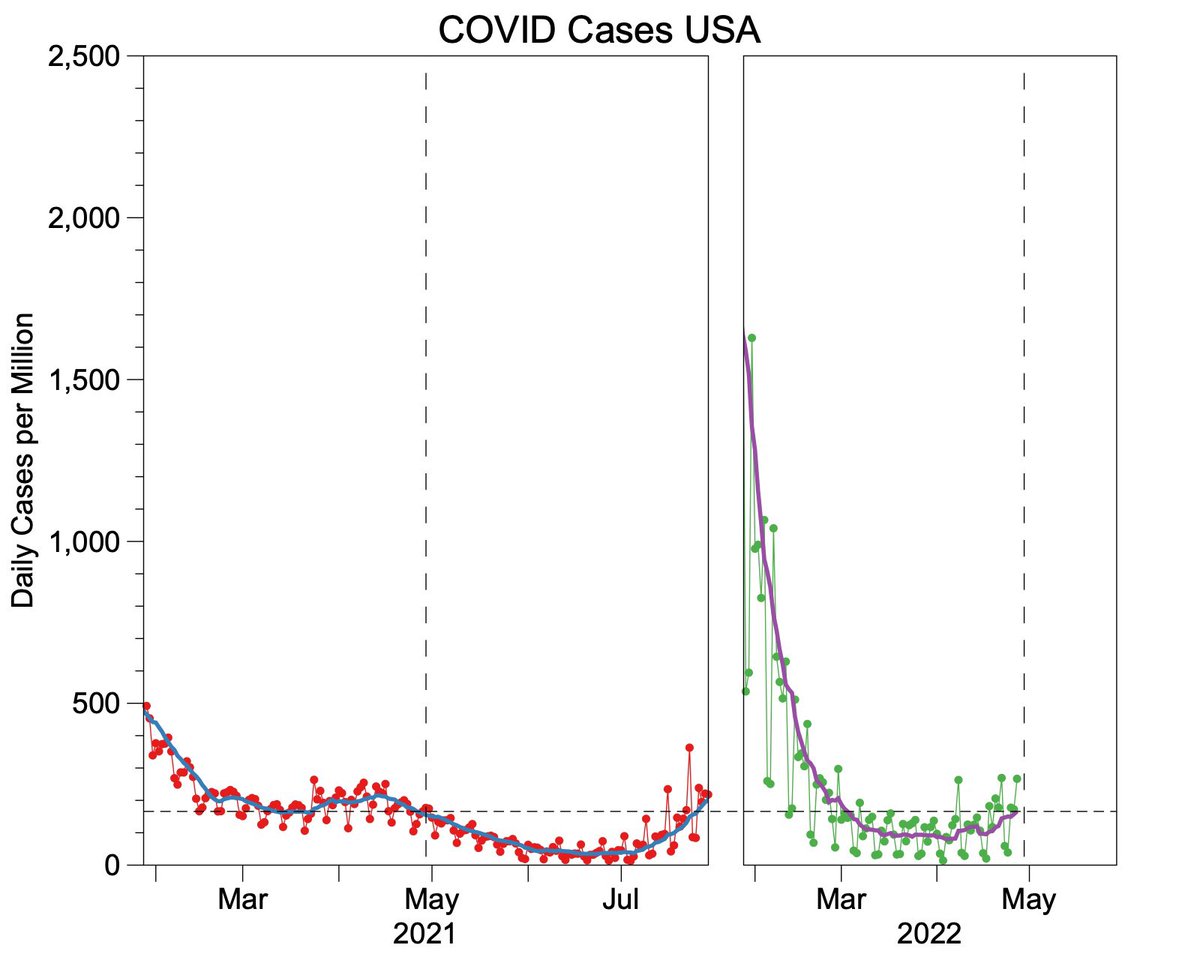

Chart day. Year to year comparison cases and deaths from COVID in US. Looks like the US is getting away from the normal pandemic cycles and becoming more endemic. #datagraph


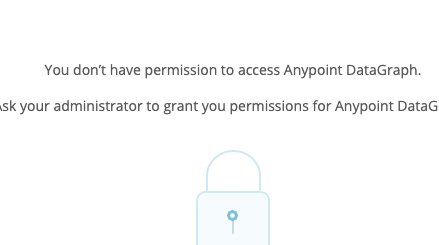
Any idea why#MuleSoft #DataGraph is showing below screen even though I logged in as admin @MuleSoft @MuleDev

It's a brand new week to work on charts and learn Data 😎 #zacrac #charts #datagraph #datachart #learndata #programming #programmers #data #datascience #dataanalytics #dataanalysis #coding

Le #BestOfTweets ce sera pour la prochaine fois ! En tout cas merci pour cette soirée @TwitterMktgFR et pour la présentation de toutes ces innovations comme ce #Datagraph !
Come visit us on our stand D05-007 Lab @SNCF_Digital and get one of the dataviz artworks drawn by our #robot #Datagraph with SNCF API! #VivaTech #VivaTech2018 #datavisualization
🙌 Bravo à tous les participants de la soirée #Bestoftweets qui ont permis au #Datagraph de créer une visualisation unique à partir de leurs tweets et interactions


Time-series data tells you when. Dependency graphs tell you where. RCA comes alive when you combine both. #RCA #Anomaly #DataGraph #Timeseries


Meetup #OpenDataViz : @benoitvidal présente le #datagraph #lowtech de @dataveyes une machine pour dessiner des donnée #DataViz


Time-series data tells you when. Dependency graphs tell you where. RCA comes alive when you combine both. #RCA #Anomaly #DataGraph #Timeseries

🧩 Lost in your own data? CMD+RVL turns scattered tables into a single, operable graph. 📌 Owners 🧬 Lineage 📅 Freshness 🎯 Impact Find clarity in the chaos. #CmdRvl #DataGraph #Dealcharts 🌐 CmdRvl.com


Dashboards go stale. Syntes builds a Digital Twin, a live model of your business. Explore relationships, run “what ifs,” and take action in real-time. #DigitalTwin #DataGraph #AIExecution #SyntesAI

🚀 Precisely Data Graph for #Snowflake gives you seamless access to curated data – including addresses, properties, businesses, natural hazards, boundaries, demographics & more – all via one flexible API. Learn more here: okt.to/89BQPf #DataGraph #DataEnrichment


🚀 Precisely Data Graph for #Snowflake gives you seamless access to curated data – including addresses, properties, businesses, natural hazards, boundaries, demographics & more – all via one flexible API. Learn more here: okt.to/GWLvem #DataGraph #DataEnrichment


🚀 Precisely Data Graph for #Snowflake gives you seamless access to curated data – including addresses, properties, businesses, natural hazards, boundaries, demographics & more – all via one flexible API. Learn more here: okt.to/OukH2D #DataGraph #DataEnrichment


🚀 Precisely Data Graph for #Snowflake gives you seamless access to curated data – including addresses, properties, businesses, natural hazards, boundaries, demographics & more – all via one flexible API. Learn more here: okt.to/cjLqIg #DataGraph #DataEnrichment


What Are Insights in Data Analysis? An insight is a valuable discovery hidden in your data. It answers questions like: #dataanalytics #DataInsights #DataGraph #dataprotection #DataTrends #dataanalyst ittechlanguage.blogspot.com/2025/04/the-co…
ittechlanguage.blogspot.com
The Complete Guide to Drawing Insights from Data Analysis
An insight is a valuable discovery hidden in your data. It answers questions like: ✔ "Why are sales dropping?" ✔ "Which customers are most profi
#Datagraph GmbH, Berlin. – We worked on embedding our many articles, documentation and demos that we have written as interactive #Observable notebooks directly on our web page at blog.dydra.com. With the new layout and categories it should be much more accessible! Enjoy!
With Neo4j's robust capabilities, Process Tempo elevates data insights, enabling smarter applications and sharper predictions #neo4j #graphdatabase #datagraph #dataplatform #data #analytics Learn more about Neo4j ➡️ neo4j.com
#KnowledgeGraphs are a reliable option for grounding LLMs with their ability to represent both structured and unstructured data, unlike vector databases. View More ➡️neo4j.com/blog/unifying-… #DataManagement #DataGraph #GraphDB #LLM #AI #ML #GenerativeAI #Data #Analytics #Neo4j
A data and analytics strategy that requires multiple specialists is a recipe for inefficiency. Data officers and executives looking to improve productivity will find Process Tempo the perfect platform to meet this vision. Learn More ➡️processtempo.com #DataGraph #Data

5 Challenges, 5 Solutions – Master #MuleSoft #DataGraph! Swipe for API success! 1. Limited Writes 2. No Transactions 3. Manipulation Limits 4. Speed Bumps 5. Data Dependencies #MuleSoft #nexgenarchitects


#DataGraph day. Cases and deaths to date USA. Cases and deaths year to year compared. Data from Our World in Data
#Datagraph Saturday. Rate of vaccination for my countries of interest. Canada now in the lead for rates per million.
COVID update. Year to year USA trends cases and deaths per day. Cases and deaths still below last year. Cases leveling off. #DataGraph
Any idea why#MuleSoft #DataGraph is showing below screen even though I logged in as admin @MuleSoft @MuleDev
#datagraph day. Year over year US cases and deaths. Cases on a slight upturn about same level as last year. Deaths still headed down. Falling below 5% total deaths.
Chart day. Year to year comparison cases and deaths from COVID in US. Looks like the US is getting away from the normal pandemic cycles and becoming more endemic. #datagraph
More plots from #datagraph. Race to 80 percent vaccination. I think this 1 or 2 shots. How much does vaccine help?A trend of lower deaths with more vaccine. Not super strong.
It's a brand new week to work on charts and learn Data 😎 #zacrac #charts #datagraph #datachart #learndata #programming #programmers #data #datascience #dataanalytics #dataanalysis #coding
Meetup #OpenDataViz : @benoitvidal présente le #datagraph #lowtech de @dataveyes une machine pour dessiner des donnée #DataViz
🙌 Bravo à tous les participants de la soirée #Bestoftweets qui ont permis au #Datagraph de créer une visualisation unique à partir de leurs tweets et interactions

Observe: Curating metadata through time for incident insights - @Observe_Inc builds a #datagraph that overlays #SaaS apps, enterprise #datawarehouses, and datasets so teams can root out problems indicated within the associated #dataflow. intellyx.com/2022/06/24/obs… @bluefug #dataops


What is Scatter Plot? 🤔 🔽🔽🔽 instagram.com/p/CKtN-pInCDK/ #statistics #graph #datagraph #datavisualisation #dataanalysis #data #scatter #plot #scatterplot #machinelearning #deeplearning #datascience #datavisualization #dataanalytics #artificialintelligence #ai #neuralnetworks

🧩 Lost in your own data? CMD+RVL turns scattered tables into a single, operable graph. 📌 Owners 🧬 Lineage 📅 Freshness 🎯 Impact Find clarity in the chaos. #CmdRvl #DataGraph #Dealcharts 🌐 CmdRvl.com
🚀 Precisely Data Graph for #Snowflake gives you seamless access to curated data – including addresses, properties, businesses, natural hazards, boundaries, demographics & more – all via one flexible API. Learn more here: okt.to/OukH2D #DataGraph #DataEnrichment
🚀 Precisely Data Graph for #Snowflake gives you seamless access to curated data – including addresses, properties, businesses, natural hazards, boundaries, demographics & more – all via one flexible API. Learn more here: okt.to/GWLvem #DataGraph #DataEnrichment
Something went wrong.
Something went wrong.
United States Trends
- 1. #BaddiesUSA 53.5K posts
- 2. Rams 28.2K posts
- 3. Scotty 9,096 posts
- 4. #TROLLBOY 1,747 posts
- 5. Chip Kelly 8,071 posts
- 6. Cowboys 98K posts
- 7. Eagles 138K posts
- 8. Stafford 14.1K posts
- 9. Bucs 12K posts
- 10. Baker 20.4K posts
- 11. Raiders 65.4K posts
- 12. #RHOP 11K posts
- 13. Stacey 27.6K posts
- 14. #ITWelcomeToDerry 13.8K posts
- 15. Todd Bowles 1,970 posts
- 16. Teddy Bridgewater 1,173 posts
- 17. Ahna 6,289 posts
- 18. #LAShortnSweet 13.7K posts
- 19. Vin Diesel 1,033 posts
- 20. Lemmy 4,595 posts