#datavisualisation resultados de búsqueda

Graphs are really useful to help visualise what's happening to changing data - but it's always important to check what's written against the axes to make sure what you see is what you get: brianclegg.blogspot.com/2025/11/beware… #datavisualisation #dodgygraphs


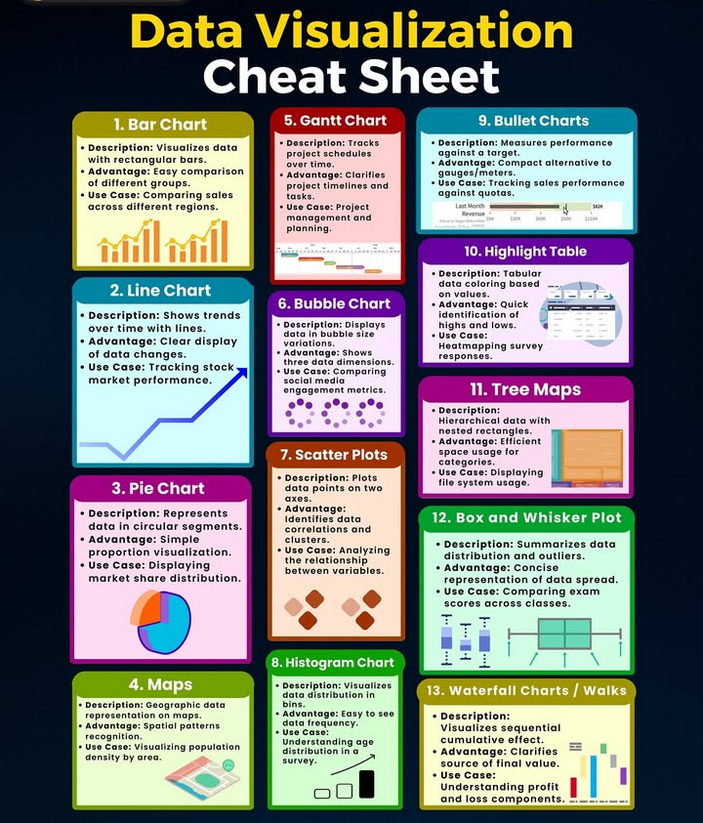
Charts make your data easier to understand—but only if you choose the right one! 📊✨ This guide breaks down popular chart types, so you can show off your data in the clearest way possible—no more guessing! #python #datavisualisation #datavisualizations #datavisualizationdesign…


How did you meet your spouse? Times have changed and this #datavisualisation shows just how much this is true. We have shifted away from traditions, where we were once introduced by friends and family, or married our high school sweethearts. It seems the internet has even…
America is in pain! Take a look at this #datavisualisation. It's shocking. The US has the most expensive healthcare system in the world on a per capita basis. Just last week, UnitedHealthcare CEO Brian Thompson was murdered – a chilling symbol of mounting outrage towards the US…

📊 Transform your data into insights with Power BI in Bridgend! Our hands-on training covers everything from the basics to dashboards & DAX. ✅ Ideal for teams & professionals 📍 Wales or online 👉 computertrainingwales.co.uk/courses/micros… #PowerBI #DataVisualisation #BItraining #UpskillWales

🎤On Friday, professionals gathered in Hilversum for the @Infodesigncon.👥Our @janshenke and @nicole_shearer_ , @esa Science Editors, were in the mix.👩🏻💻🛠️They added more info to their #scicomm toolkits, including topics like #datavisualisation and #futurology.✍️📊 #IDC25


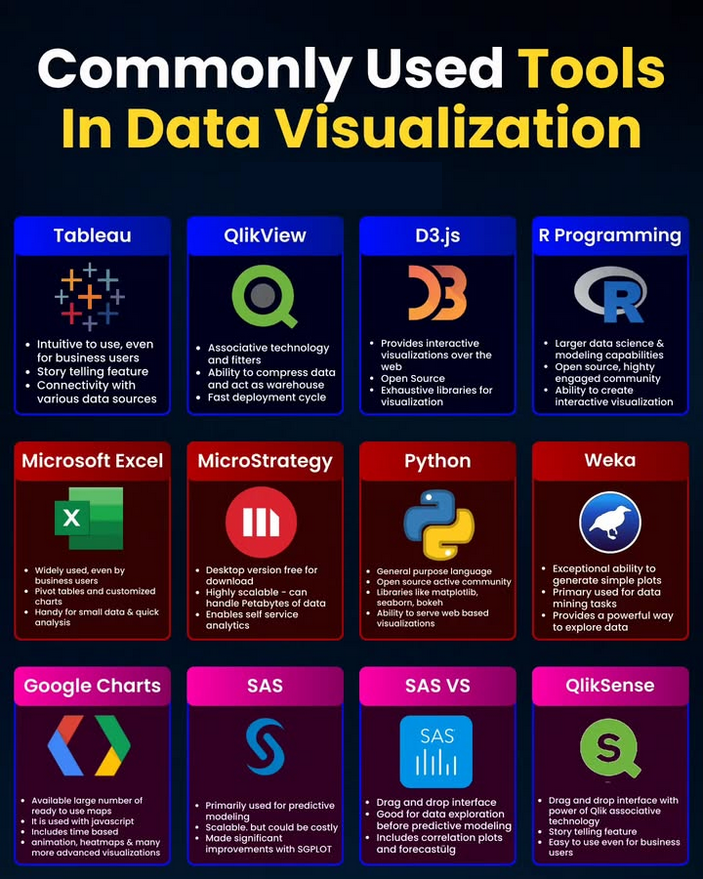
Commonly used Tools In Data Visualisation amzn.to/4aerxXm #DataVisualisation #python #programming #developer #programmer #coding #coder #softwaredeveloper #computerscience #webdev #webdeveloper #webdevelopment #pythonprogramming #pythonquiz #ai #ml #machinelearning…

📊 Transform your data into insights with Power BI! From basics to dashboards & DAX — our hands-on training has you covered. ✅ Perfect for teams & professionals 📍 Wales or online 👉 computertrainingwales.co.uk/courses/micros… #PowerBI #DataVisualisation #BItraining #UpskillWales
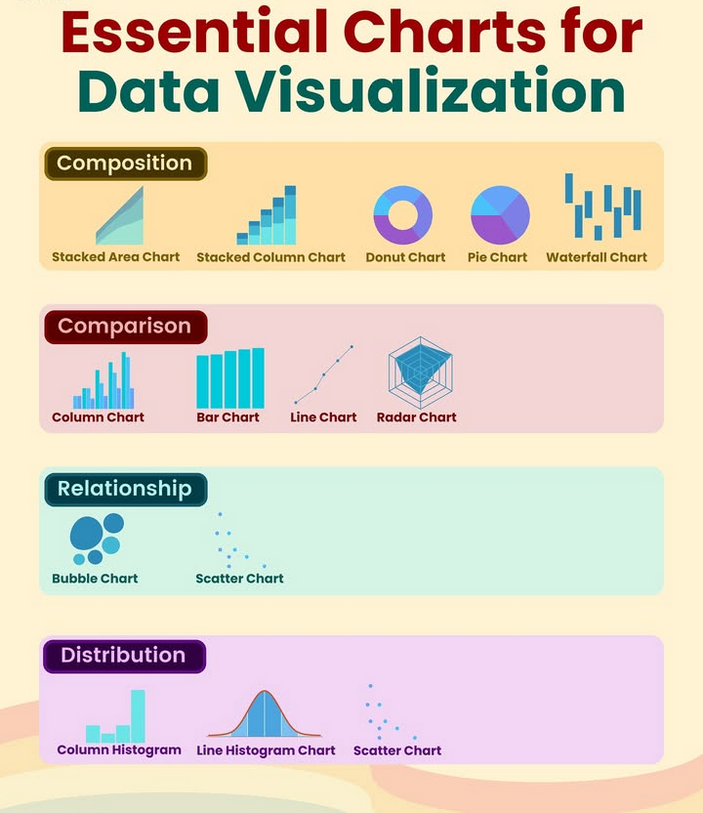
Essential Charts For Data Visualisation! #Charts #DataVisualisation #python #programming #developer #programmer #coding #coder #softwaredeveloper #computerscience #webdev #webdeveloper #webdevelopment #pythonprogramming #pythonquiz #ai #ml #machinelearning #datascience

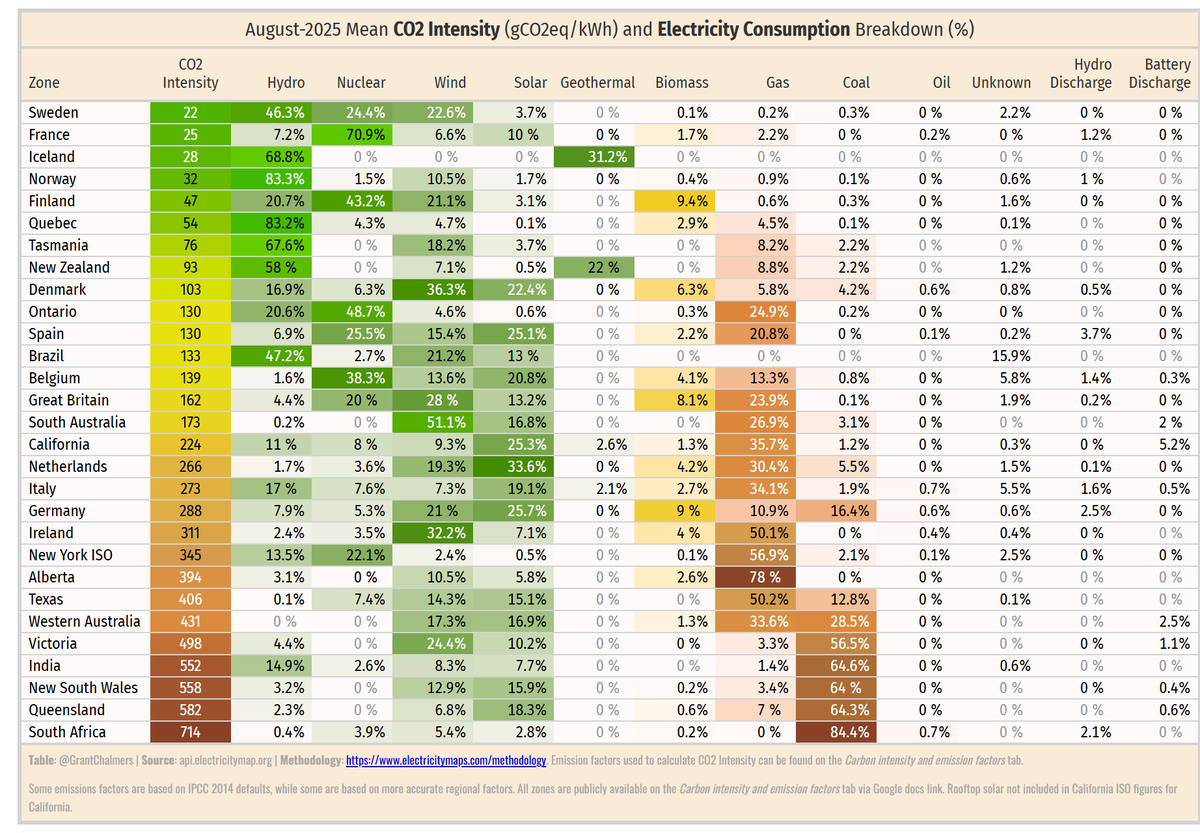
August 2025 mean CO2 intensity (gCO2eq/kWh) and power consumption breakdown (%). Data via Electricity Maps, table via R {gt} package. #rstats #datavisualisation Methodology: lnkd.in/gaXQmQ-P h/t @ElectricityMaps
Forget everything you thought you knew about the global economy. This #datavisualisation will shatter your worldview. Ditch the "nominal" and embrace the "PPP" measure of GDP. China is now the world's largest. I used something here called Purchasing Power Parity, or PPP. It's…
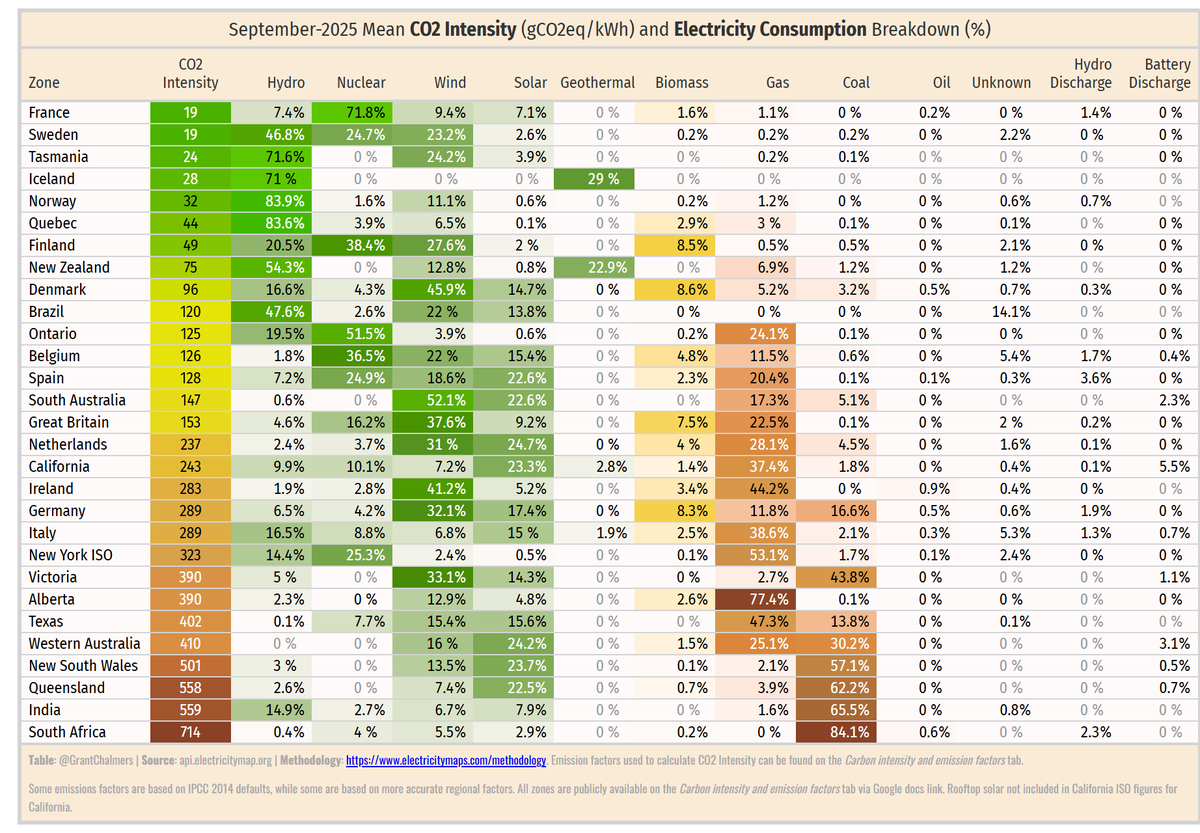
September 2025 mean CO2 intensity (gCO2eq/kWh) and power consumption breakdown (%) #rstats #datavisualisation Methodology: lnkd.in/gaXQmQ-P h/t @ElectricityMaps

Easy IoT #dataVisualisation ⚡ Want to see your IoT data interactively, clearly, and in real time? With #ThingsBoard, it's easy. Interactive dashboards with everything you need — no extra code. #Dashboard #IoT #IIoT #SCADA


How did you meet your spouse? Times have changed and this #datavisualisation shows just how much this is true. We have shifted away from traditions, where we were once introduced by friends and family, or married our high school sweethearts. It seems the internet has even…

🎉 Dashboard Giveaway! This month’s most popular dashboard was #2, and as promised, we’re giving it away for free! Download this Power BI dashboard using the link below. Link: sporthorizon.co.uk/free-dashboard… #PowerBI #Tableau #DataVisualisation #SportsAnalytics #SportHorizon…

Wow! Look how much the US job market has transformed over the last 140 years! This #datavisualisation show the complete restructuring of the US economy, through the eyes of the jobs market. It's incredible. Farming once reigned supreme – think crops, livestock and open fields –…
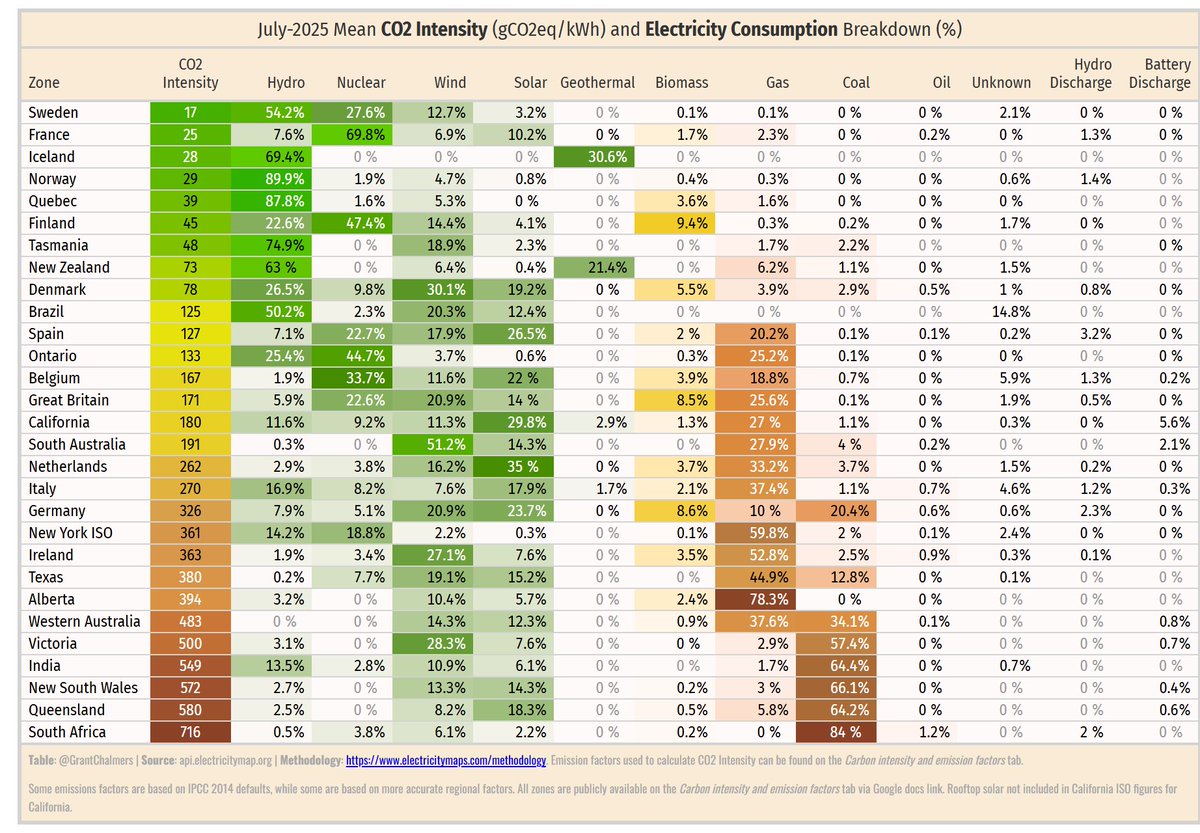
July 2025 mean CO2 intensity (gCO2eq/kWh) and power consumption breakdown (%). Data via Electricity Maps, table via R {gt} package. #rstats #datavisualisation Methodology: lnkd.in/gaXQmQ-P h/t @ElectricityMaps

After months of swimming (and occasionally drowning) in data… the Ocean Breakthroughs Dashboard is live. Proud of this one. 🌊 ocean-breakthroughs.org/dashboard #OceanBreakthroughs #OceanData #DataVisualisation #OceanComms

🔥📊 Introducing @SankeyMaster to the #DataVisualisation community! 🌟 Check out our new Sankey Chart infographic – a visual masterclass in energy flow and efficiency. Perfect for explaining complex processes with ease #sankeymaster #sankey 👉apps.apple.com/app/apple-stor…

🎨 Recording now live! Developing Your #DataVisualisation Skills in #ggplot2 with @nicolarennie87 Watch the creative process exploring the #TidyTuesday cats dataset 🐈 📚 Materials & links: 🔗 nrennie.rbind.io/talks/rladies-… #RLadies #ggplot2 #TidyTuesday @fgazzelloni


Come learn the @infobeautiful ‘concept-driven’ approach to #datavisualisation & #infographics for max impact. 2 x virtual half days: 11th & 12th Nov 🇬🇧 UK/EU/AUS Deets: bit.ly/IIBWAB Reviews: #iibwab
Graphs are really useful to help visualise what's happening to changing data - but it's always important to check what's written against the axes to make sure what you see is what you get: brianclegg.blogspot.com/2025/11/beware… #datavisualisation #dodgygraphs

📊 Data tells a story - but only if people can understand it. Keep it clear, visual, and consistent: ✅ Simple 📈 Use graphs 🎨 Add colour & labels 🔁 Stay consistent When data looks good, people pay attention. #DataVisualisation #Design

🎤On Friday, professionals gathered in Hilversum for the @Infodesigncon.👥Our @janshenke and @nicole_shearer_ , @esa Science Editors, were in the mix.👩🏻💻🛠️They added more info to their #scicomm toolkits, including topics like #datavisualisation and #futurology.✍️📊 #IDC25
🎉 Dashboard Giveaway! This month’s most popular dashboard was #2, and as promised, we’re giving it away for free! Download this Power BI dashboard using the link below. Link: sporthorizon.co.uk/free-dashboard… #PowerBI #Tableau #DataVisualisation #SportsAnalytics #SportHorizon…

To understand relationships, we visualised a pairplot - revealing trends, correlations, and outliers between opening, closing, and volume. Insights like these guide model design & feature selection. #DataVisualisation #Analytics #StockMarket

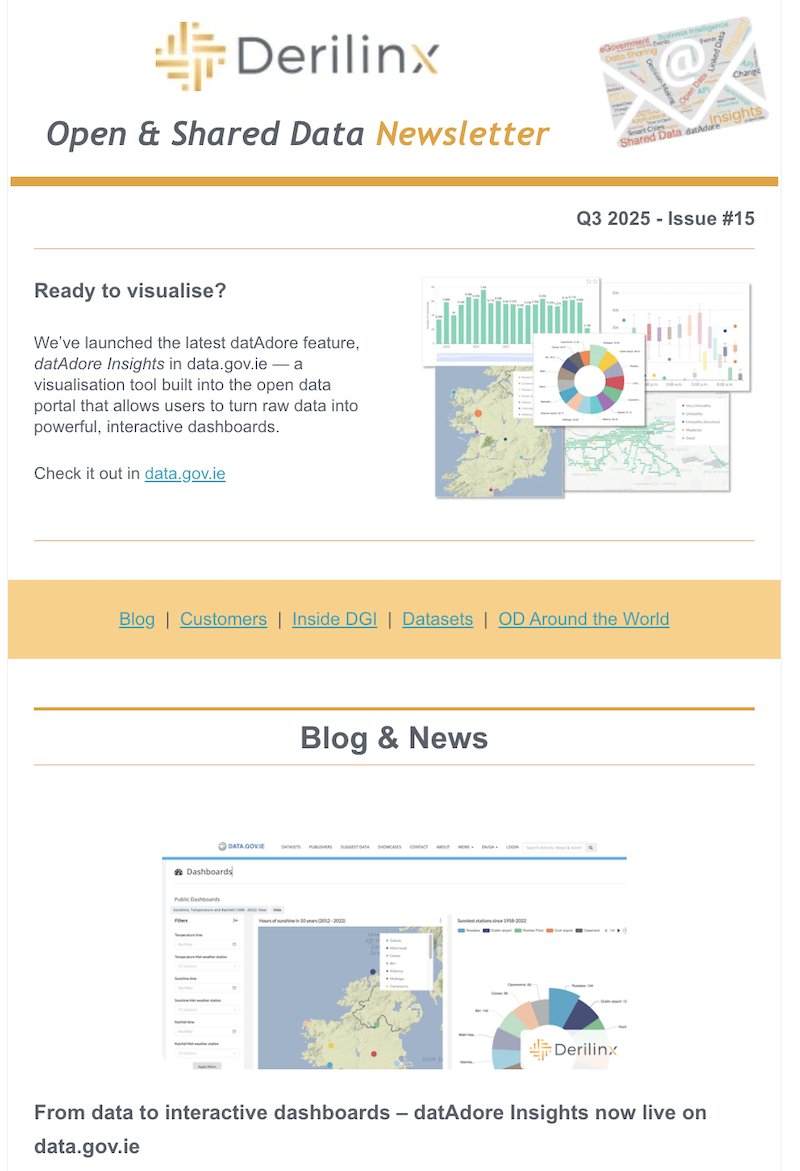
Have you seen the #DataVisualisation feature on hubs.ly/Q03PRksn0? — turning raw datasets into interactive #dashboards, all within the platform. Check it out 👉 hubs.ly/Q03PRpM40 @GovDataIE #DataSharing #OpenData #PublicSectorData #Ireland #DataPortal


Britain must unify AI in the energy sector to cut costs, boost innovation, and protect digital sovereignty, says Amjad Karim, CEO and founder of @KeenAI_Labs. #datavisualisation theengineer.co.uk/content/opinio…
Come learn the @infobeautiful ‘concept-driven’ approach to #datavisualisation & #infographics for max impact. 2 x virtual half days: 11th & 12th Nov 🇬🇧 UK/EU/AUS Deets: bit.ly/IIBWAB Reviews: #iibwab

📣Did you miss our Q3 Newsletter! 👉 hubs.ly/Q03PvsV60 Spotlight on #DataVisualisation with the launch of #datAdore Insights on hubs.ly/Q03Pvqxp0 + pilot dashboards. Also: new FAQs page, training from data.europa & more. #DataSharing #OpenData #DataPortal

There's always a bit of a brain-fry moment when I'm challenged to make complex scientific concepts understandable and engaging through creative visuals like this one #DataVisualisation #Scicomm

Drowning in data but starved for insights? 📊 Our new blog shows small businesses how to make their numbers speak volumes with simple data visualisation techniques. buff.ly/HMD2Ibh #DataVisualisation #SMBData #BusinessIntelligence #DataDriven #SmallBusinessGrowth


Graphs are really useful to help visualise what's happening to changing data - but it's always important to check what's written against the axes to make sure what you see is what you get: brianclegg.blogspot.com/2025/11/beware… #datavisualisation #dodgygraphs
Charts make your data easier to understand—but only if you choose the right one! 📊✨ This guide breaks down popular chart types, so you can show off your data in the clearest way possible—no more guessing! #python #datavisualisation #datavisualizations #datavisualizationdesign…
🎨 Recording now live! Developing Your #DataVisualisation Skills in #ggplot2 with @nicolarennie87 Watch the creative process exploring the #TidyTuesday cats dataset 🐈 📚 Materials & links: 🔗 nrennie.rbind.io/talks/rladies-… #RLadies #ggplot2 #TidyTuesday @fgazzelloni

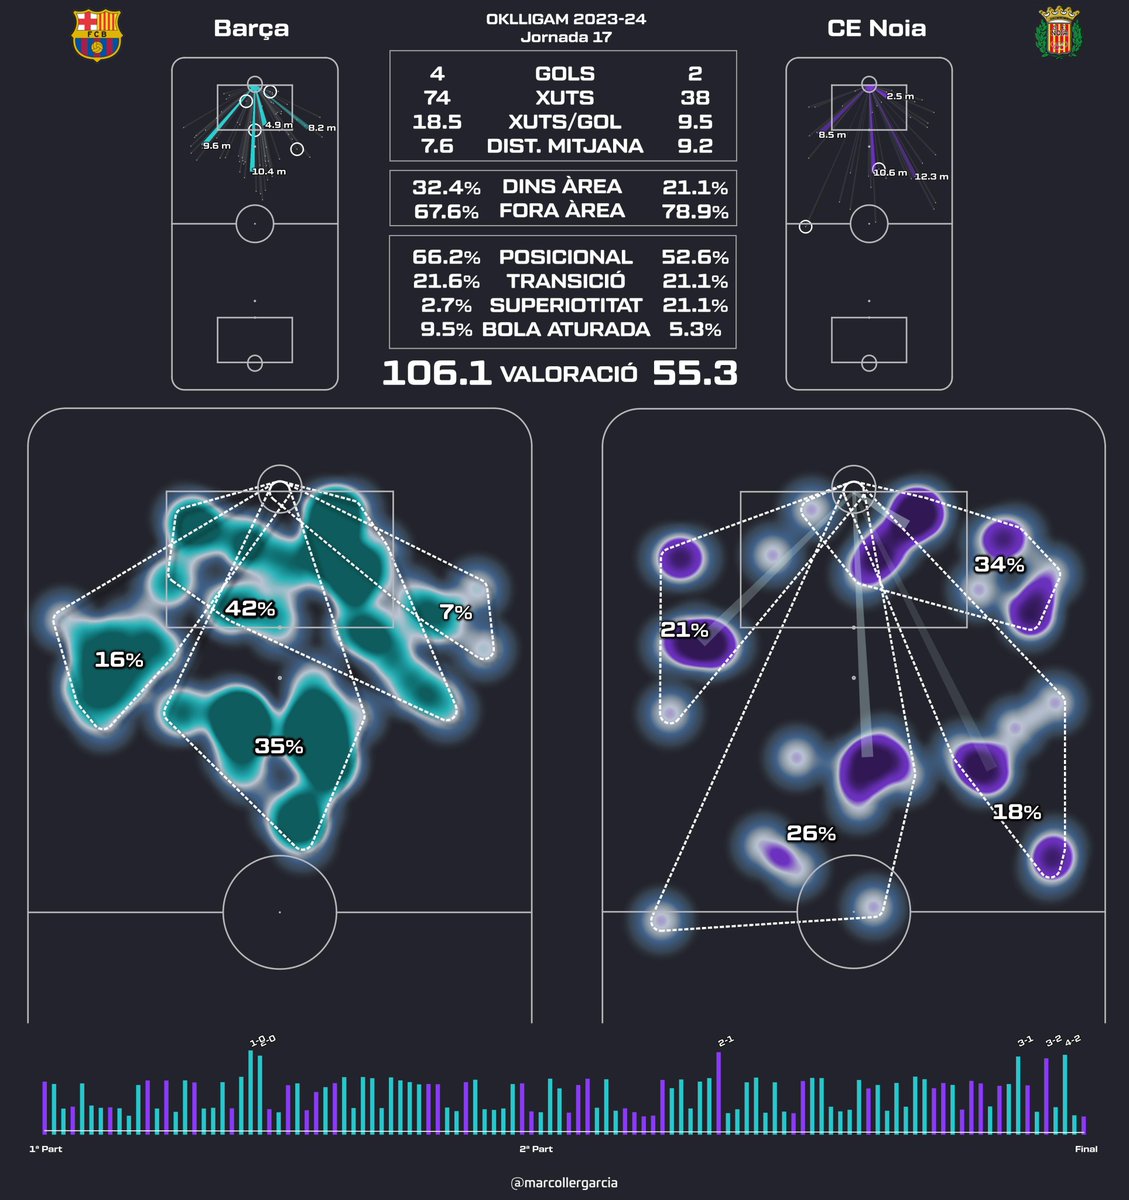
BARÇA 🆚 CE NOIA OKLLIGAM 2023-24 Jornada 17 📊Fitxa d'Estadística Avançada 🎯Visualització Espacial de Finalitzacions #DataAnalytics #DataVisualisation #DecisionMaking #SportsPerformance #HockeyAnalytics #SportAnalytics
Commonly used Tools In Data Visualisation amzn.to/4aerxXm #DataVisualisation #python #programming #developer #programmer #coding #coder #softwaredeveloper #computerscience #webdev #webdeveloper #webdevelopment #pythonprogramming #pythonquiz #ai #ml #machinelearning…
Essential Charts For Data Visualisation! #Charts #DataVisualisation #python #programming #developer #programmer #coding #coder #softwaredeveloper #computerscience #webdev #webdeveloper #webdevelopment #pythonprogramming #pythonquiz #ai #ml #machinelearning #datascience

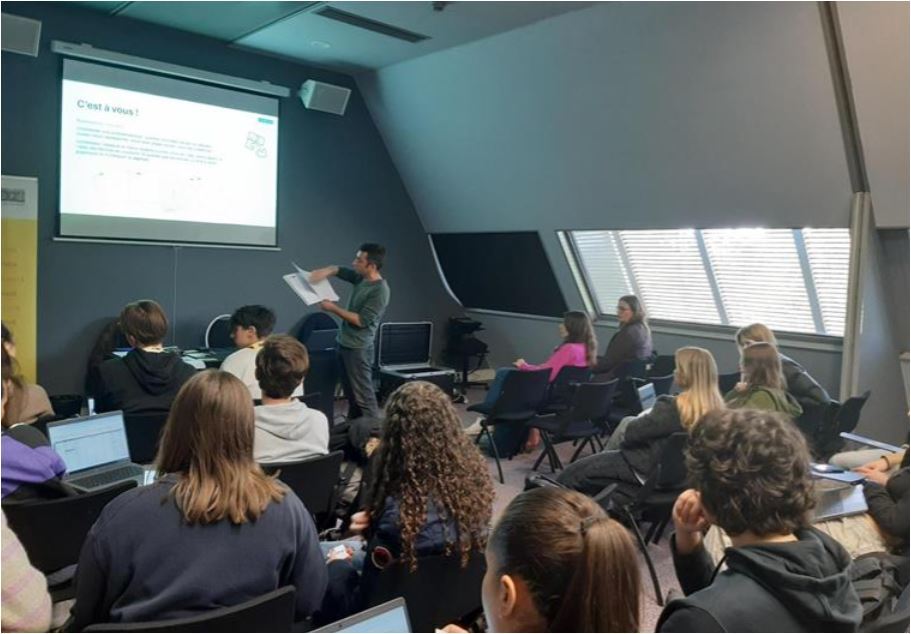
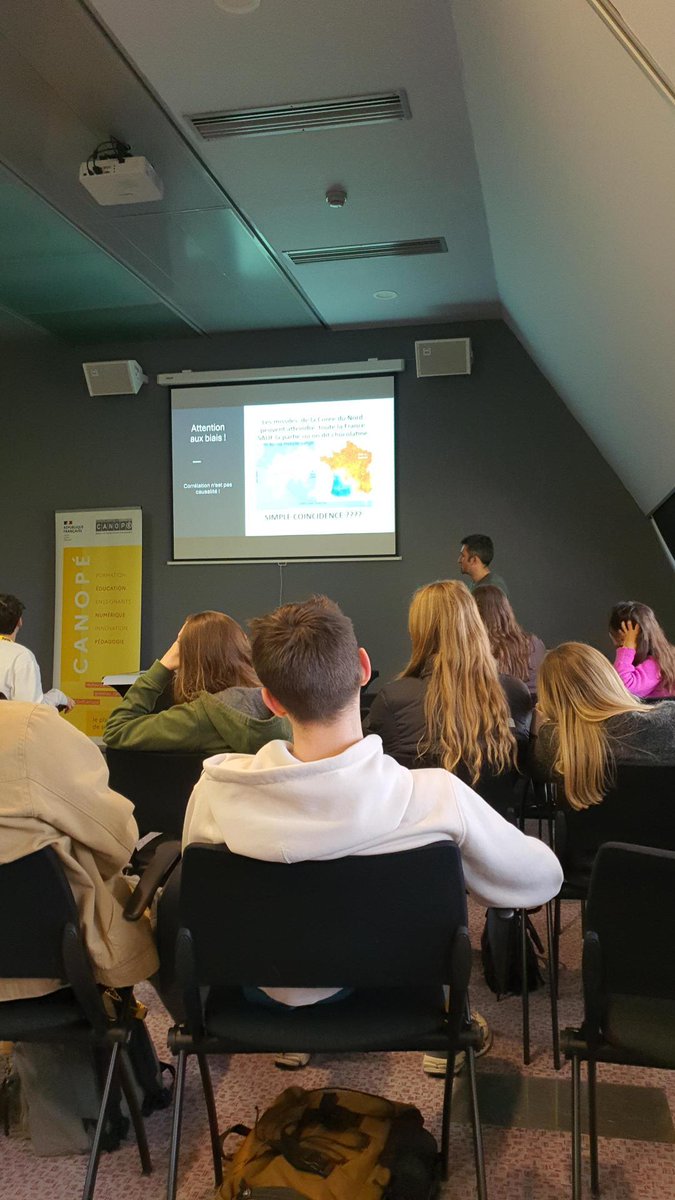
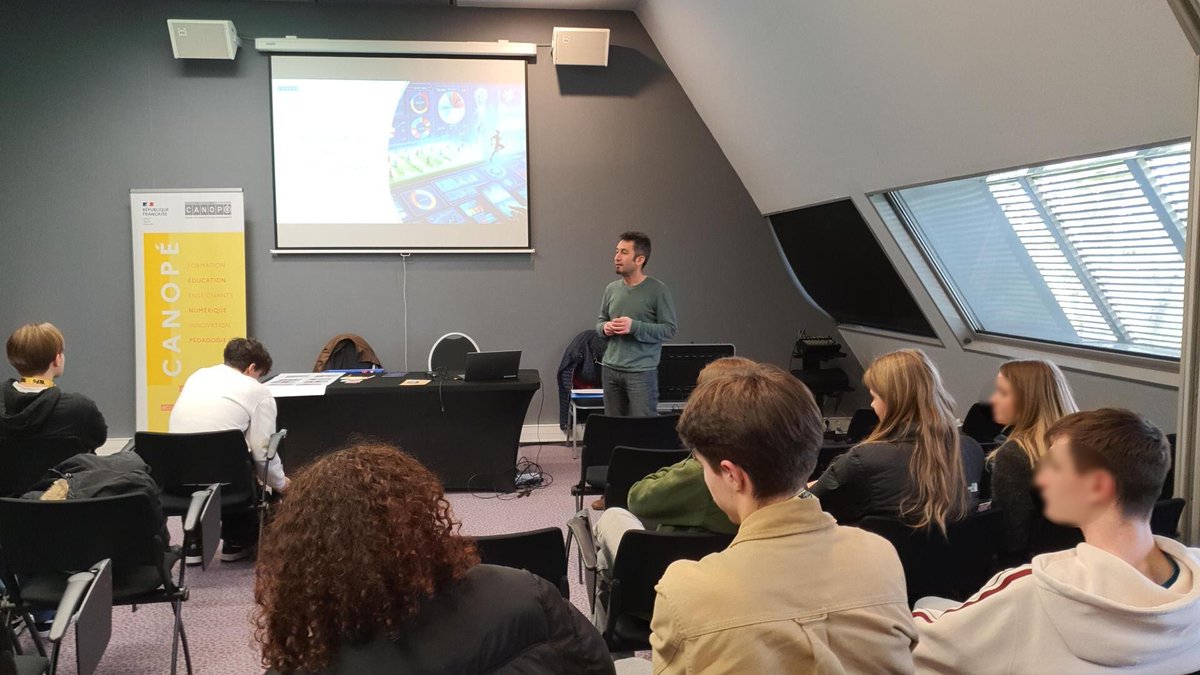
4 classes de collégiens et lycéens de la @RCValdeLoire attentifs & participatifs, à l'atelier proposé par @canope_37 "#Datavisualisation et pratiques sportives" aux #AJTOURS, 17èmes Assises du journalisme de @villedetours, sur la thématique phare "le journalisme, c'est sport" !


Thank you @BojanicLana @FBMH_UoM for running a fun and accessible R Workshop yesterday #Data #RStats #DataVisualisation

With 6 days to go till our Members' Meeting, we invite you to consider the amazing training opportunities we'll have on offer! The meeting is free to attend for BNA members. Register here: bna.org.uk/mediacentre/ev… #BNAMembersMeeting2024 #ApplyingtoFellowships #DataVisualisation


#DataVisualisation for Environmental Visual Communication: A Case Study What is the purpose of data visualisation? It’s supposed to be a way to represent information quickly and effectively through the use of charts, graphs and tables. However, it’s commonly found that data…
Data Visualisation Cheat Sheet amzn.to/4isL49U #DataVisualisation #python #programming #developer #morioh #programmer #coding #coder #softwaredeveloper #computerscience #webdev #webdeveloper #webdevelopment #pythonprogramming #pythonquiz #ai #ml #machinelearning…

WFP #Pacific is pleased to be in #Vanuatu this week providing #datavisualisation capacity strengthening to the Department of Fisheries. The training is part of our support to strengthen capacity in digital data collection with the Vanuatu Govt's Ministry of Agriculture.🇻🇺


As the world’s manufacturing powerhouse, China has the highest global demand for crude steel. Explore further how China’s steel demand has evolved over time in our latest BHP Insights article 👉 bhp.com/news/bhp-insig… #SteelDemand #China #DataVisualisation 🌏🏭


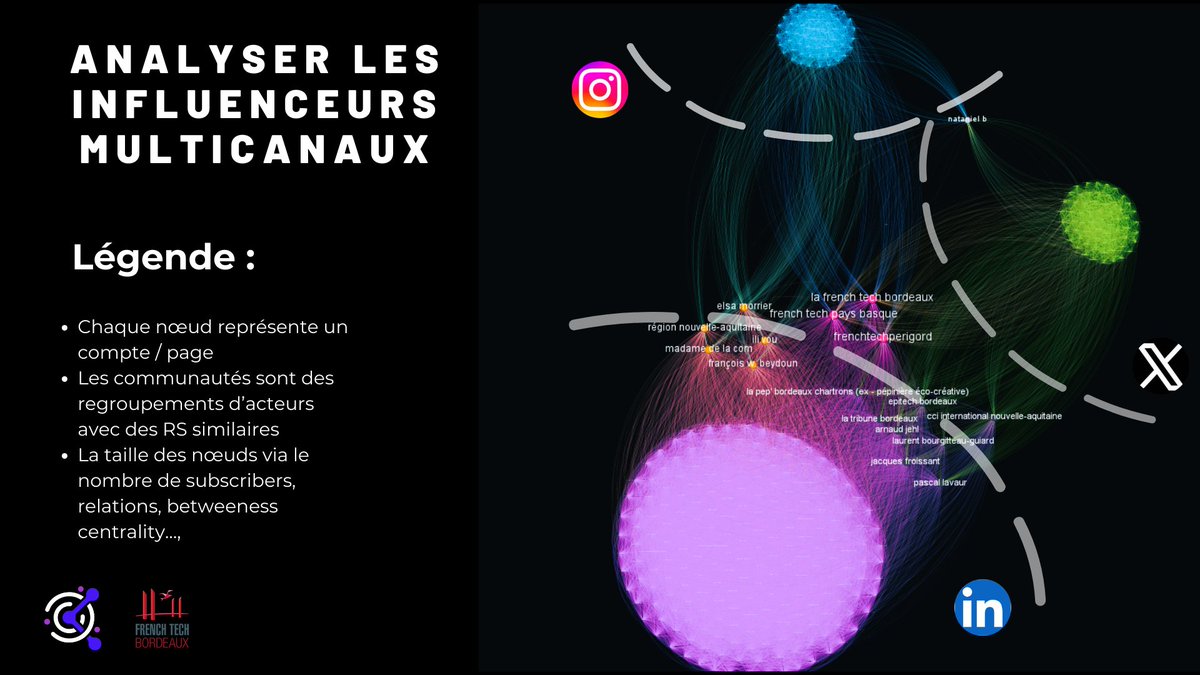
Je suis excité à l'idée de vous montrer notre premier #Graph d'influence (X - Instagram - LinkedIn) 🔥 Ce type de #datavisualisation très pertinente détecte les Ambassadeurs et permet d'enclencher des leviers d'influences multicanaux ! #influencemarketing #data #DataScience
🎤On Friday, professionals gathered in Hilversum for the @Infodesigncon.👥Our @janshenke and @nicole_shearer_ , @esa Science Editors, were in the mix.👩🏻💻🛠️They added more info to their #scicomm toolkits, including topics like #datavisualisation and #futurology.✍️📊 #IDC25

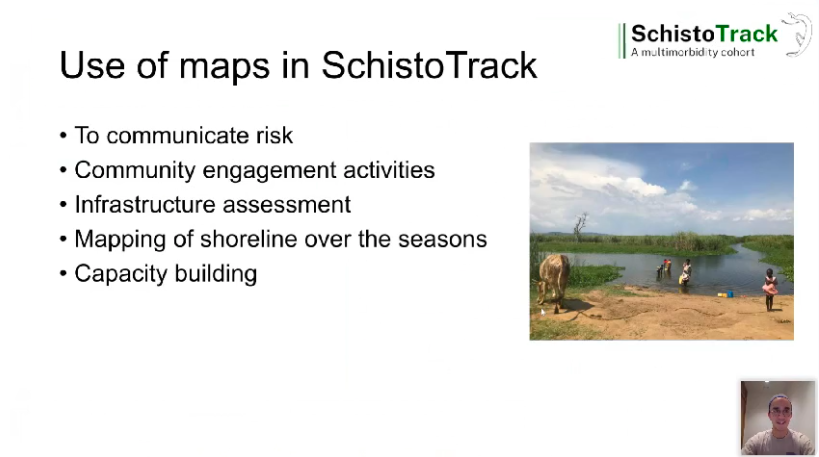
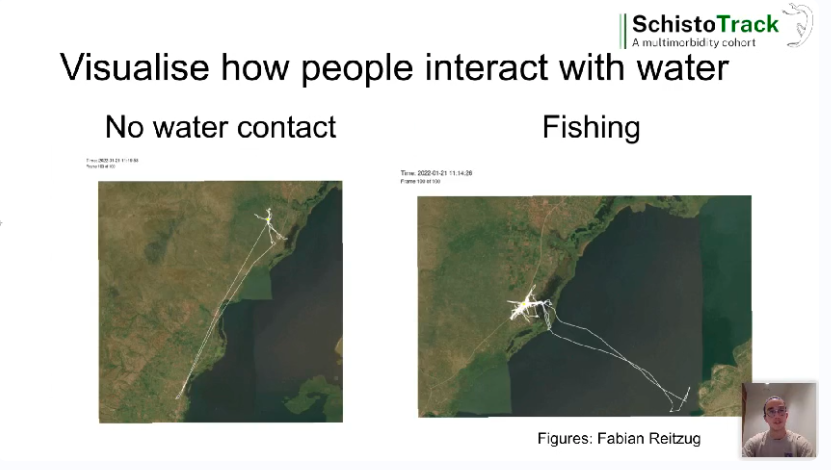
How do we use maps & #dataVisualisation to #BeatNTDs? @SchistoTrack helps monitor epidemiological surveys by connecting geographical information systems in real time, used for communicating risk, community engagement, mapping the shoreline & building capacity. #ISNTDFestival


#DataVisualisation 🎴 Comment transformer vos data en atout stratégique 🎯 Définir vos objectifs 📊 Choisir le bon type de graphique 🧹 Préparer des données fiables 🧠 Donner du contexte 🎨 Soigner le design 🔁 Tester, ajuster • #Data ✍️ @HubSpotFrance buff.ly/7CLJnbO
September 2025 mean CO2 intensity (gCO2eq/kWh) and power consumption breakdown (%) #rstats #datavisualisation Methodology: lnkd.in/gaXQmQ-P h/t @ElectricityMaps
Something went wrong.
Something went wrong.
United States Trends
- 1. Knicks 13.1K posts
- 2. Landry Shamet 1,272 posts
- 3. #AEWDynamite 21.5K posts
- 4. #Survivor49 3,845 posts
- 5. Brandon Williams 1,010 posts
- 6. #CMAawards 5,438 posts
- 7. #AEWCollision 8,693 posts
- 8. Derik Queen 4,002 posts
- 9. Vooch 1,111 posts
- 10. Nikola Vucevic 1,417 posts
- 11. Labaron Philon 1,083 posts
- 12. #mnwild N/A
- 13. Vucci Mane N/A
- 14. FEMA 65.4K posts
- 15. Wallstedt N/A
- 16. Blazers 4,124 posts
- 17. NO CAP 14.3K posts
- 18. Coby White 1,025 posts
- 19. Dubon 3,758 posts
- 20. Naji Marshall N/A