#datavisualisation Suchergebnisse

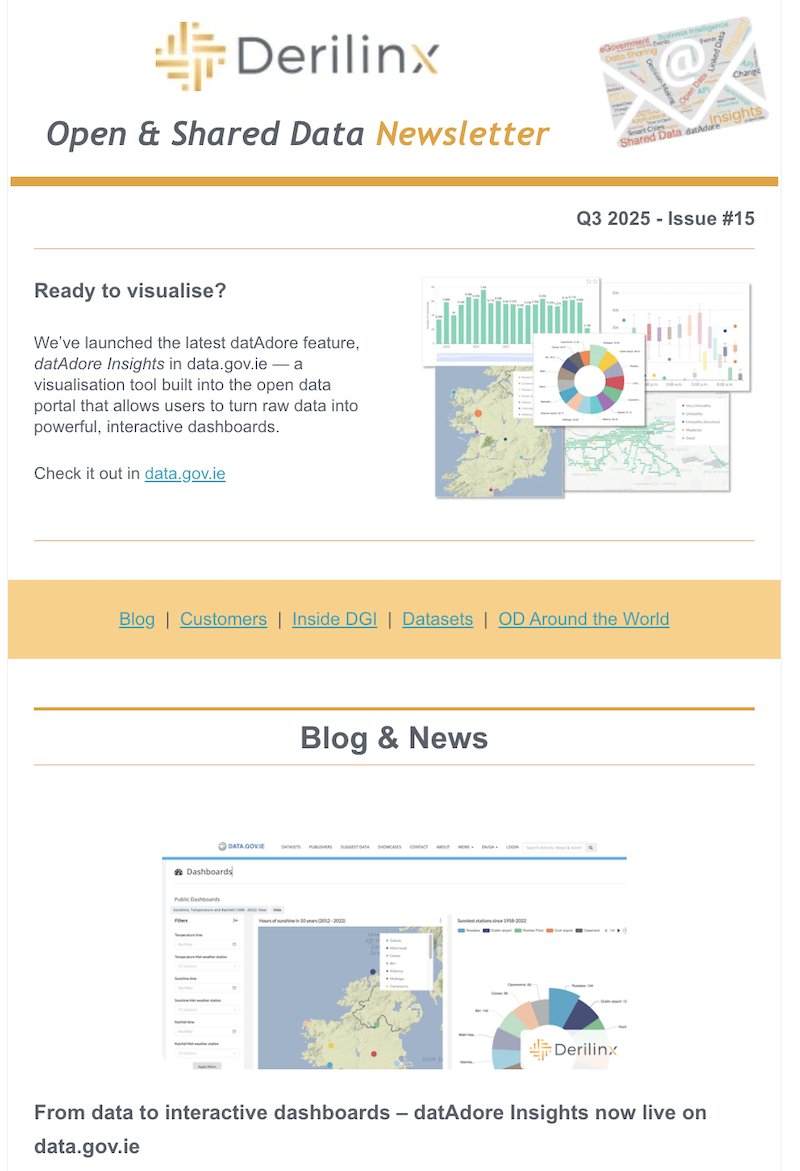
📣Did you miss our Q3 Newsletter! 👉 hubs.ly/Q03PvsV60 Spotlight on #DataVisualisation with the launch of #datAdore Insights on hubs.ly/Q03Pvqxp0 + pilot dashboards. Also: new FAQs page, training from data.europa & more. #DataSharing #OpenData #DataPortal

America is in pain! Take a look at this #datavisualisation. It's shocking. The US has the most expensive healthcare system in the world on a per capita basis. Just last week, UnitedHealthcare CEO Brian Thompson was murdered – a chilling symbol of mounting outrage towards the US…

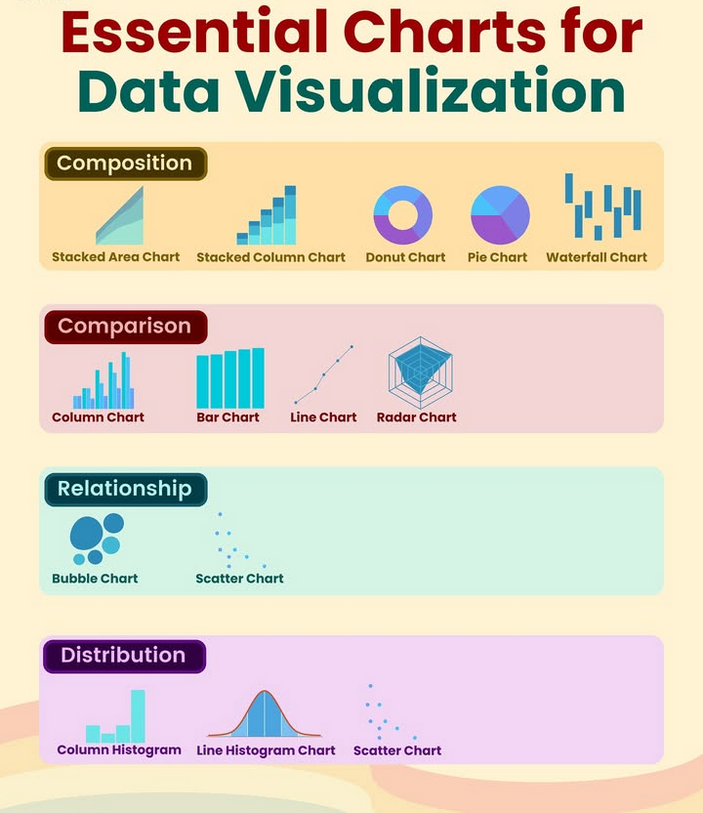
Charts make your data easier to understand—but only if you choose the right one! 📊✨ This guide breaks down popular chart types, so you can show off your data in the clearest way possible—no more guessing! #python #datavisualisation #datavisualizations #datavisualizationdesign…


📊 Transform your data into insights with Power BI! Our hands-on training covers everything from the basics to dashboards & DAX. ✅ Ideal for teams & professionals 📍 Wales or online 👉 computertrainingwales.co.uk/courses/micros… #PowerBI #DataVisualisation #BItraining #UpskillWales

How did you meet your spouse? Times have changed and this #datavisualisation shows just how much this is true. We have shifted away from traditions, where we were once introduced by friends and family, or married our high school sweethearts. It seems the internet has even…

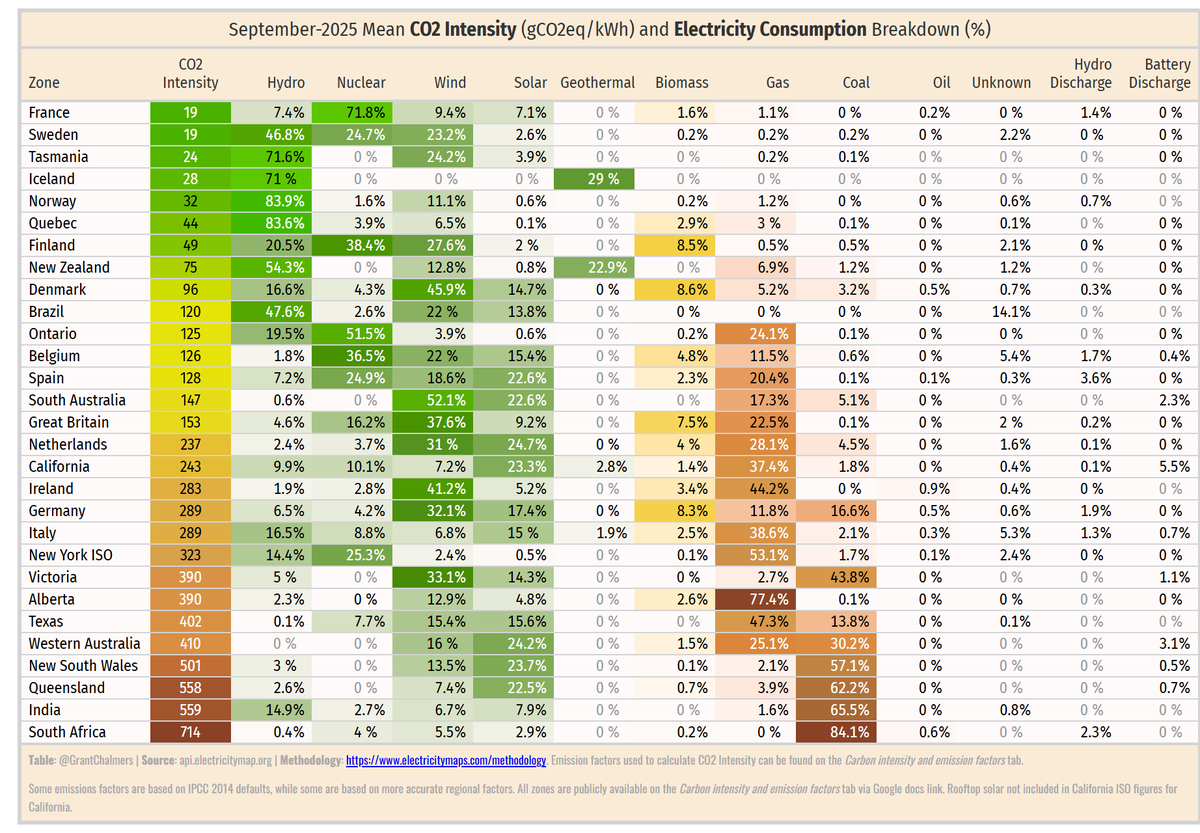
September 2025 mean CO2 intensity (gCO2eq/kWh) and power consumption breakdown (%) #rstats #datavisualisation Methodology: lnkd.in/gaXQmQ-P h/t @ElectricityMaps
📊 Transform your data into insights with Power BI in Bridgend! Our hands-on training covers everything from the basics to dashboards & DAX. ✅ Ideal for teams & professionals 📍 Wales or online 👉 computertrainingwales.co.uk/courses/micros… #PowerBI #DataVisualisation #BItraining #UpskillWales
Essential Charts For Data Visualisation! #Charts #DataVisualisation #python #programming #developer #programmer #coding #coder #softwaredeveloper #computerscience #webdev #webdeveloper #webdevelopment #pythonprogramming #pythonquiz #ai #ml #machinelearning #datascience
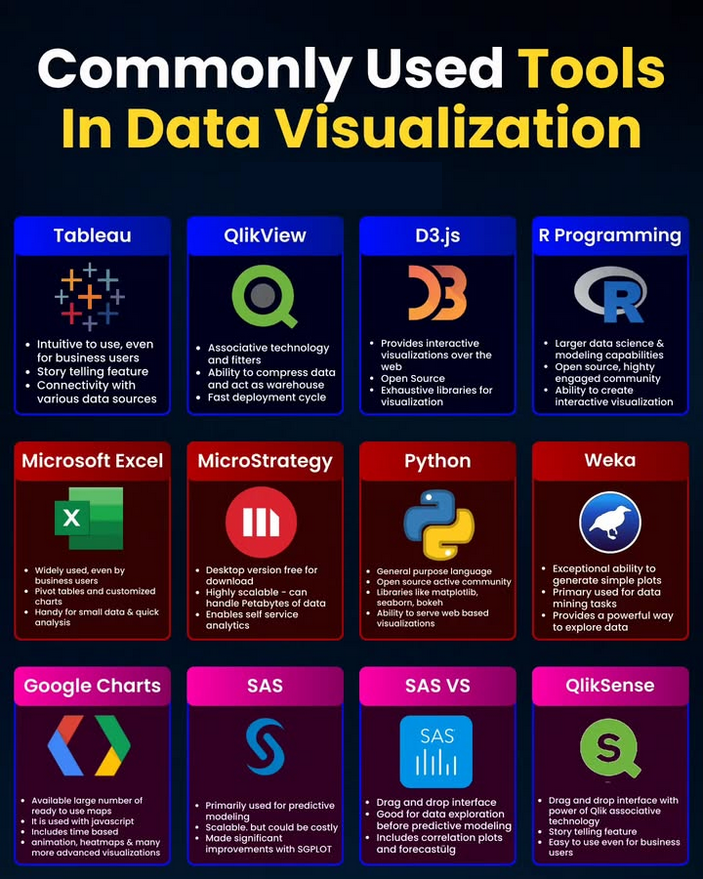
Commonly used Tools In Data Visualisation amzn.to/4aerxXm #DataVisualisation #python #programming #developer #programmer #coding #coder #softwaredeveloper #computerscience #webdev #webdeveloper #webdevelopment #pythonprogramming #pythonquiz #ai #ml #machinelearning…

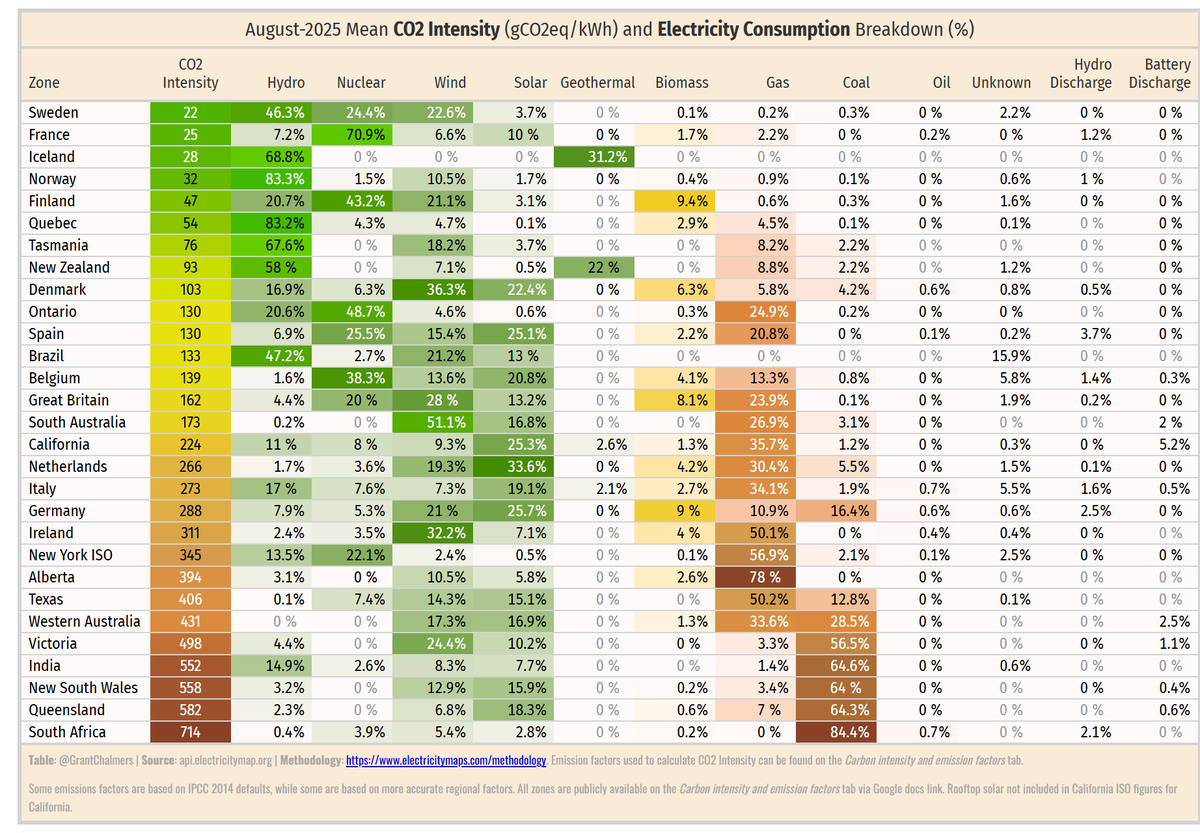
August 2025 mean CO2 intensity (gCO2eq/kWh) and power consumption breakdown (%). Data via Electricity Maps, table via R {gt} package. #rstats #datavisualisation Methodology: lnkd.in/gaXQmQ-P h/t @ElectricityMaps
📊 Transform your data into insights with Power BI! From basics to dashboards & DAX — our hands-on training has you covered. ✅ Perfect for teams & professionals 📍 Wales or online 👉 computertrainingwales.co.uk/courses/micros… #PowerBI #DataVisualisation #BItraining #UpskillWales
Forget everything you thought you knew about the global economy. This #datavisualisation will shatter your worldview. Ditch the "nominal" and embrace the "PPP" measure of GDP. China is now the world's largest. I used something here called Purchasing Power Parity, or PPP. It's…

How did you meet your spouse? Times have changed and this #datavisualisation shows just how much this is true. We have shifted away from traditions, where we were once introduced by friends and family, or married our high school sweethearts. It seems the internet has even…
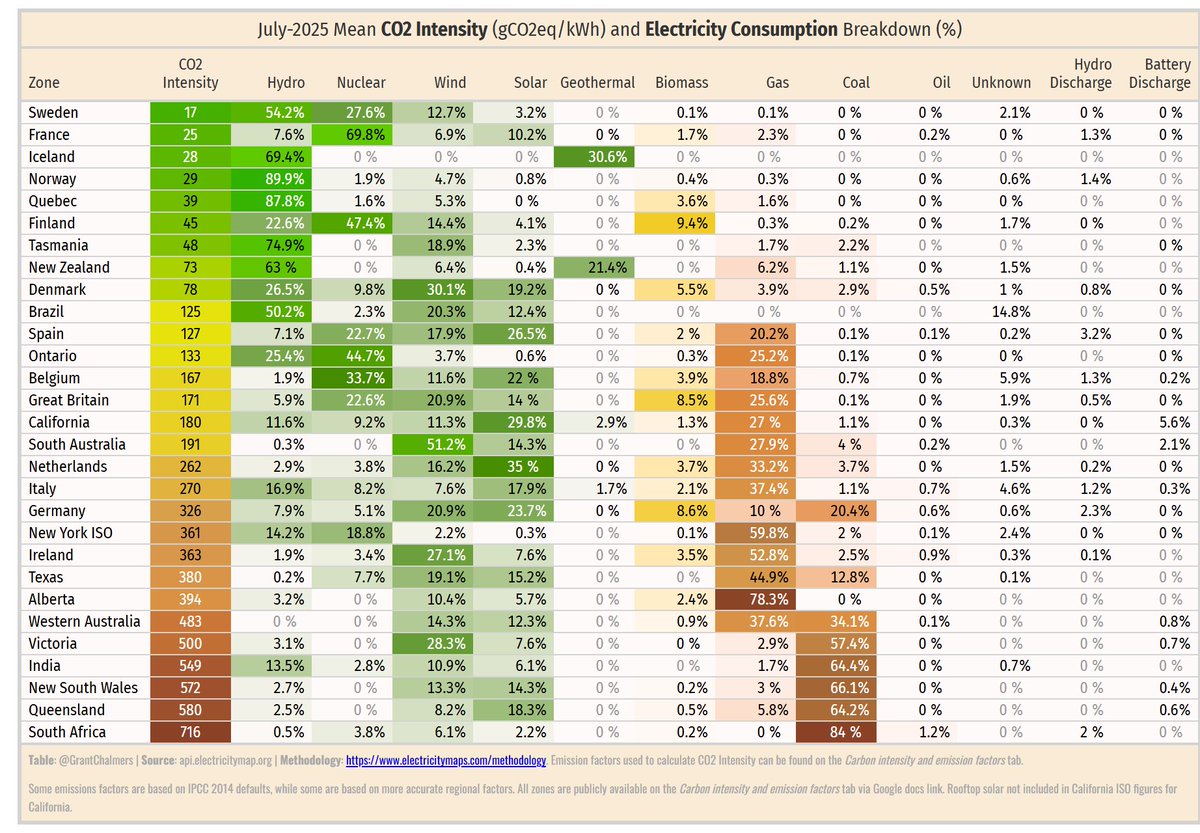
July 2025 mean CO2 intensity (gCO2eq/kWh) and power consumption breakdown (%). Data via Electricity Maps, table via R {gt} package. #rstats #datavisualisation Methodology: lnkd.in/gaXQmQ-P h/t @ElectricityMaps
Wow! Look how much the US job market has transformed over the last 140 years! This #datavisualisation show the complete restructuring of the US economy, through the eyes of the jobs market. It's incredible. Farming once reigned supreme – think crops, livestock and open fields –…
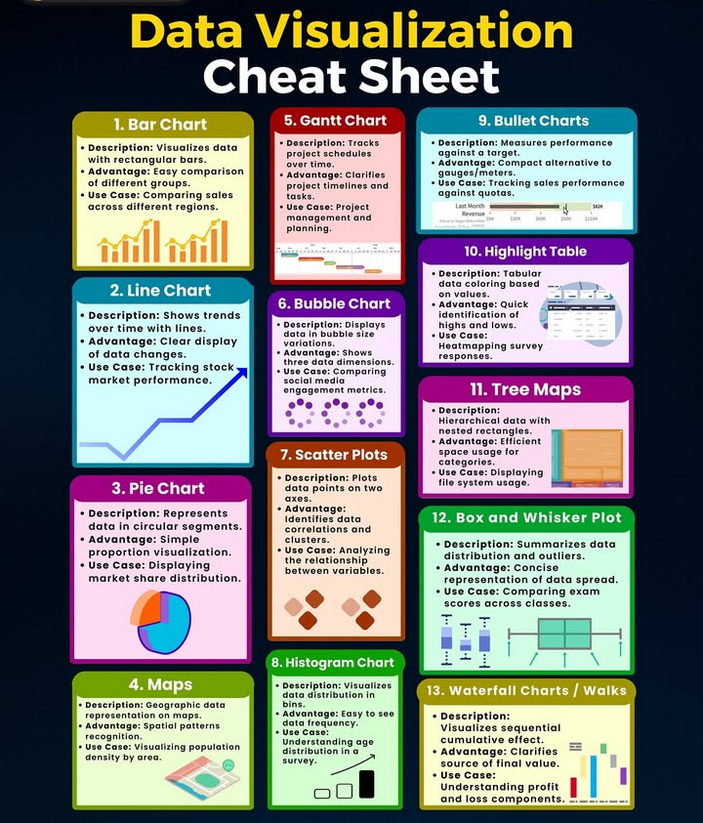
Data Visualisation Cheat Sheet amzn.to/4isL49U #DataVisualisation #python #programming #developer #morioh #programmer #coding #coder #softwaredeveloper #computerscience #webdev #webdeveloper #webdevelopment #pythonprogramming #pythonquiz #ai #ml #machinelearning…

I've run out of my own words, so I will echo James Baldwin: “I'm terrified at the moral apathy, the death of the heart, which is happening in my country...And this means that they have become in themselves moral monsters.” #dataviz #datavisualisation
📣Did you miss our Q3 Newsletter! 👉 hubs.ly/Q03PvsV60 Spotlight on #DataVisualisation with the launch of #datAdore Insights on hubs.ly/Q03Pvqxp0 + pilot dashboards. Also: new FAQs page, training from data.europa & more. #DataSharing #OpenData #DataPortal

Buried in spreadsheets? 📊 These small business data visualisation tips will help you spot trends, make decisions, and ditch data overwhelm. novoit.uk/tech-best-prac… #DataVisualisation #SMBTech #NovoIT

There's always a bit of a brain-fry moment when I'm challenged to make complex scientific concepts understandable and engaging through creative visuals like this one #DataVisualisation #Scicomm

Drowning in data but starved for insights? 📊 Our new blog shows small businesses how to make their numbers speak volumes with simple data visualisation techniques. buff.ly/HMD2Ibh #DataVisualisation #SMBData #BusinessIntelligence #DataDriven #SmallBusinessGrowth


📣Did you miss our Q3 Newsletter! 👉 hubs.ly/Q03PvsV60 Spotlight on #DataVisualisation with the launch of #datAdore Insights on hubs.ly/Q03Pvqxp0 + pilot dashboards. Also: new FAQs page, training from data.europa & more. #DataSharing #OpenData #DataPortal
September 2025 mean CO2 intensity (gCO2eq/kWh) and power consumption breakdown (%) #rstats #datavisualisation Methodology: lnkd.in/gaXQmQ-P h/t @ElectricityMaps
Commonly used Tools In Data Visualisation amzn.to/4aerxXm #DataVisualisation #python #programming #developer #programmer #coding #coder #softwaredeveloper #computerscience #webdev #webdeveloper #webdevelopment #pythonprogramming #pythonquiz #ai #ml #machinelearning…
Essential Charts For Data Visualisation! #Charts #DataVisualisation #python #programming #developer #programmer #coding #coder #softwaredeveloper #computerscience #webdev #webdeveloper #webdevelopment #pythonprogramming #pythonquiz #ai #ml #machinelearning #datascience
Charts make your data easier to understand—but only if you choose the right one! 📊✨ This guide breaks down popular chart types, so you can show off your data in the clearest way possible—no more guessing! #python #datavisualisation #datavisualizations #datavisualizationdesign…

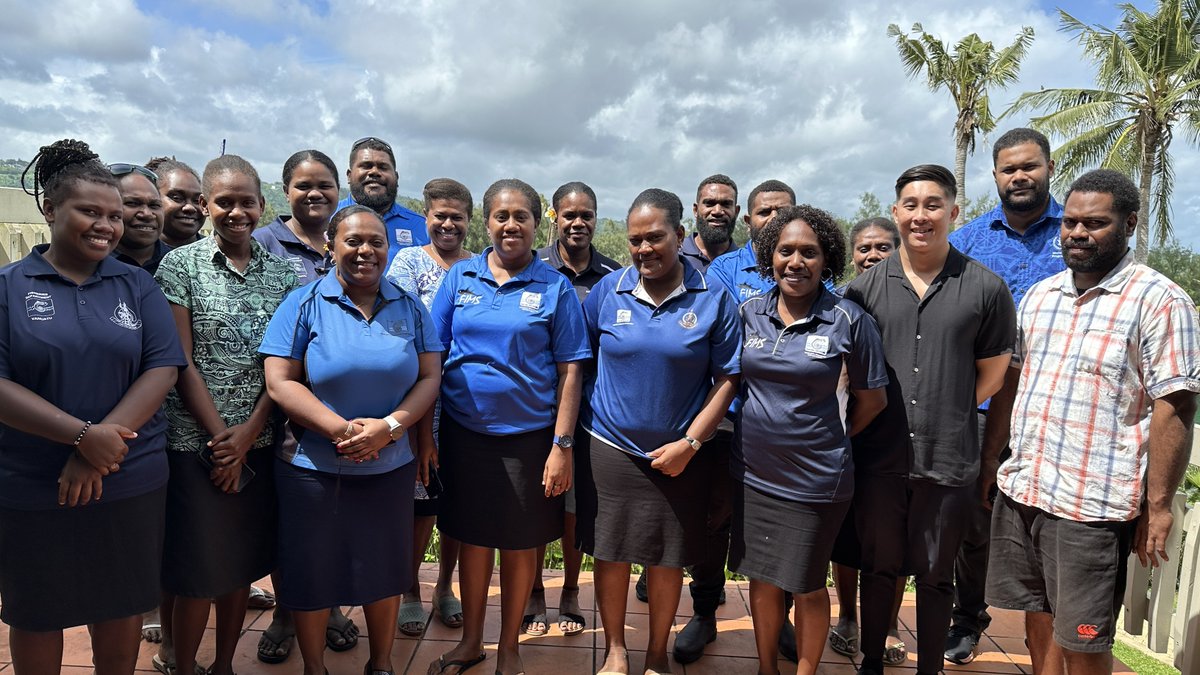
WFP #Pacific is pleased to be in #Vanuatu this week providing #datavisualisation capacity strengthening to the Department of Fisheries. The training is part of our support to strengthen capacity in digital data collection with the Vanuatu Govt's Ministry of Agriculture.🇻🇺
📊 Transform your data into insights with Power BI! Our hands-on training covers everything from the basics to dashboards & DAX. ✅ Ideal for teams & professionals 📍 Wales or online 👉 computertrainingwales.co.uk/courses/micros… #PowerBI #DataVisualisation #BItraining #UpskillWales

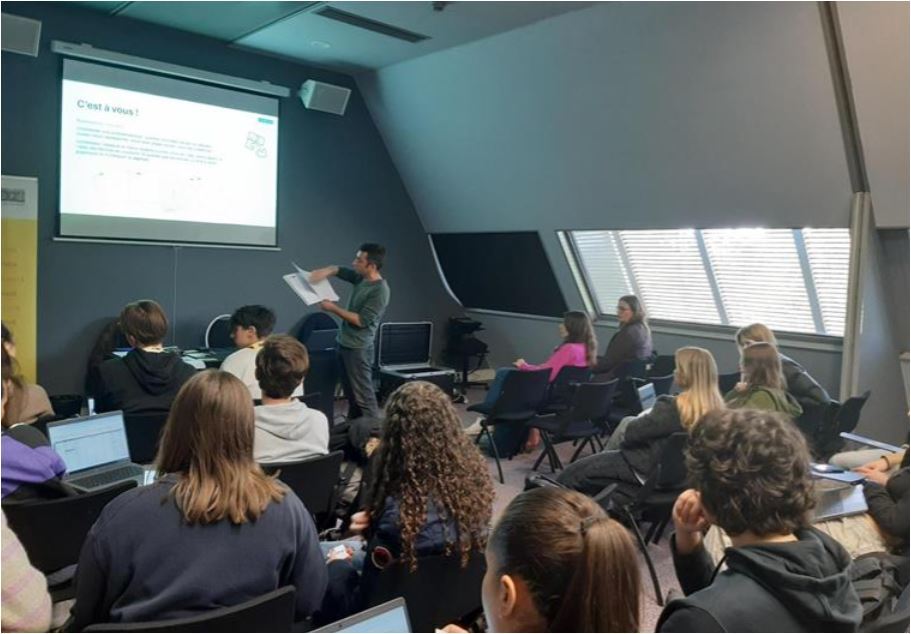
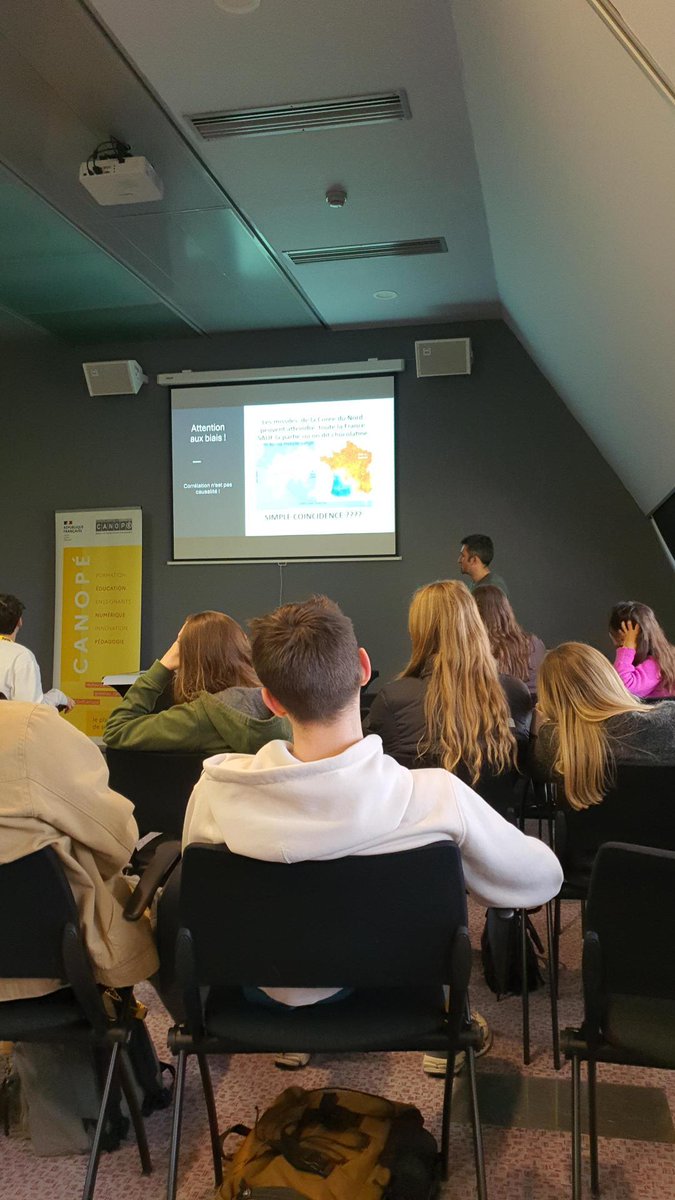
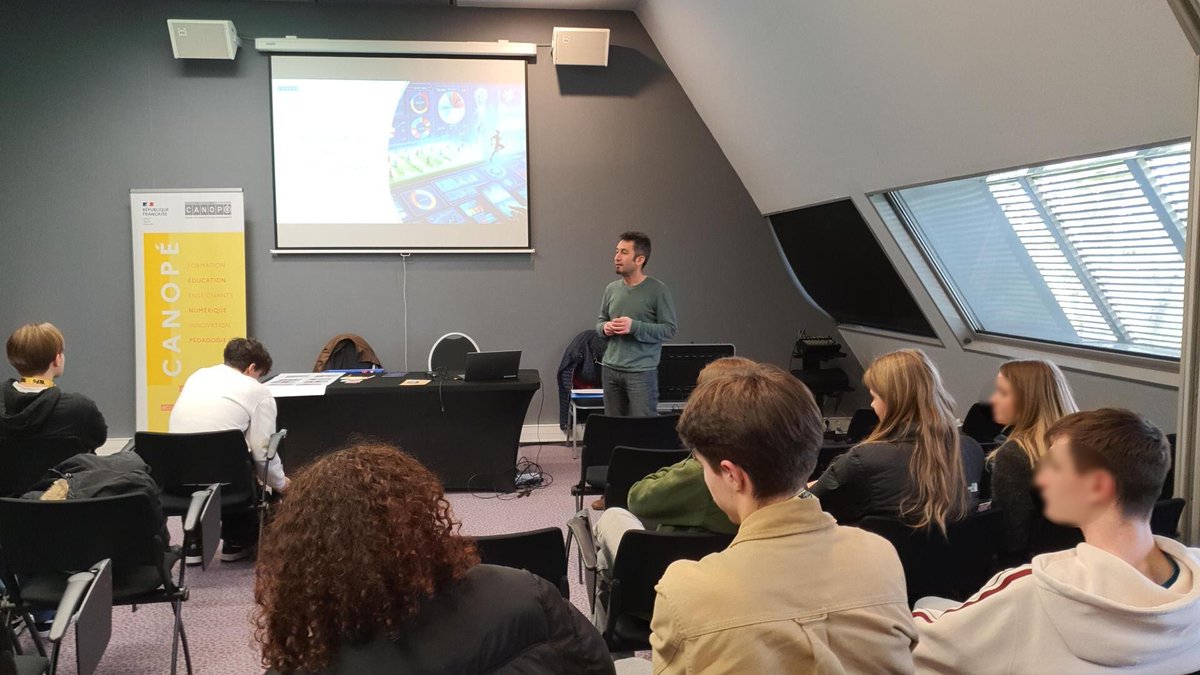
4 classes de collégiens et lycéens de la @RCValdeLoire attentifs & participatifs, à l'atelier proposé par @canope_37 "#Datavisualisation et pratiques sportives" aux #AJTOURS, 17èmes Assises du journalisme de @villedetours, sur la thématique phare "le journalisme, c'est sport" !


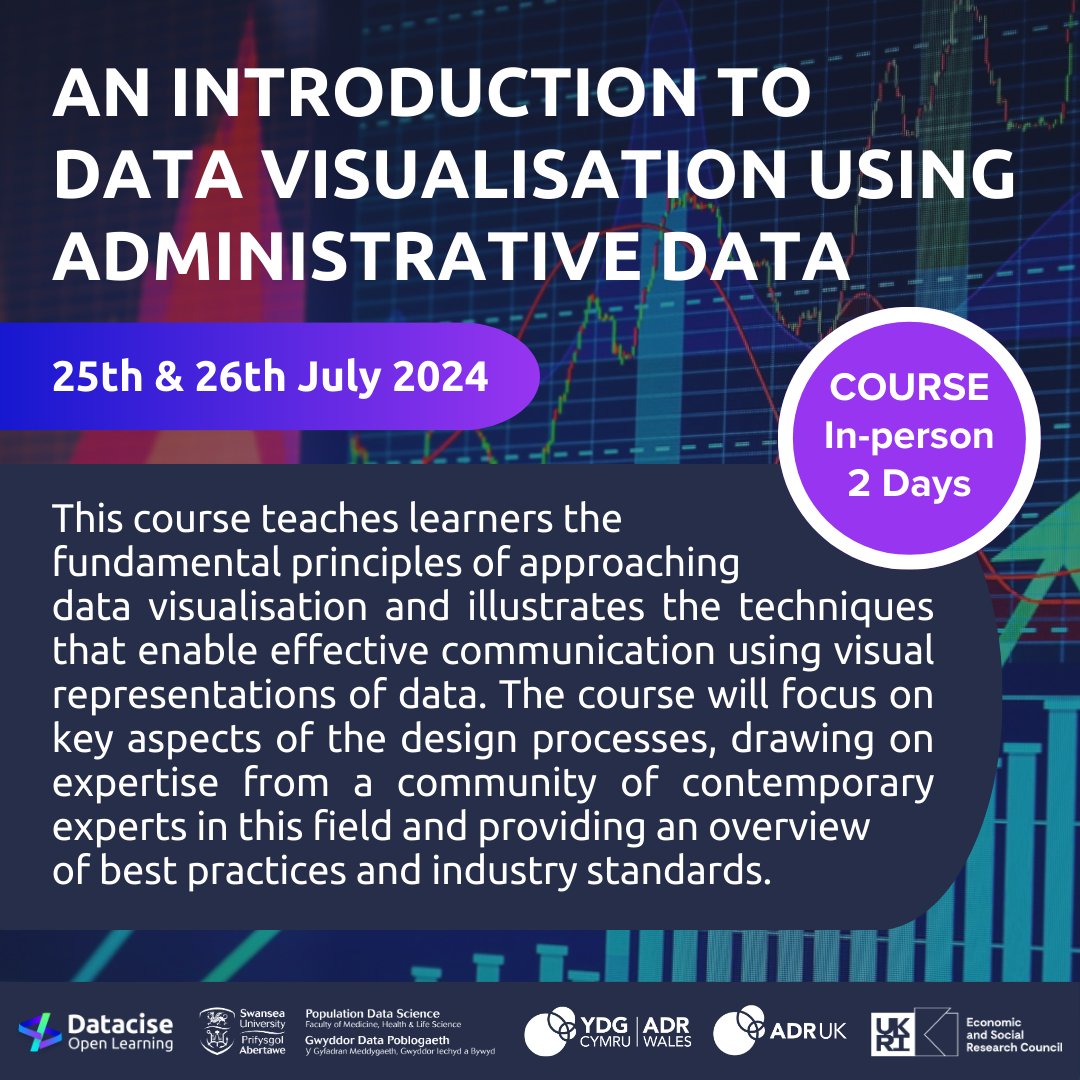
🚀 Join us for our latest course: "Unlocking Insights: Introduction to #DataVisualisation with #AdministrativeData." Get hands-on with cutting-edge tools for research output. Don't miss out on this interactive two-day in-person session! Learn more & sign up now 👇…

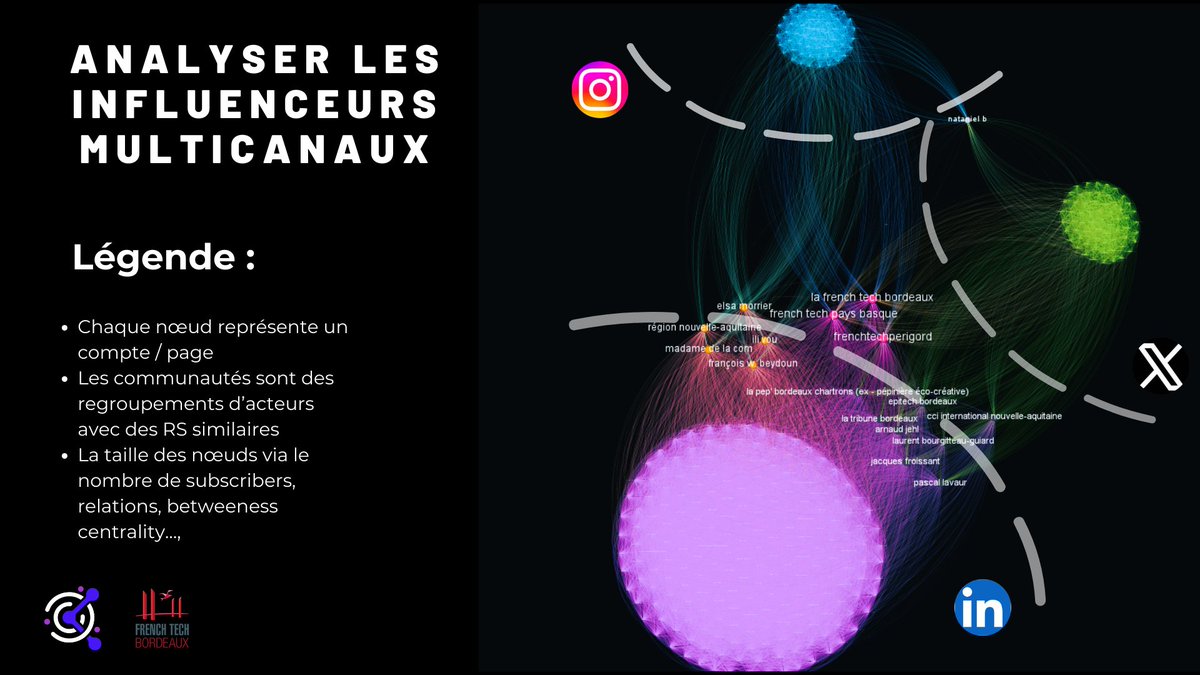
Je suis excité à l'idée de vous montrer notre premier #Graph d'influence (X - Instagram - LinkedIn) 🔥 Ce type de #datavisualisation très pertinente détecte les Ambassadeurs et permet d'enclencher des leviers d'influences multicanaux ! #influencemarketing #data #DataScience

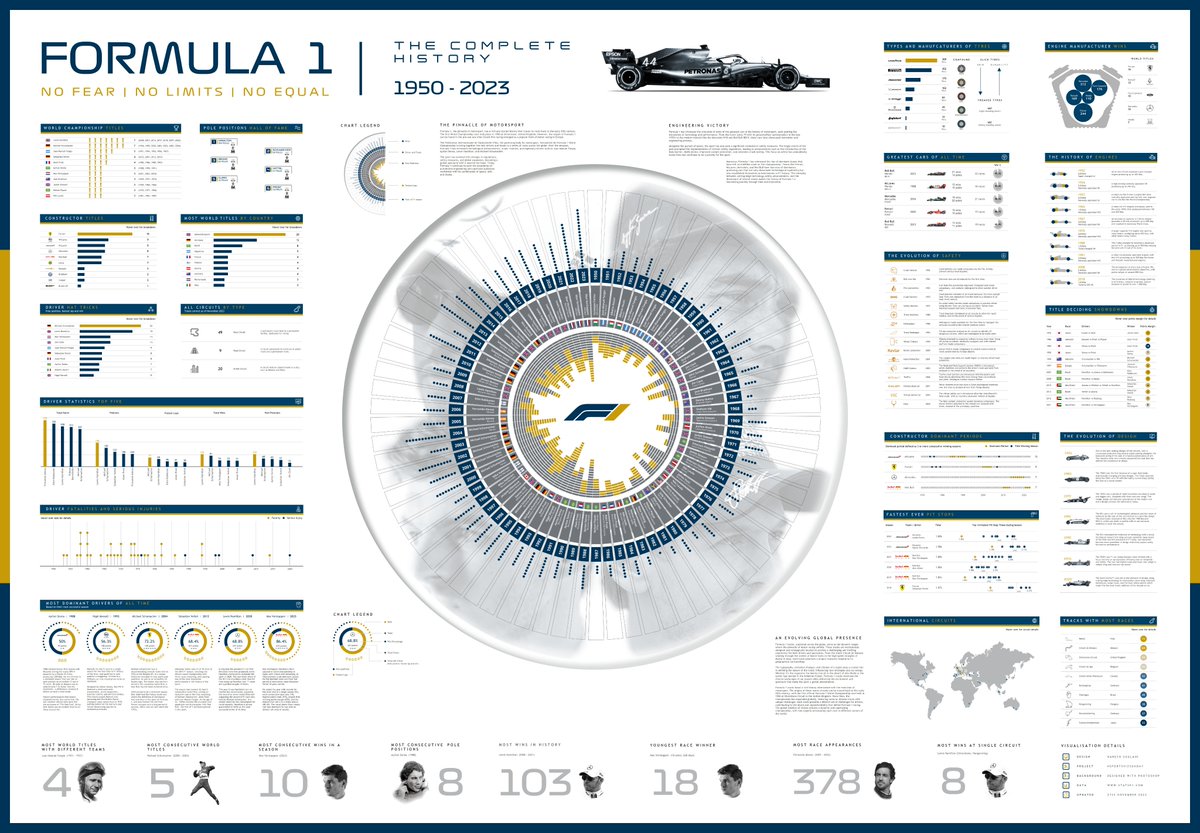
My last visualisation of 2023. The complete history of @F1 , from 1950 - 2023. The Pinnacle of Motorsport. Link: public.tableau.com/app/profile/na… @tableaupublic , @tableau , @SkySportsF1 , #datafam , #sportsvizsunday , #datavisualisation , #DataAnalytics, #Motorsport , #Infographic

With 6 days to go till our Members' Meeting, we invite you to consider the amazing training opportunities we'll have on offer! The meeting is free to attend for BNA members. Register here: bna.org.uk/mediacentre/ev… #BNAMembersMeeting2024 #ApplyingtoFellowships #DataVisualisation

Data Visualisation Cheat Sheet amzn.to/4isL49U #DataVisualisation #python #programming #developer #morioh #programmer #coding #coder #softwaredeveloper #computerscience #webdev #webdeveloper #webdevelopment #pythonprogramming #pythonquiz #ai #ml #machinelearning…

Thank you @BojanicLana @FBMH_UoM for running a fun and accessible R Workshop yesterday #Data #RStats #DataVisualisation

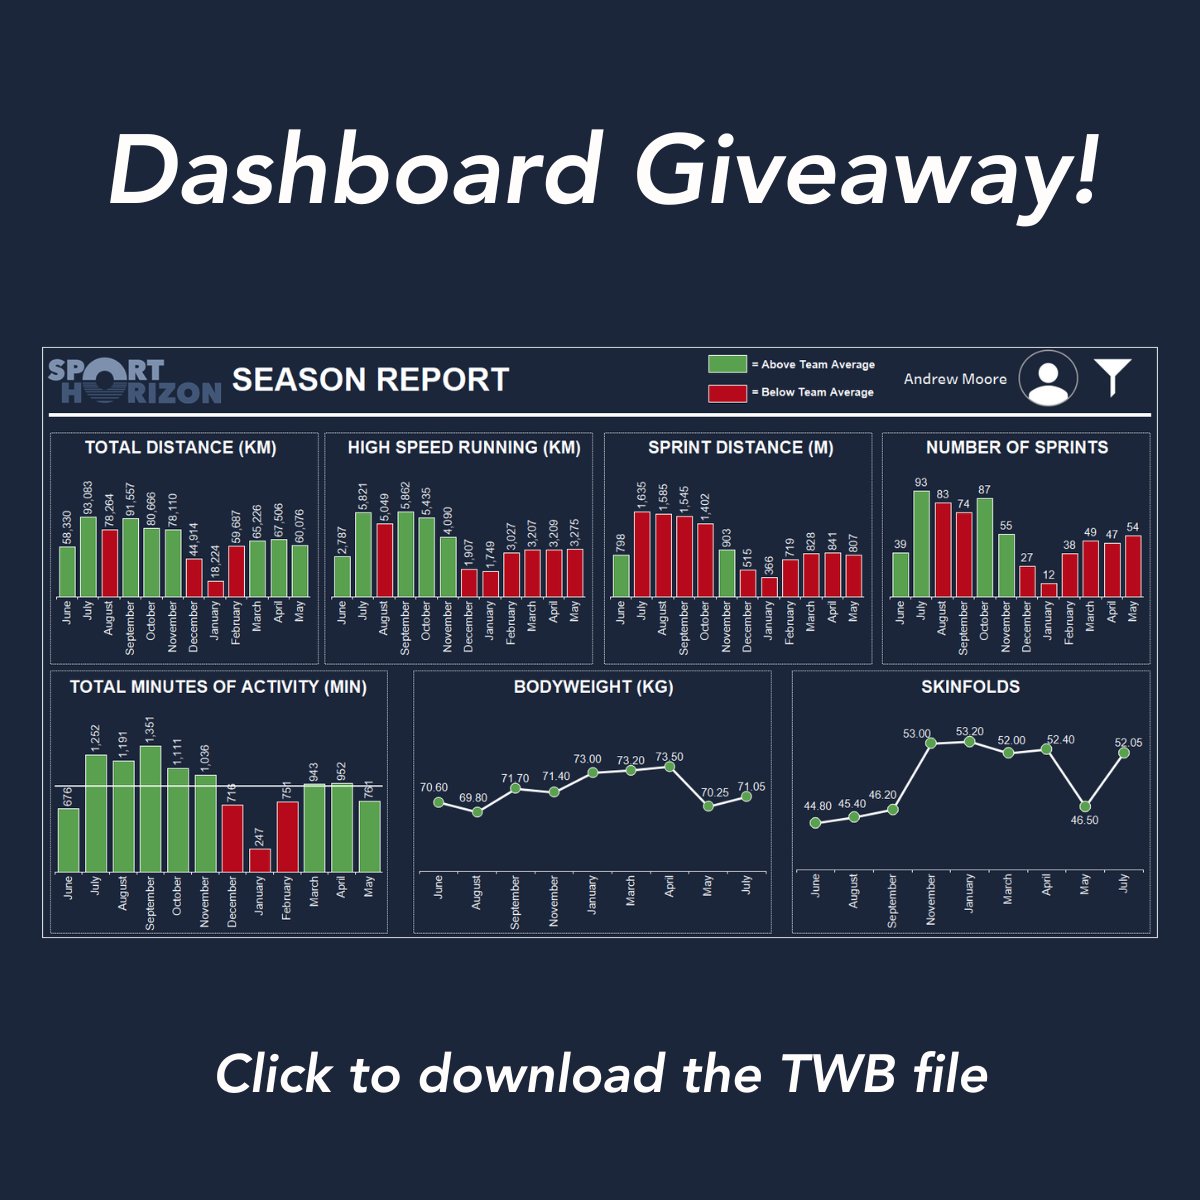
🔥Fresh Drop🔥 You voted, we delivered. The top-rated Tableau dashboard from our recent poll is now live and ready to transform your data game 💥📊 Download it now 👉 sporthorizon.co.uk/free-dashboard… #Tableau #PowerBI #DataVisualisation #SportsAnalytics #SportHorizon #SportScience…

#DataVisualisation for Environmental Visual Communication: A Case Study What is the purpose of data visualisation? It’s supposed to be a way to represent information quickly and effectively through the use of charts, graphs and tables. However, it’s commonly found that data…

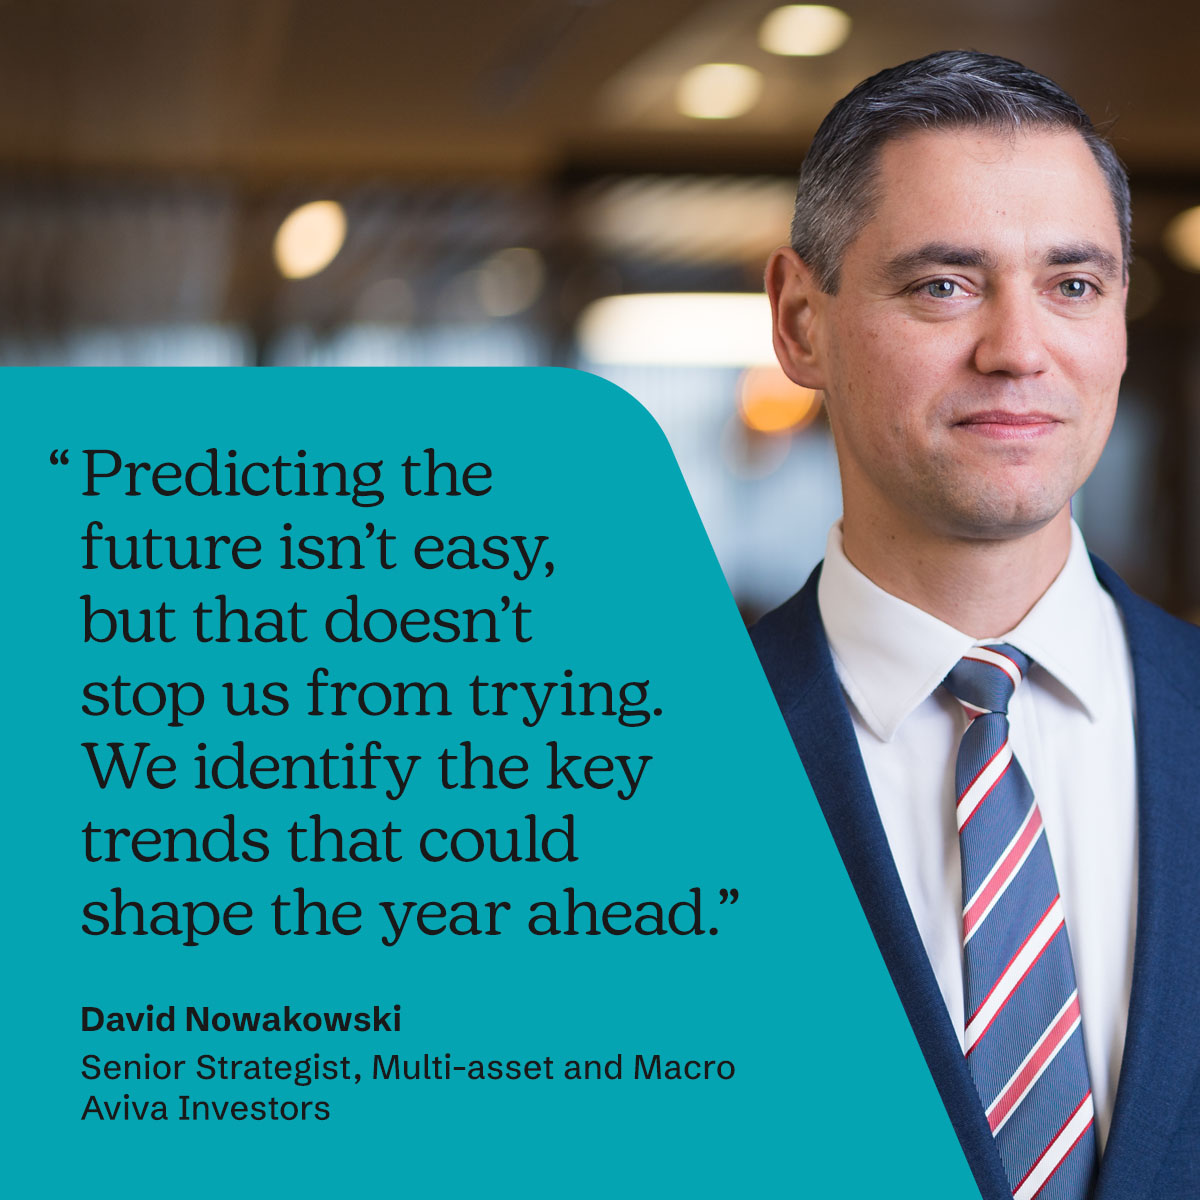
🚚📱🌎 Shifts in trade, tech and geopolitical tensions could define how 2025 pans out for investors. Find out more in our latest insight "Five big trends to watch in 2025" 💡 bit.ly/4h5AO6x #MultiAssets #DataVisualisation #Economics
Join our NEW COURSE: Unlocking Insights: Introduction to #DataVisualisation with #AdministrativeData 🚀 Learn to use contemporary tools to produce output from research activities. Two-day, highly interactive, in-person course. Learn more & sign up here 👇 dataciseopenlearning.org/courses/introd…

Something went wrong.
Something went wrong.
United States Trends
- 1. #Talus_Labs N/A
- 2. Good Wednesday 29K posts
- 3. #wednesdaymotivation 5,373 posts
- 4. Hump Day 16.1K posts
- 5. #HeartQuakeMV 262K posts
- 6. $BYND 124K posts
- 7. ZEENUNEW CRAZY SINGLE 262K posts
- 8. Bwipo 1,465 posts
- 9. Usha Vance 9,941 posts
- 10. #Wednesdayvibe 1,980 posts
- 11. #13YearsofRed N/A
- 12. Howard University N/A
- 13. Izzo N/A
- 14. Beyond Meat 7,770 posts
- 15. Happy Hump 10.6K posts
- 16. Froot N/A
- 17. Keke 5,891 posts
- 18. St. John Paul 2,901 posts
- 19. Jen Psaki 11.7K posts
- 20. SEKI HONEYMOON X LINGORM 603K posts