#facetgrid search results


¡Chicos! 🚀 Hoy quiero compartir con ustedes un resumen sobre el objeto FacetGrid en Seaborn. 📊 Veremos cómo usarlo, para qué nos resulta útil y otros datos interesantes. #Seaborn #FacetGrid 🧵👇🏼

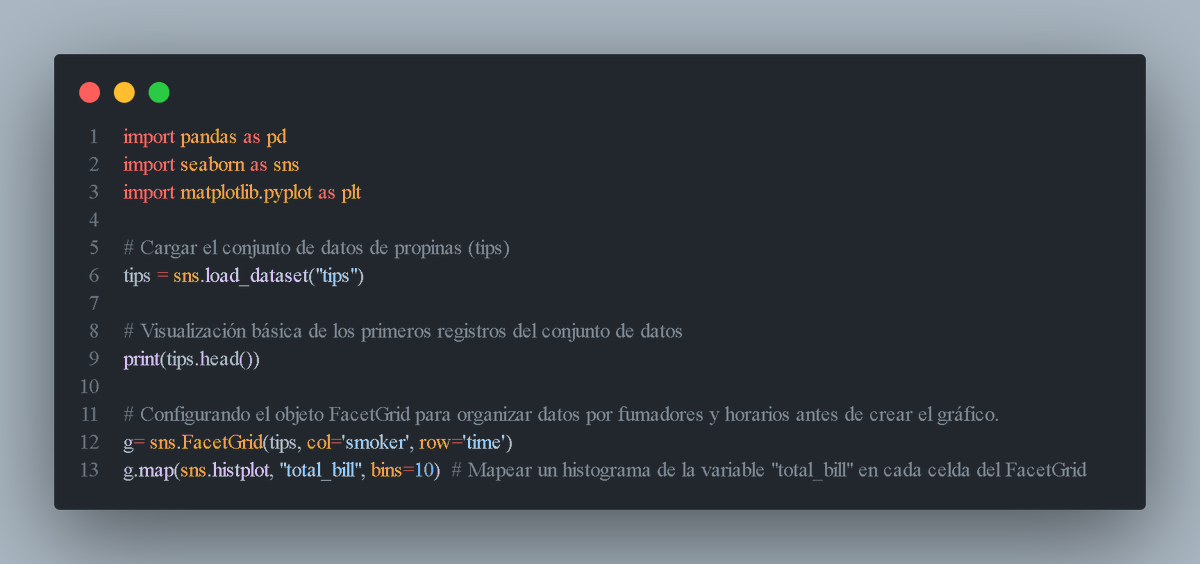
En este caso usamos #FacetGrid para crear una cuadrícula de gráficos, donde cada fila representa si la persona fumó o no, y cada columna representa el tiempo de la comida, si es almuerzo o cena. 🔍💼 #VisualizaciónDeDatos #Python

Change order margin is presented in facet_grid ggplot2? stackoverflow.com/questions/6432… #r #facetgrid #ggplot2


Boxplots within violin plot with faceting and fill R stackoverflow.com/questions/5254… #ggplot2 #facetgrid #violinplot #r #boxplot

Is it possible to use geom_table() along facet_grid()? stackoverflow.com/questions/6481… #r #facetgrid #ggplot2

Creating equally sized (in cm!) geom_rect with a facet_grid with free axes stackoverflow.com/questions/6617… #facetgrid #r #ggplot2

ValueError: `multiple` must be one of ['layer', 'stack', 'fill', 'dodge'], but s was passed.` stackoverflow.com/questions/6696… #facetgrid #python #seaborn
![overflow_meme's tweet image. ValueError: `multiple` must be one of ['layer', 'stack', 'fill', 'dodge'], but s was passed.` stackoverflow.com/questions/6696… #facetgrid #python #seaborn](https://pbs.twimg.com/media/EySmb7zWEAA7ypx.jpg)
How to format the y- or x-axis labels in a seaborn FacetGrid stackoverflow.com/questions/6371… #seaborn #python #facetgrid

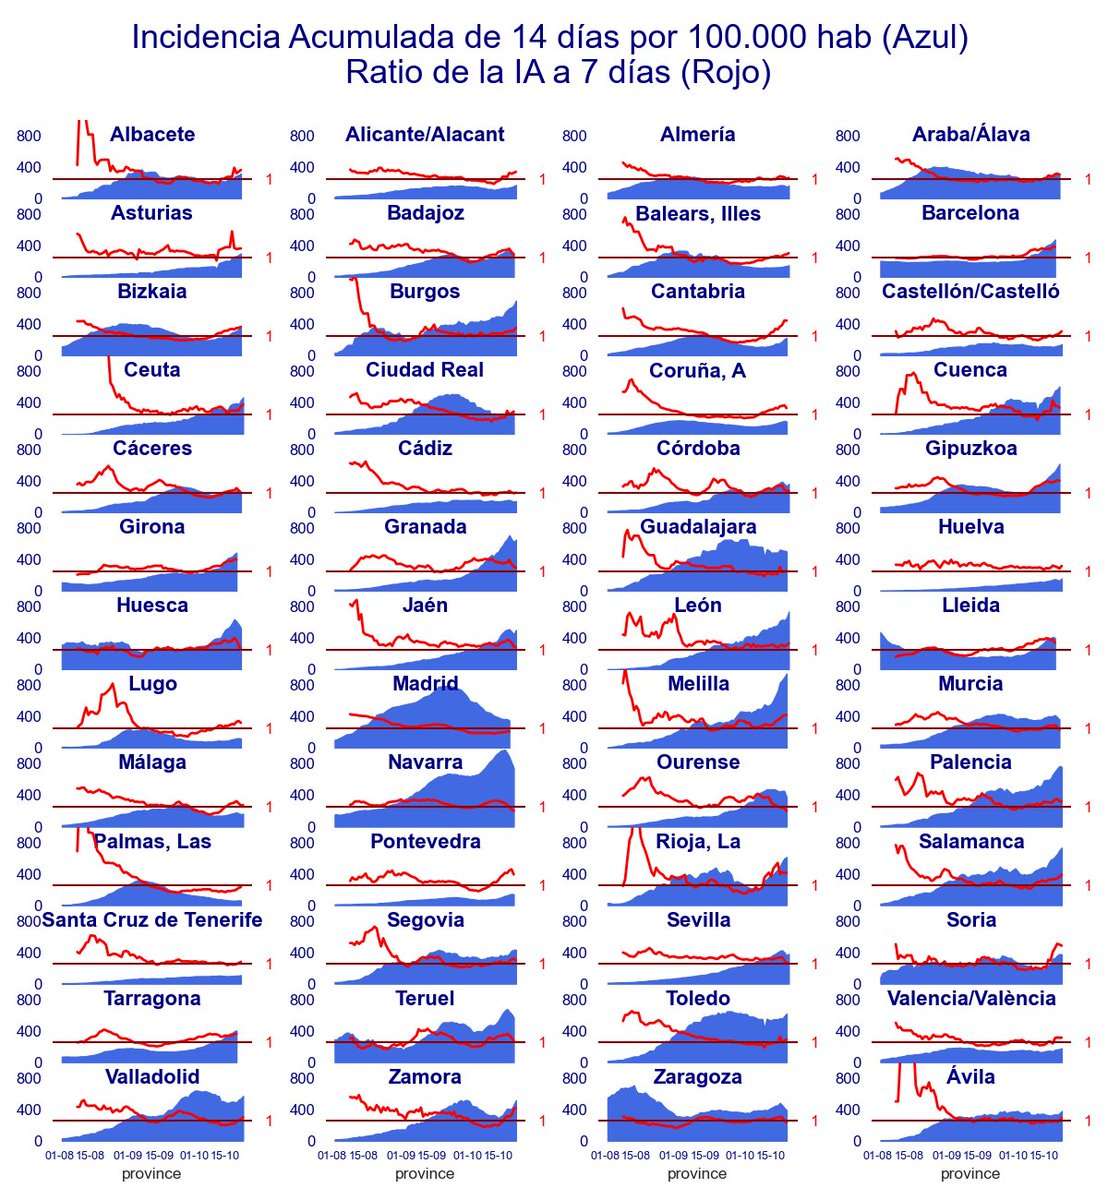
コロナウイルス感染者数をプロットしてみたら、日本とシンガポールのだらだら増えてる感じが似てるけど、ここ数日のシンガポールはやばい。対数軸の方見ると増え方よくわかります。やっと複数グラフを描くところまで来ました。 #python #seaborn #facetgrid #COVID19 #コロナウィルス #StayHome


¡También pueden consultar este tutorial que encontré, donde explican paso a paso cómo usar el objeto FacetGrid con diferentes tipos de gráficos. 📚📊 #Tutorial #DataViz #FacetGrid #VisualizaciónDeDatos youtu.be/YYeqJllXHxM?si…
Es muy importante conocer el objeto FacetGrid 🔍 porque nos permite explorar los datos de forma rápida y sencilla. Además, nos ayuda a crear gráficos atractivos y profesionales 📊, que podemos usar para comunicar nuestros hallazgos 🔬. #VisualizaciónDeDatos #FacetGrid
Definición: 📊 El objeto FacetGrid es una forma de crear gráficos que muestran la relación entre una o más variables numéricas y una o más variables categóricas. 📚 #VisualizaciónDeDatos #Python #FacetGrid
#Seaborn #FacetGrid #Python I wrote an article titled 'FacetGrid in Seaborn'. ailogsite.netlify.app/2024/10/25/202…

The first post is already out! *Crime in San Francisco: Using Seaborn FacetGrid and contextily* viz4sci.substack.com/p/crime-in-san… In this post we use #Seaborn's #FacetGrid and #contextily to visualize the San Francisco crime dataset from @kaggle.
#Seaborn #FacetGrid #Python I wrote an article titled 'FacetGrid in Seaborn'. ailogsite.netlify.app/2024/10/25/202…
¡También pueden consultar este tutorial que encontré, donde explican paso a paso cómo usar el objeto FacetGrid con diferentes tipos de gráficos. 📚📊 #Tutorial #DataViz #FacetGrid #VisualizaciónDeDatos youtu.be/YYeqJllXHxM?si…
Es muy importante conocer el objeto FacetGrid 🔍 porque nos permite explorar los datos de forma rápida y sencilla. Además, nos ayuda a crear gráficos atractivos y profesionales 📊, que podemos usar para comunicar nuestros hallazgos 🔬. #VisualizaciónDeDatos #FacetGrid
En este caso usamos #FacetGrid para crear una cuadrícula de gráficos, donde cada fila representa si la persona fumó o no, y cada columna representa el tiempo de la comida, si es almuerzo o cena. 🔍💼 #VisualizaciónDeDatos #Python
Definición: 📊 El objeto FacetGrid es una forma de crear gráficos que muestran la relación entre una o más variables numéricas y una o más variables categóricas. 📚 #VisualizaciónDeDatos #Python #FacetGrid
¡Chicos! 🚀 Hoy quiero compartir con ustedes un resumen sobre el objeto FacetGrid en Seaborn. 📊 Veremos cómo usarlo, para qué nos resulta útil y otros datos interesantes. #Seaborn #FacetGrid 🧵👇🏼
The first post is already out! *Crime in San Francisco: Using Seaborn FacetGrid and contextily* viz4sci.substack.com/p/crime-in-san… In this post we use #Seaborn's #FacetGrid and #contextily to visualize the San Francisco crime dataset from @kaggle.
How to format the y- or x-axis labels in a seaborn FacetGrid stackoverflow.com/questions/6371… #seaborn #python #facetgrid
ValueError: `multiple` must be one of ['layer', 'stack', 'fill', 'dodge'], but s was passed.` stackoverflow.com/questions/6696… #facetgrid #python #seaborn
Creating equally sized (in cm!) geom_rect with a facet_grid with free axes stackoverflow.com/questions/6617… #facetgrid #r #ggplot2
Is it possible to use geom_table() along facet_grid()? stackoverflow.com/questions/6481… #r #facetgrid #ggplot2
Change order margin is presented in facet_grid ggplot2? stackoverflow.com/questions/6432… #r #facetgrid #ggplot2
Boxplots within violin plot with faceting and fill R stackoverflow.com/questions/5254… #ggplot2 #facetgrid #violinplot #r #boxplot
コロナウイルス感染者数をプロットしてみたら、日本とシンガポールのだらだら増えてる感じが似てるけど、ここ数日のシンガポールはやばい。対数軸の方見ると増え方よくわかります。やっと複数グラフを描くところまで来ました。 #python #seaborn #facetgrid #COVID19 #コロナウィルス #StayHome

Change order margin is presented in facet_grid ggplot2? stackoverflow.com/questions/6432… #r #facetgrid #ggplot2
¡Chicos! 🚀 Hoy quiero compartir con ustedes un resumen sobre el objeto FacetGrid en Seaborn. 📊 Veremos cómo usarlo, para qué nos resulta útil y otros datos interesantes. #Seaborn #FacetGrid 🧵👇🏼
En este caso usamos #FacetGrid para crear una cuadrícula de gráficos, donde cada fila representa si la persona fumó o no, y cada columna representa el tiempo de la comida, si es almuerzo o cena. 🔍💼 #VisualizaciónDeDatos #Python
Boxplots within violin plot with faceting and fill R stackoverflow.com/questions/5254… #ggplot2 #facetgrid #violinplot #r #boxplot
Is it possible to use geom_table() along facet_grid()? stackoverflow.com/questions/6481… #r #facetgrid #ggplot2
How to format the y- or x-axis labels in a seaborn FacetGrid stackoverflow.com/questions/6371… #seaborn #python #facetgrid
Creating equally sized (in cm!) geom_rect with a facet_grid with free axes stackoverflow.com/questions/6617… #facetgrid #r #ggplot2
ValueError: `multiple` must be one of ['layer', 'stack', 'fill', 'dodge'], but s was passed.` stackoverflow.com/questions/6696… #facetgrid #python #seaborn
Something went wrong.
Something went wrong.
United States Trends
- 1. #WWERaw 68.6K posts
- 2. Purdy 27.2K posts
- 3. Panthers 36.6K posts
- 4. Bryce 20.3K posts
- 5. 49ers 40K posts
- 6. Timberwolves 3,131 posts
- 7. Canales 13K posts
- 8. Gonzaga 3,715 posts
- 9. Finch 14.3K posts
- 10. #FTTB 5,596 posts
- 11. Penta 10.1K posts
- 12. Keegan Murray N/A
- 13. Mac Jones 4,858 posts
- 14. Niners 5,621 posts
- 15. Amen Thompson 1,781 posts
- 16. #KeepPounding 5,306 posts
- 17. Zags N/A
- 18. Malik Monk N/A
- 19. Gunther 14.7K posts
- 20. Jennings 8,702 posts