#interferogram search results

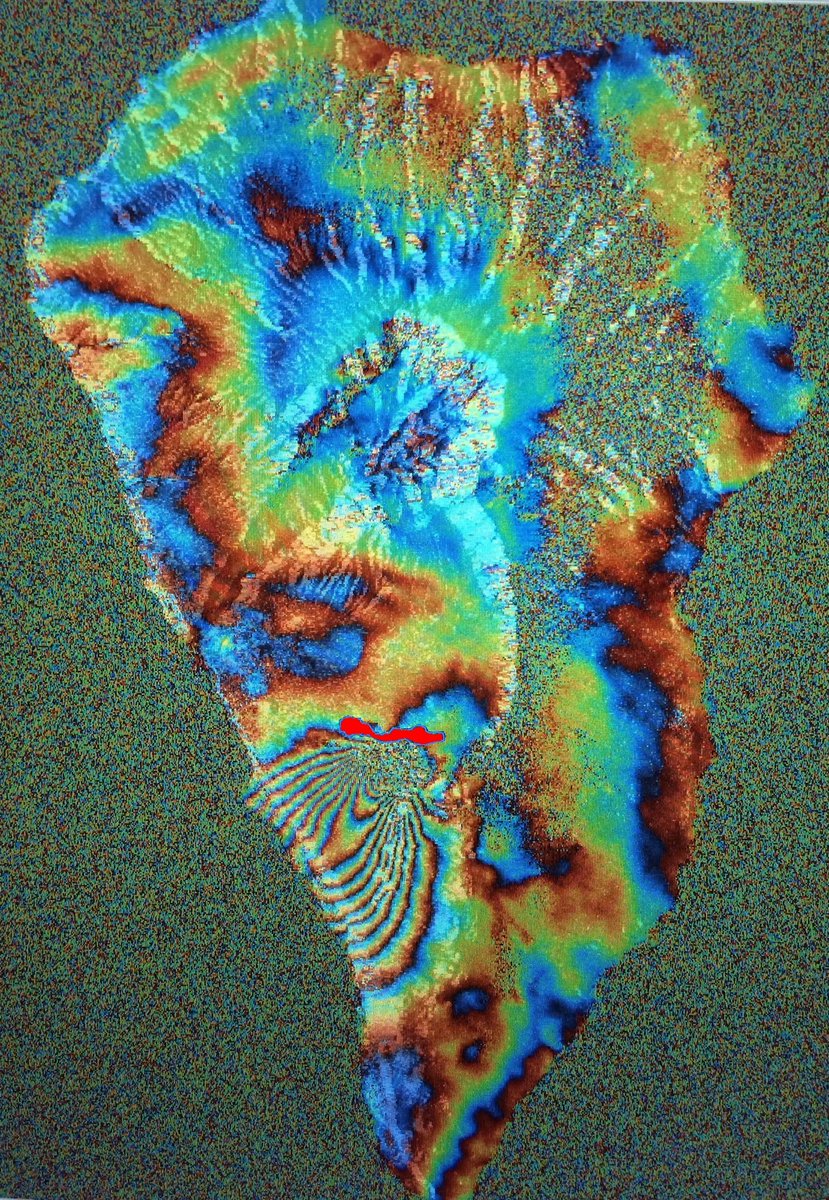
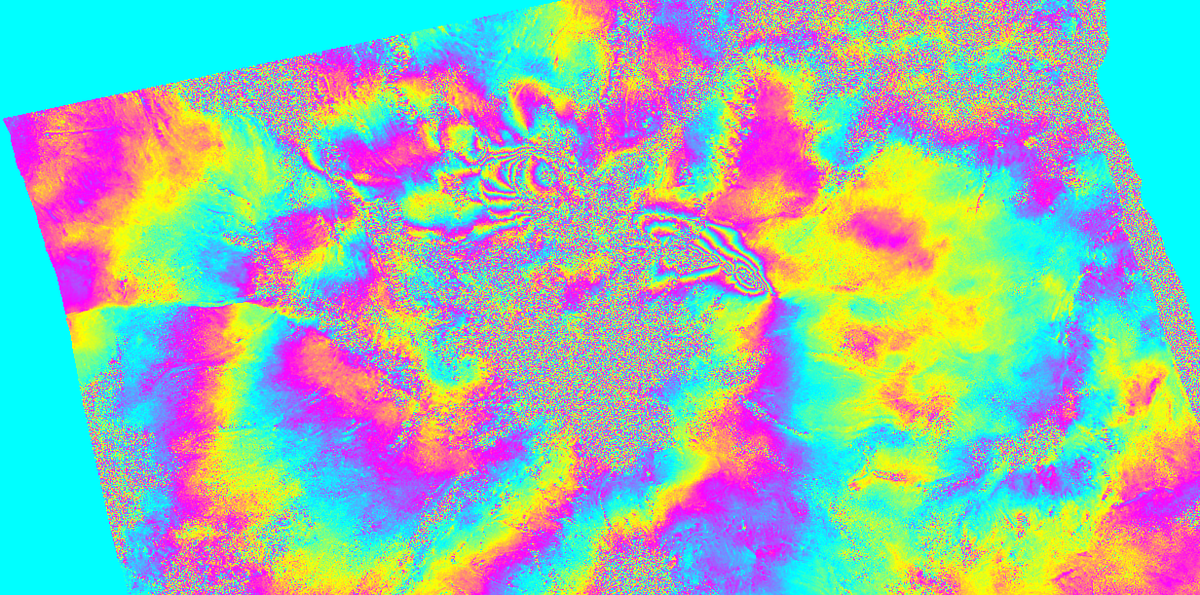
#LaPalmaEruption 🌋 Signal of soil deformation in the fissure eruption of #CumbreVieja Using data from the #Interferogram of the #Sentinel1 of @pabloj_gonzalez from September 14 and 20 and the data of @CopernicusEMS of the affected area (red), it results in this map #EMSR546


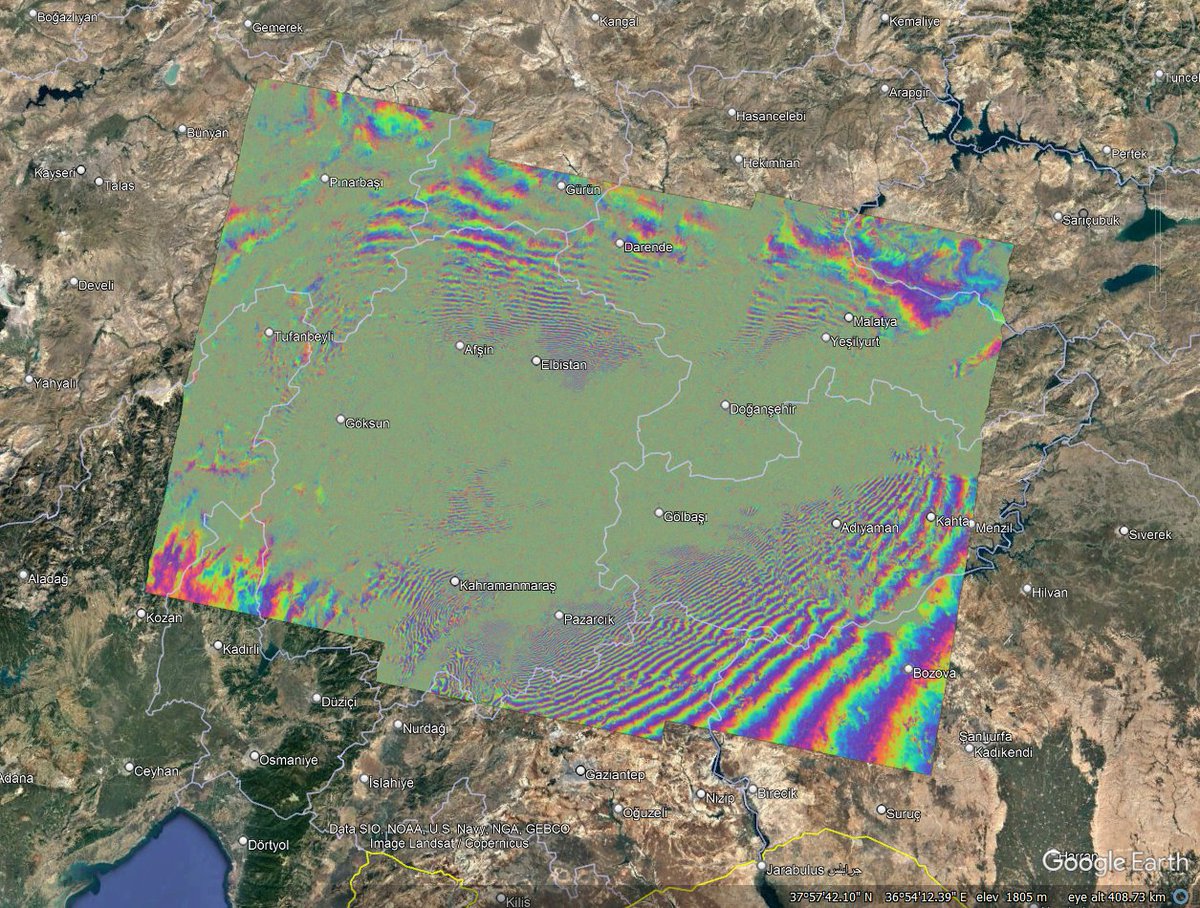
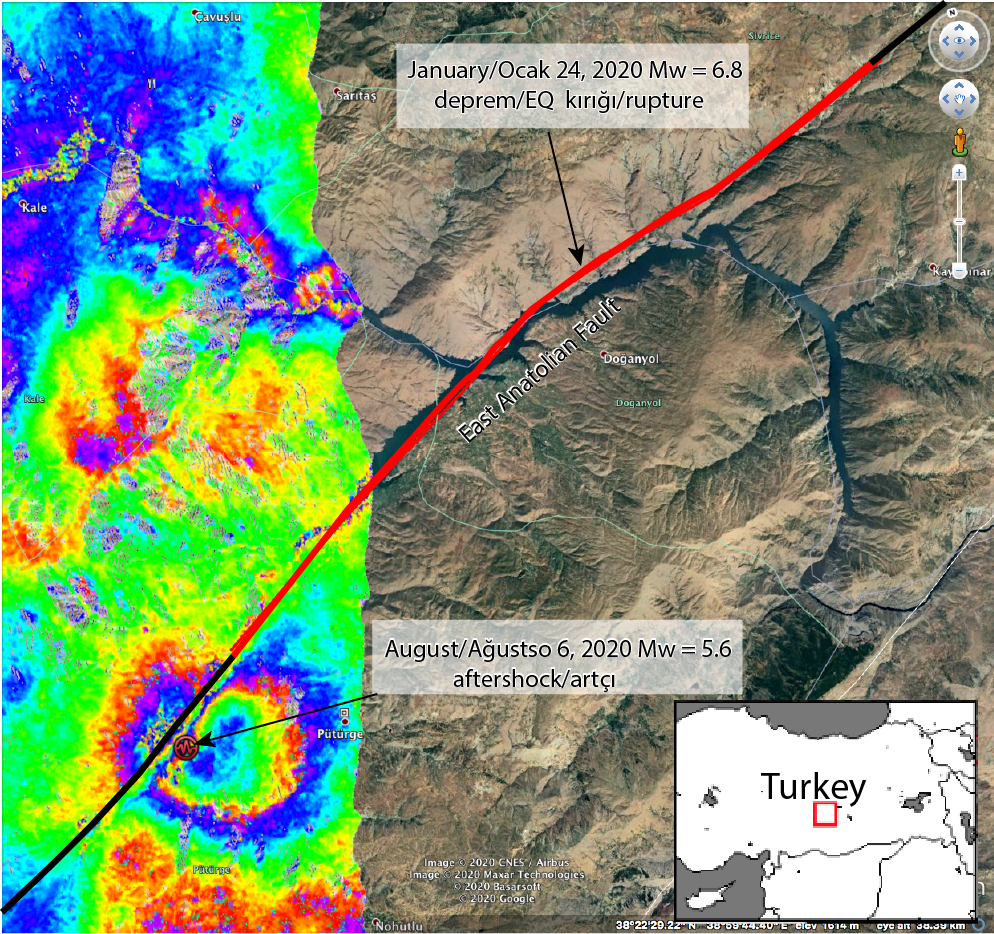
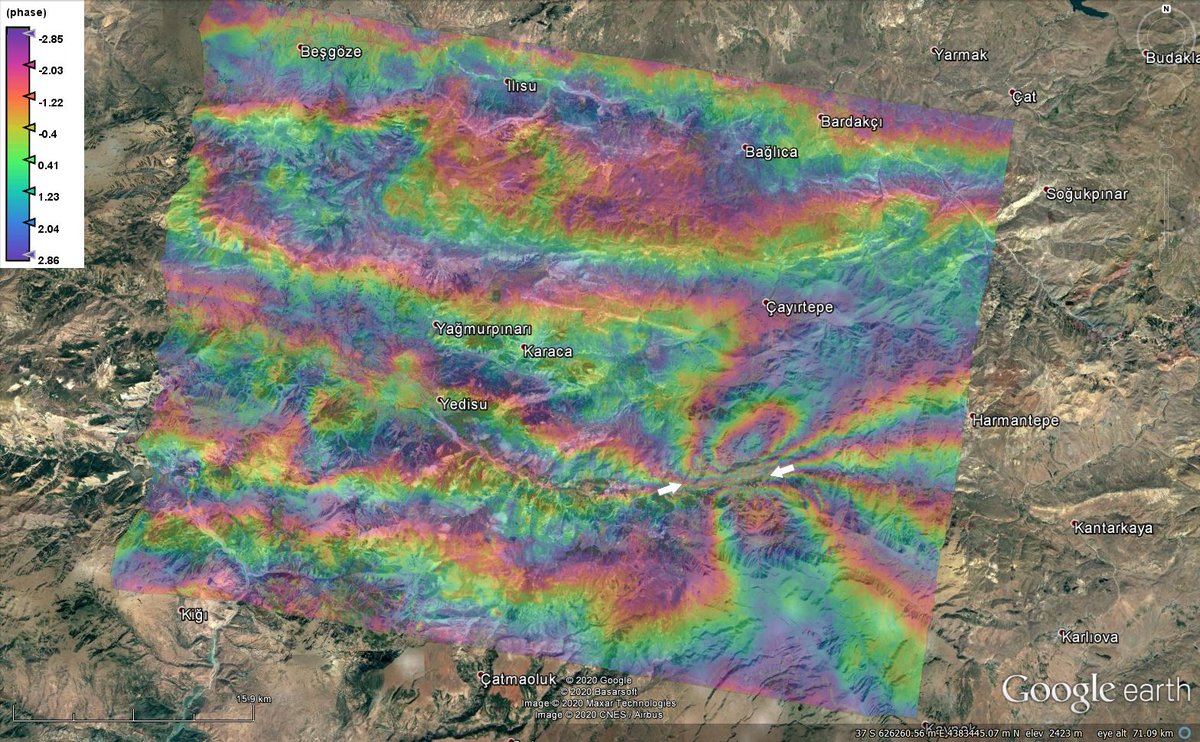
@Sadra_Krmz @MahdiMotagh @EricFielding @SARscience @jeodezist See above! (This is the first #interferogram to see #surface #deformation for the #earthquake in #Elazig.

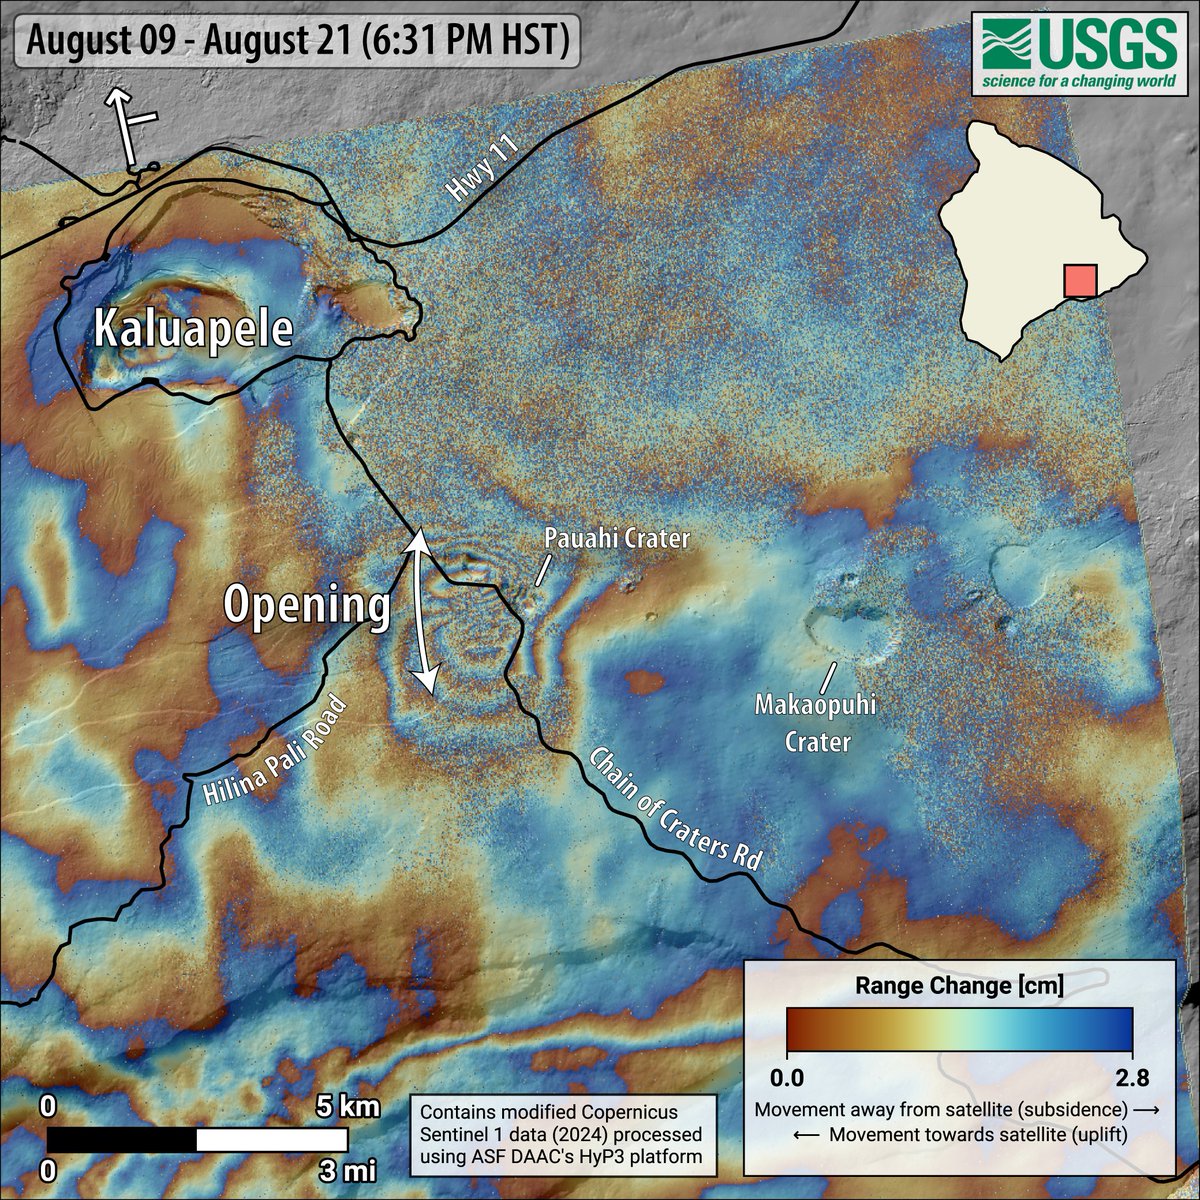
New #interferogram for #Kīlauea shows deformation during Aug 9-21, 2024, indicating an intrusion near Pauahi Crater (upper East Rift Zone). The intrusion occurred during the night of August 19-20, coincident with high rates of earthquake activity. ow.ly/6WPg50T4t29
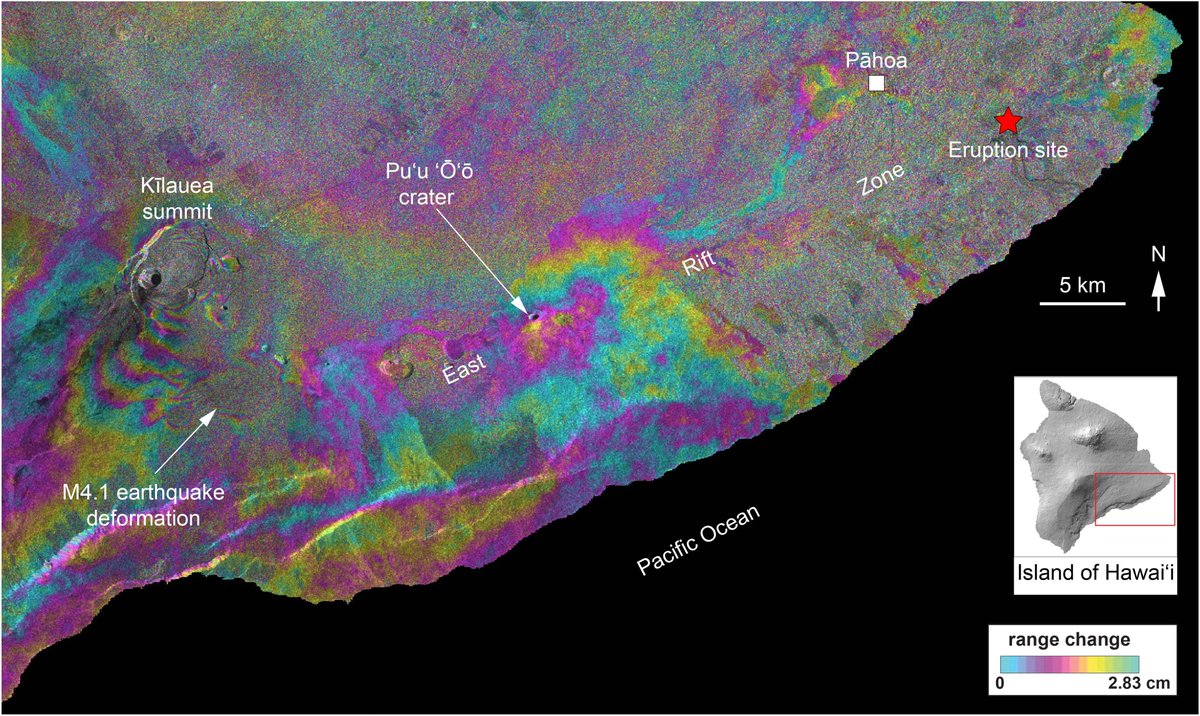
@esa #Sentinel-1 #interferogram shows #deformation of #Kilauea #Volcano: summit contraction due to magma withdrawal and instability; no deformation in middle and lower East Rift Zone; deformation in Koa`e fault zone due to Monday's M4.1 earthquake.

LiCSAR InSAR data user? Please complete our short survey to share your experience #Sentinel1 #interferogram #deformation #timeseries @NERC_COMET comet.nerc.ac.uk/comet-lics-por…
comet.nerc.ac.uk
Feedback - COMET
COMET-LiCS Sentinel-1 InSAR portal Home Product details Velocities Earthquakes Volcanoes Subsidence Give user feedback Loading… Contact Us COMET School of Earth and Environment The University of...
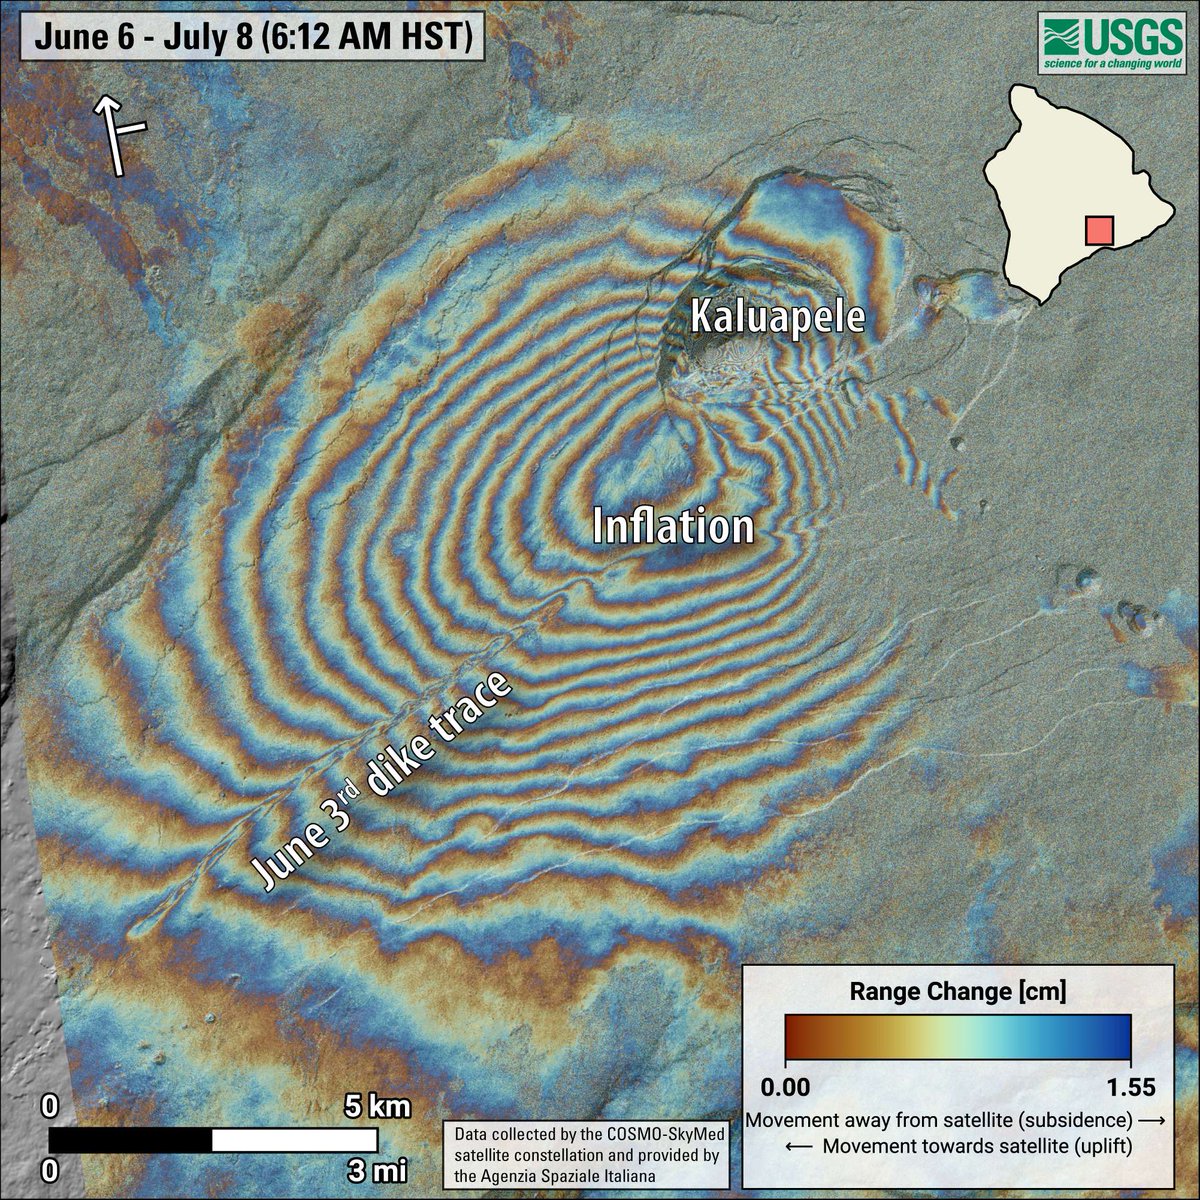
New @ASI_spazio #interferogram of #Kīlauea summit showing ground deformation that occurred during June 6-July 8. Fringes indicate >25 cm (10 in) of uplift focused in the south caldera over that time span. Ground above June 3 dike continues experience small adjustments.

Quick processing of @ESA_EO Sentinel-1 interferogram showing displacement phase between 2023-01-29 and 2023-01-10 of the Turkey Earthquake. Scary stuff! 😳 #TurkeySyriaEarthquake #Sentinel1 #interferogram #sar

Some beautiful InSAR #interferogram maps showing the surface deformation during the #Holuraun eruption. #Bardabunga subsiding and the dyke propagation effects leading up the eruption. Taken from Dumont et al. (2018) doi.org/10.3389/feart.…

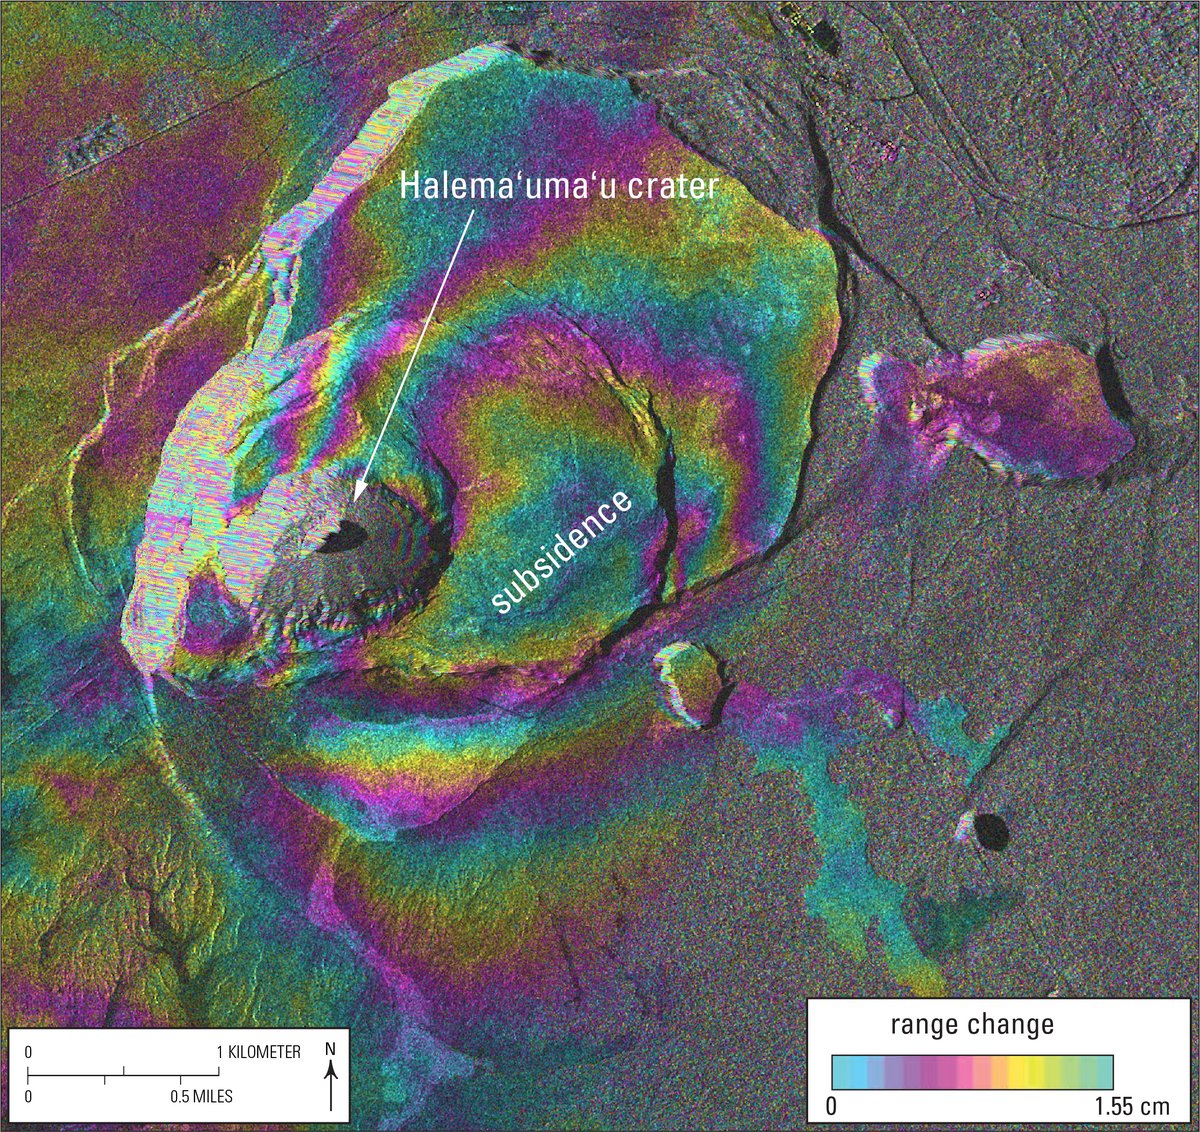
Satellite radar #interferogram from @ASI_spazio COSMO-SkyMed spanning Dec 6-21 (6 pm HST). Shows ~4.5 cm deflation due to magma withdrawal from a shallow storage area. More intense deformation is near eruptive fissures in Halemaʻumaʻu crater, but cannot be resolved. #Kilauea2020

Ever wonder how to read the colored fringes in an #interferogram? Here is your chance!! #geodesy #InSAR
#Satellites high above Earth provide data that helps scientists understand what's happening beneath the ground's surface. How? Read this week's #HVO #VolcanoWatch to find out! Reading the rainbow: How to interpret an #interferogram ow.ly/bAmo50uJmxx #InSAR #volcanoes


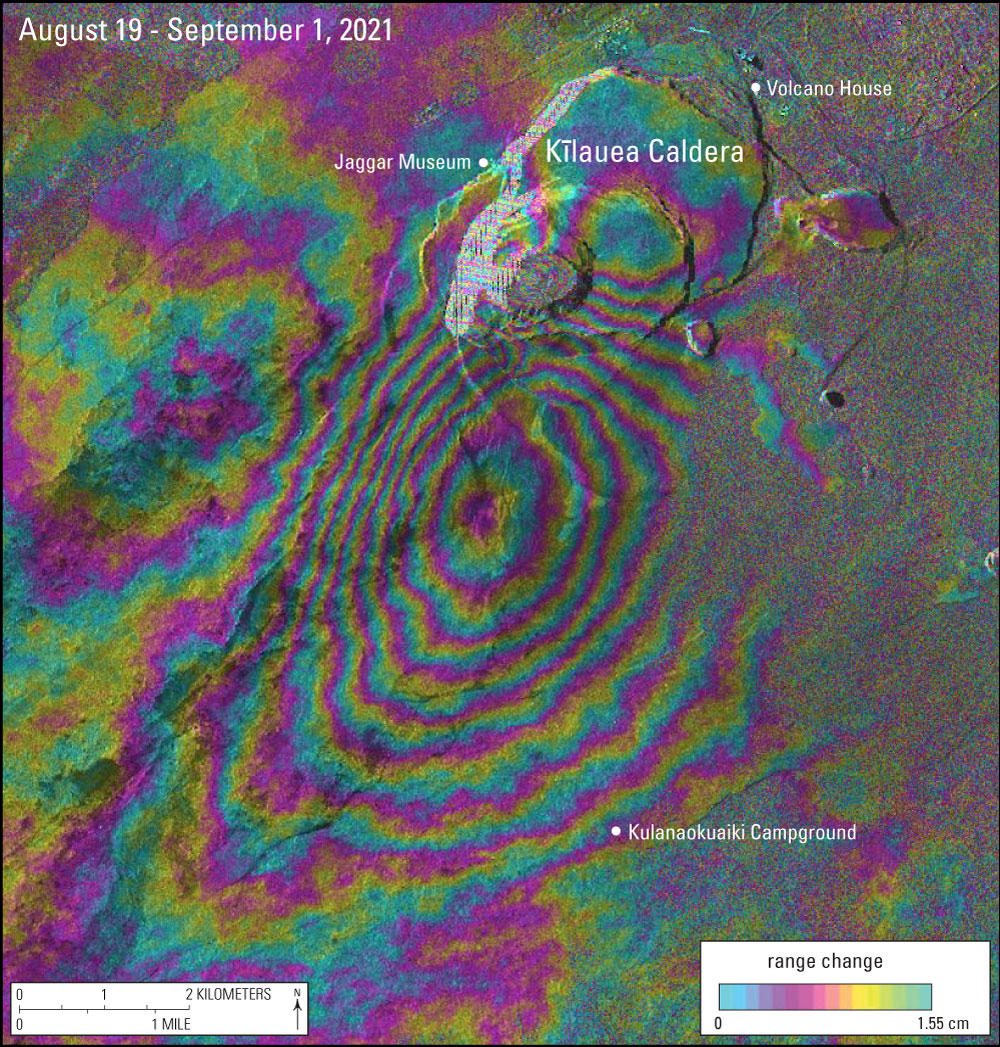
Reading the rainbow: recent magmatic intrusion into #Kilauea’s south caldera region generated ~7 in (18 cm) of uplift. Surface change calculated from differences observed in 2 #satellite passes (#interferogram) + modeling. Deformation has since leveled off ow.ly/SbfV50G3ezP
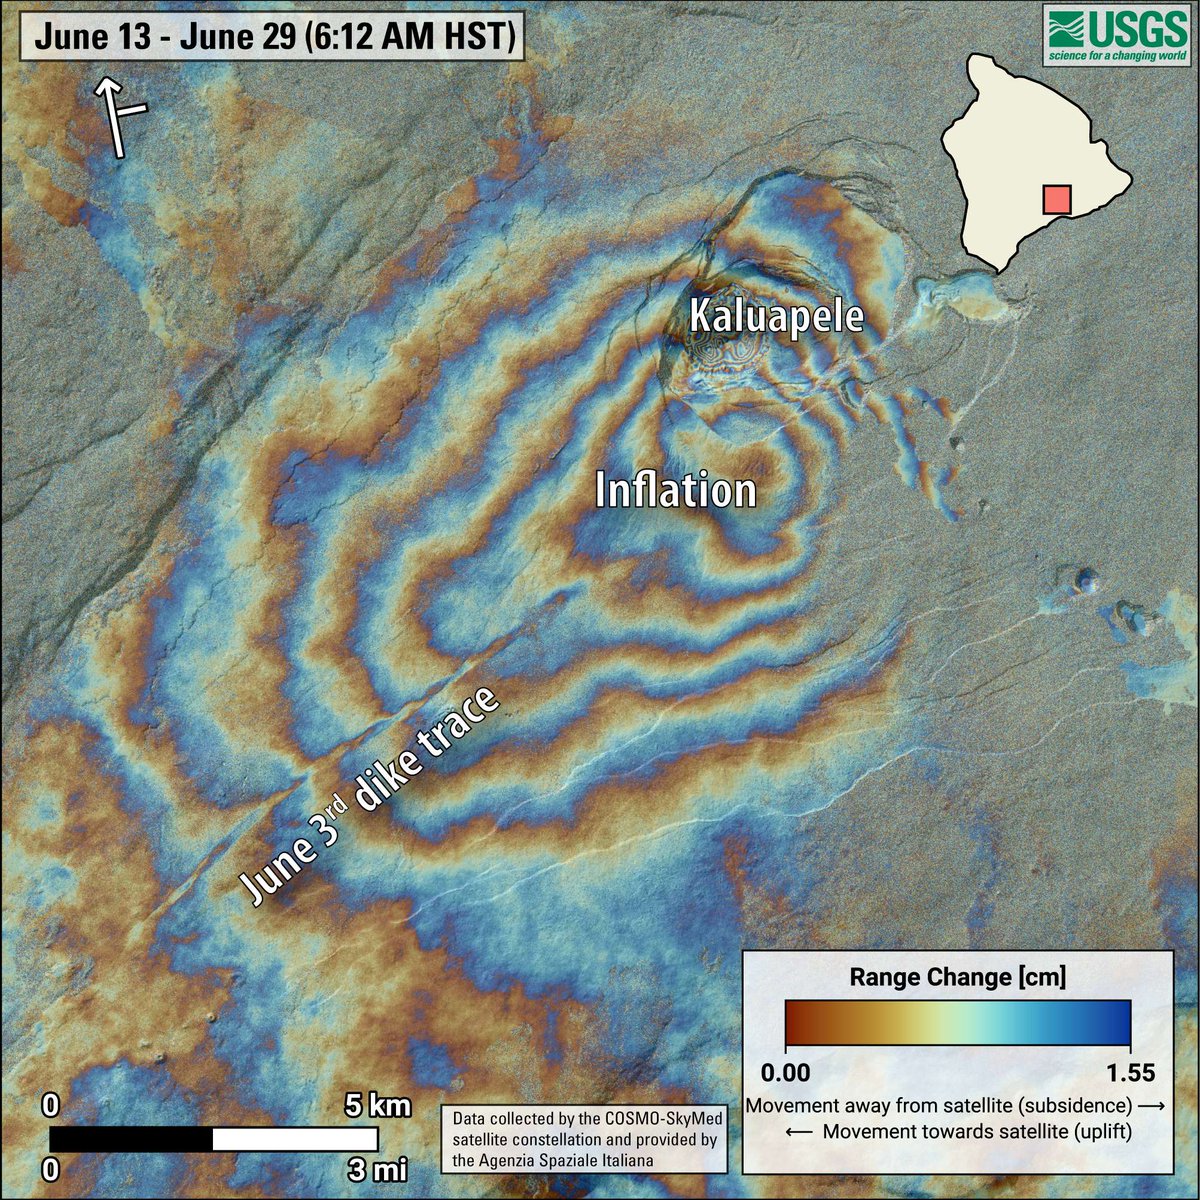
Latest @ASI_spazio COSMO-SkyMed #interferogram of #Kīlauea, spanning June 13-29. During that time, fringe patterns indicate ~10 cm of inflation centered in the south caldera and upper SWRZ. The trace of the June 3 dike intrusion is visible as a lineation of disrupted fringes.
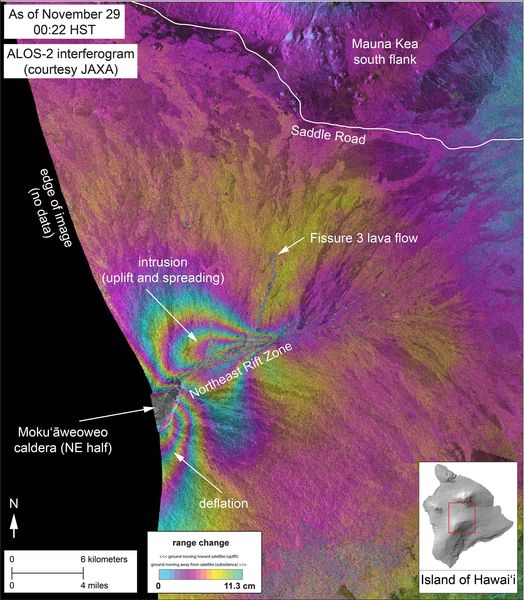
#Radar #interferogram showing deformation of Mauna Loa through Nov. 29 at 00:22 HST. Article on how to interpret this image is at ow.ly/a9wv50LROXU. Thanks to @JAXA_en for providing the imagery and to @Ak_Satellite for hosting the data!


Cosmo-SkyMed (from @ASI_spazio) #interferogram showing ~25 cm (~10 in) line-of-sight deflation of #Kilauea's summit during May 8-11 (6 PM local). Fringes around Puu Oo are topographic errors and on south flank of volcano are probably atmospheric artifacts.

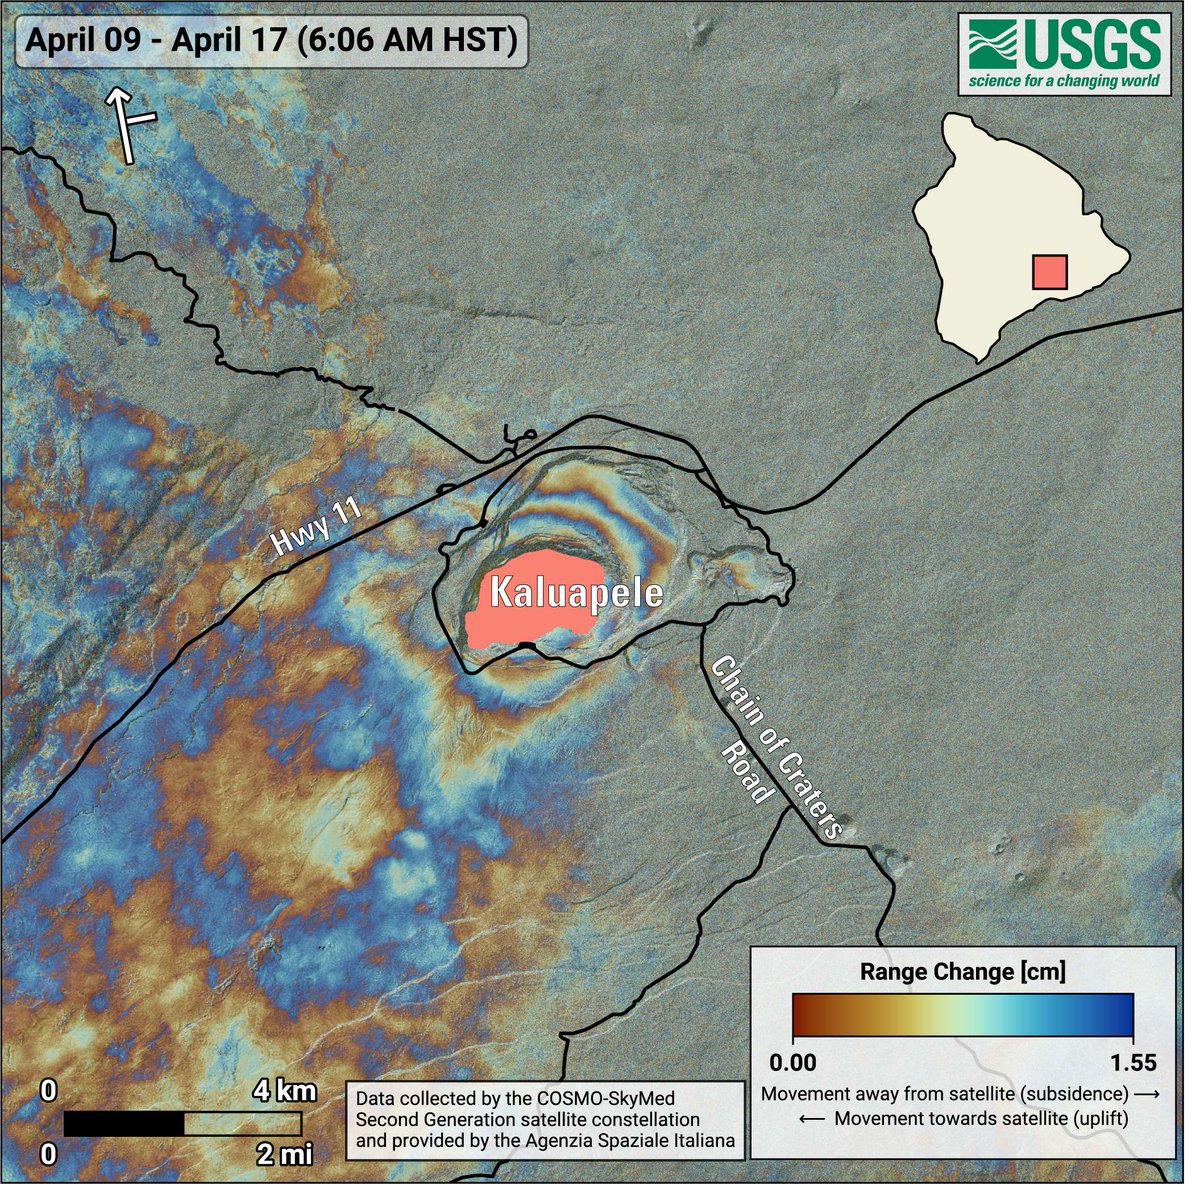
New #radar #interferogram from @ASI_spazio COSMO-SkyMed data showinga few centimeters of inflation at Kīlauea summit during April 9–17, 2025 (between episodes 17 and 18) due to magma accumulation about 1 mile beneath the surface. Details at ow.ly/SZWn50VEesH

Retweeted earthstartsbeating (@earthstartsbeat): Sentinel-1 #interferogram showing the ground deformation observed after the eruption and earthquakes occurred in the last days over #Hawaii. The narrow fringes show... facebook.com/Cieminfo/posts…

👉👉 Evaluating the Impact of #Interferogram #Networks on the #Performance of Phase Linking #Methods ✍️ Saeed Haji Safari and Yasser Maghsoudi 🔗 brnw.ch/21wXwnL

New #radar #interferogram from @ASI_spazio COSMO-SkyMed data showinga few centimeters of inflation at Kīlauea summit during April 9–17, 2025 (between episodes 17 and 18) due to magma accumulation about 1 mile beneath the surface. Details at ow.ly/SZWn50VEesH

USGS Volcanoes - We have another #interferogram to share, this one showing deformation over about the past month (June 6 - July 8) at the summit of #Kīlauea. The data are from images.app.goo.gl/VDpD5RT6iyd28h…
#Interferogram spanning December 17-29, 2024, shows deformation associated with current #Kilauea eruption. Data indicate a dike (vertical sheet of magma), probably emanating from the shallow (1 mile [1.6 km]) Halemaʻumaʻu magma reservoir. ow.ly/SZgC50UyabT @volcanoes_nps
![USGSVolcanoes's tweet image. #Interferogram spanning December 17-29, 2024, shows deformation associated with current #Kilauea eruption. Data indicate a dike (vertical sheet of magma), probably emanating from the shallow (1 mile [1.6 km]) Halemaʻumaʻu magma reservoir.
ow.ly/SZgC50UyabT
@volcanoes_nps](https://pbs.twimg.com/media/GgFXXPdWoAAFN9-.jpg)
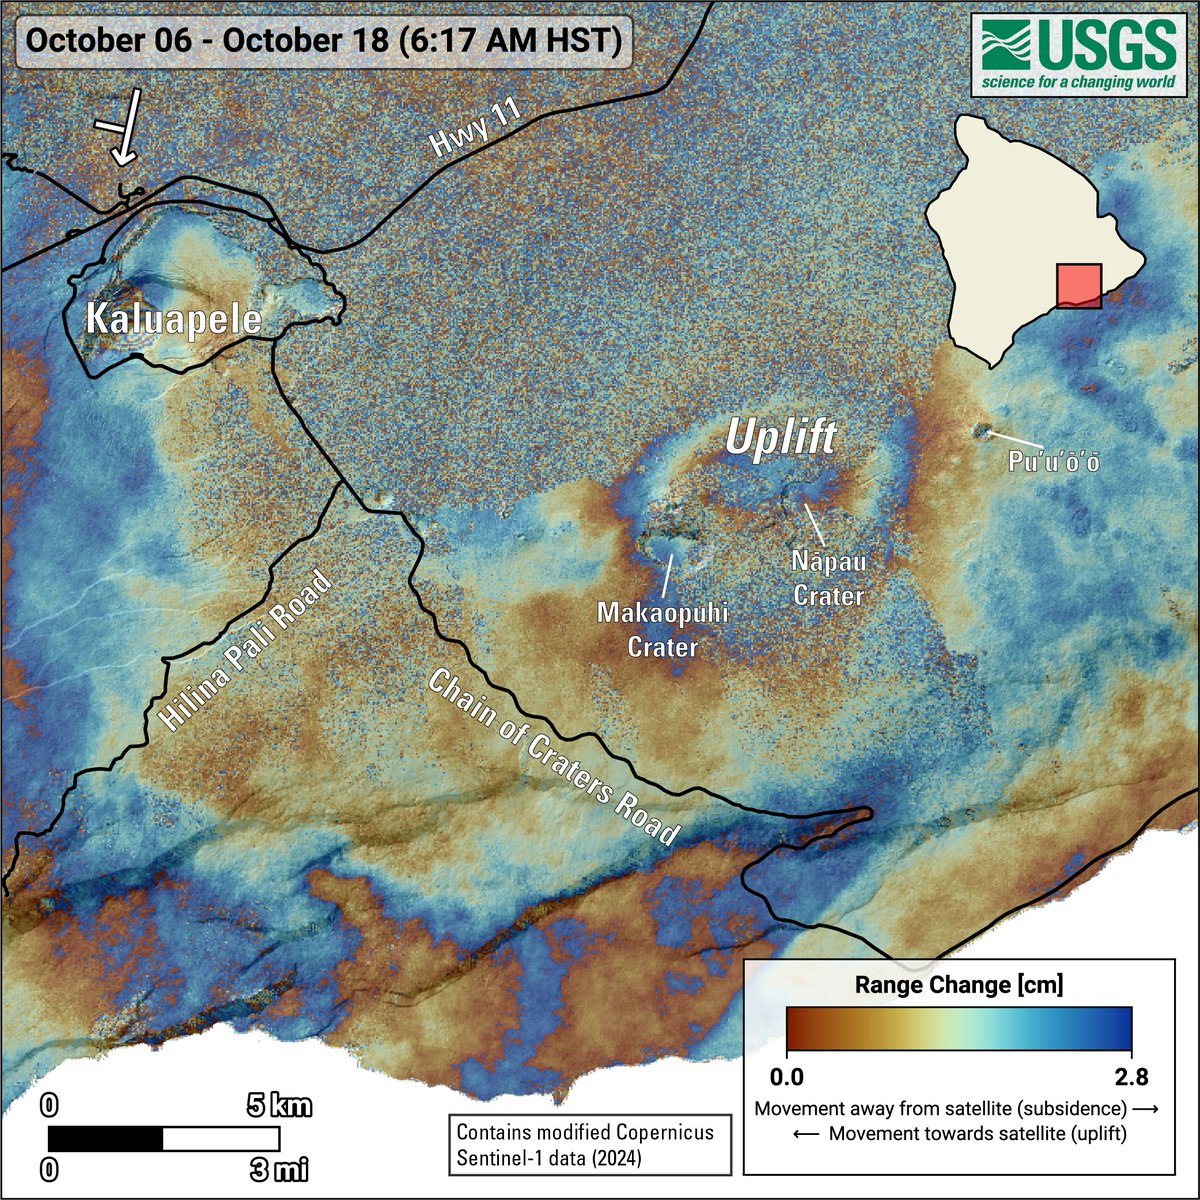
A new #interferogram shows that magma is continuing to accumulate underground near the recent September 15–20, 2024, middle East Rift Zone eruption site on #Kīlauea. Check it out here: usgs.gov/media/images/o…
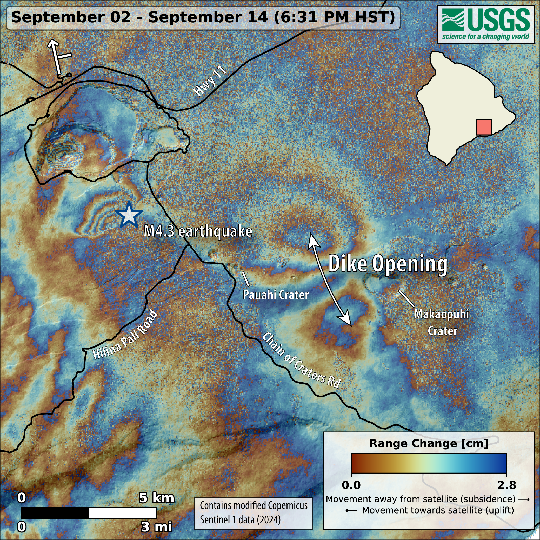
#ESA #Sentinel-1A #interferogram of #Kīlauea showing ground deformation during Sep. 2-14. Signals include dike intrusion between Pauahi and Makaopuhi Craters and rupture of a caldera-bounding fault associated with the M4.3 EQ on September 14. More at ow.ly/OLGr50TnNrK
New #interferogram for #Kīlauea shows deformation during Aug 9-21, 2024, indicating an intrusion near Pauahi Crater (upper East Rift Zone). The intrusion occurred during the night of August 19-20, coincident with high rates of earthquake activity. ow.ly/6WPg50T4t29
New @ASI_spazio #interferogram of #Kīlauea summit showing ground deformation that occurred during June 6-July 8. Fringes indicate >25 cm (10 in) of uplift focused in the south caldera over that time span. Ground above June 3 dike continues experience small adjustments.
Latest @ASI_spazio COSMO-SkyMed #interferogram of #Kīlauea, spanning June 13-29. During that time, fringe patterns indicate ~10 cm of inflation centered in the south caldera and upper SWRZ. The trace of the June 3 dike intrusion is visible as a lineation of disrupted fringes.

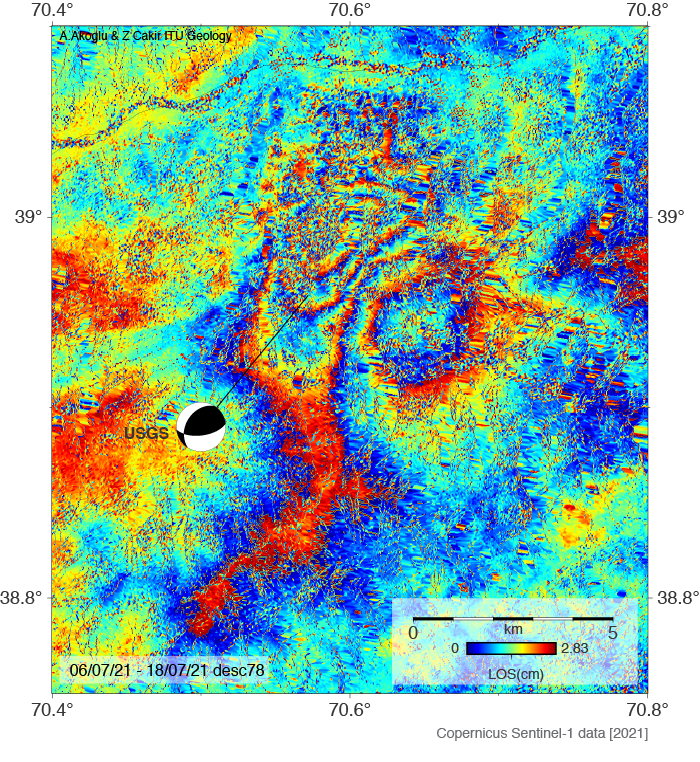
#Interferogram using jaxa's #ALOS2 level1.1 data on descending track acquired before [2022-06-10] and after [2023-10-13] the series of #earthquake; shows ground deformation observed in #Herat province, Afghanistan. Read more: aje.io/9ox0hs #INSAR 1/
![hillsonghimire's tweet image. #Interferogram using jaxa's #ALOS2 level1.1 data on descending track acquired before [2022-06-10] and after [2023-10-13] the series of #earthquake; shows ground deformation observed in #Herat province, Afghanistan.
Read more: aje.io/9ox0hs #INSAR 1/](https://pbs.twimg.com/media/F8fPzL1bMAAzrG_.jpg)
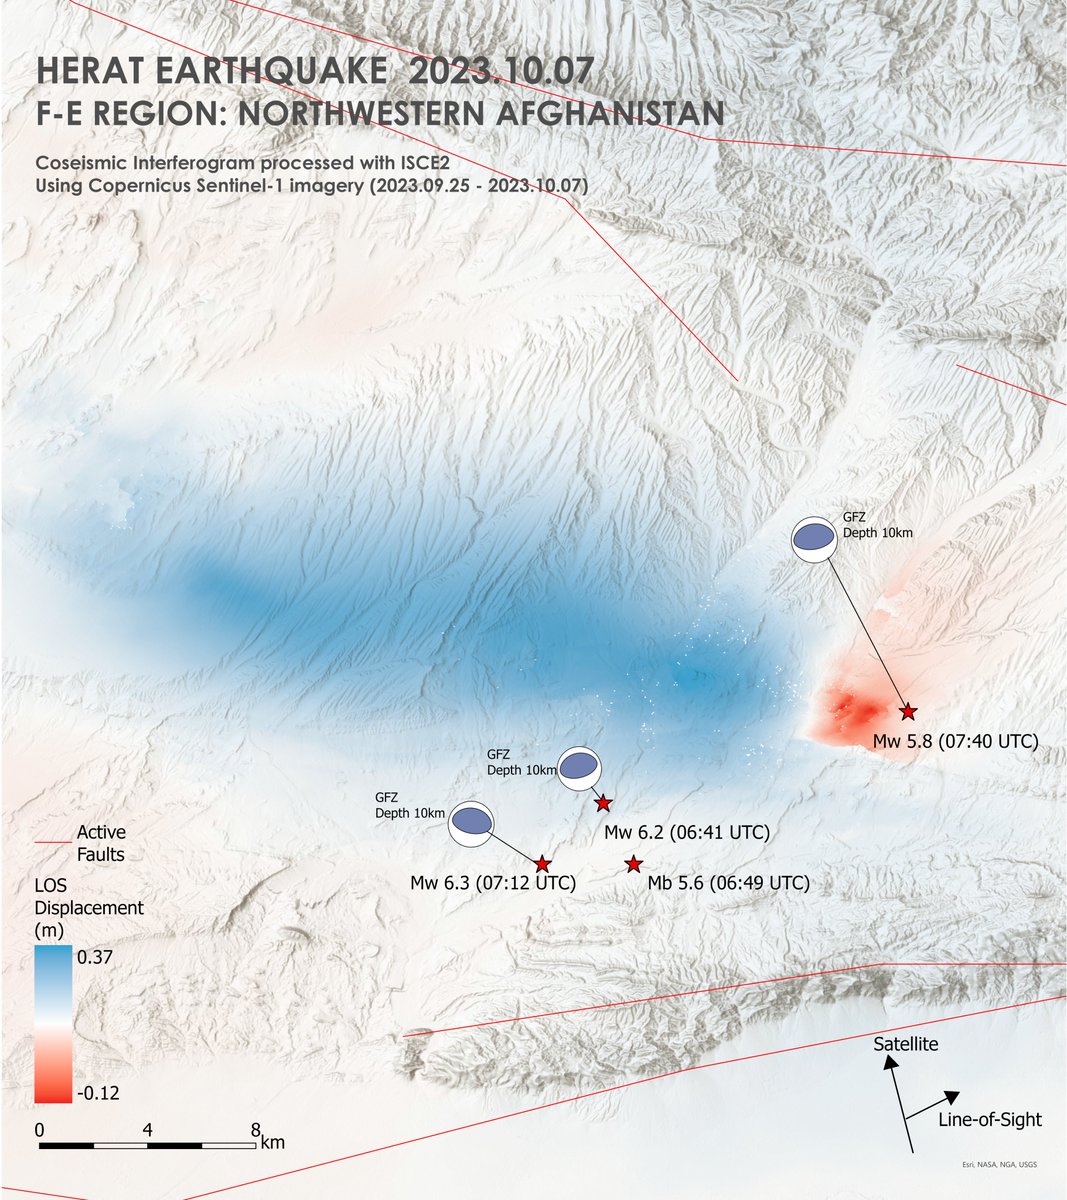
Herat Earthquake, Afghanistan: Examining the impact using #InSAR technique using the ground motion along the satellite's line-of-sight (LOS). The map product is derived using #sentinel1 on ascending pass captured on Sept 25 and Oct 07, 2023. #ESA #Earthquake #EOChat @CopernicusEU

Latest radar interferogram from the Mauna Loa eruption by @USGSVolcanoes (doesn’t make the use of rainbows any better, but at least they explain how to read them here usgs.gov/news/volcano-w…) #MaunaLoa #radar #interferogram #hawaii #volcano #eruption @Volcanoes_NPS #remotesensing


groovy image #MaunaLoa🌋 #interferogram
New #radar #interferogram of #MaunaLoa eruption shows deformation thought Dec. 2 at 6:13 AM HST. Deflation of overall volcano by ~50 cm (20 in) with uplift/spreading along summit caldera axis and NE Rift Zone. Thanks to @ASI_spazio for access to COSMO-Skymed data!
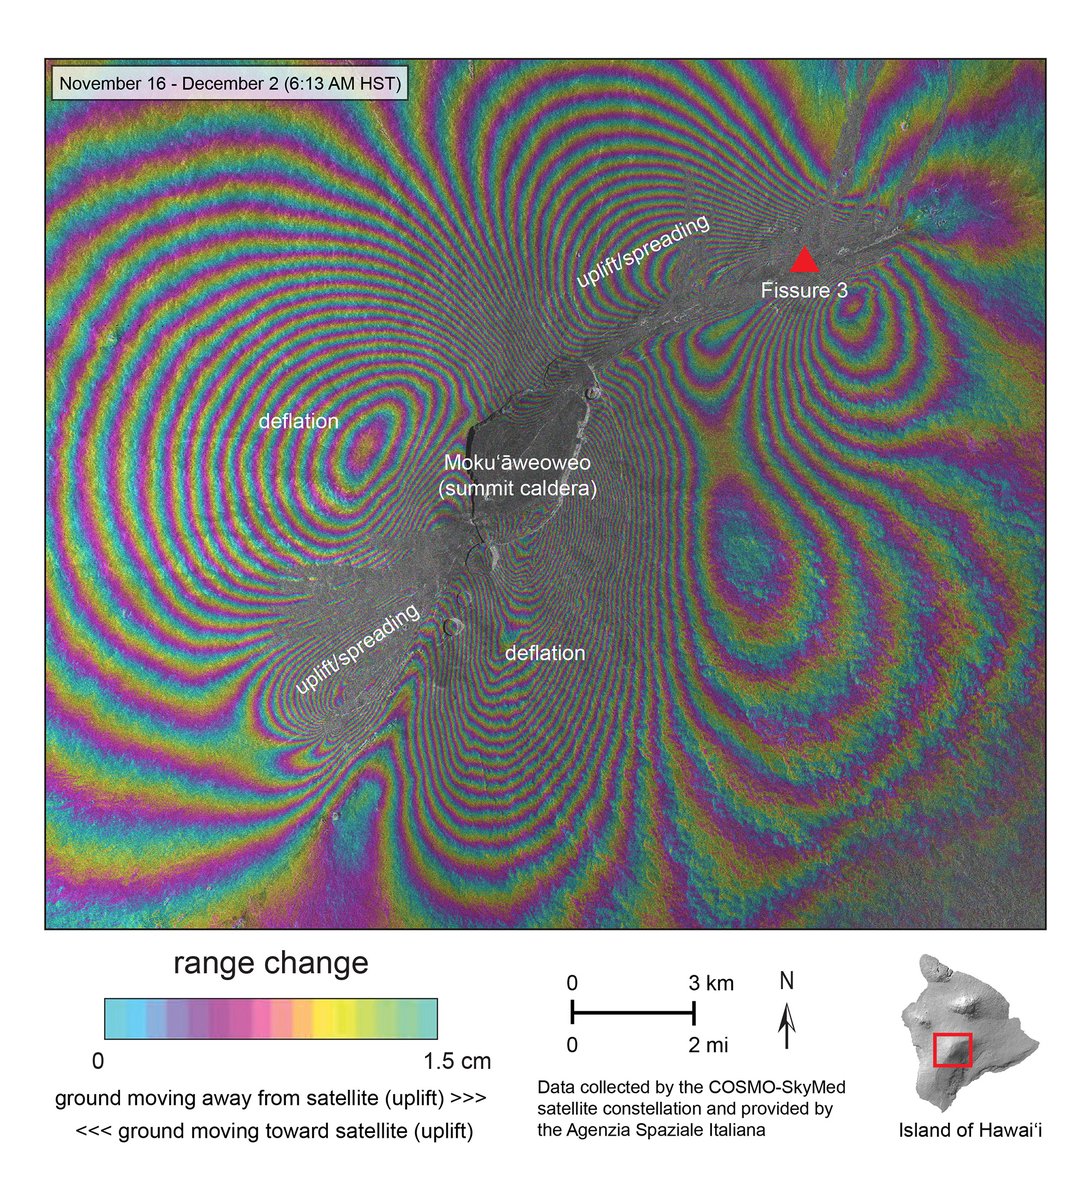
New #radar #interferogram of #MaunaLoa eruption shows deformation thought Dec. 2 at 6:13 AM HST. Deflation of overall volcano by ~50 cm (20 in) with uplift/spreading along summit caldera axis and NE Rift Zone. Thanks to @ASI_spazio for access to COSMO-Skymed data!

From USGS: The first space-based view of deformation associated with the Mauna Loa eruption! This #radar #interferogram shows ground motion that occurred during the opening phases of the eruption (through November 29 at 00:22 HST). bit.ly/3AZp0j9
#Radar #interferogram showing deformation of Mauna Loa through Nov. 29 at 00:22 HST. Article on how to interpret this image is at ow.ly/a9wv50LROXU. Thanks to @JAXA_en for providing the imagery and to @Ak_Satellite for hosting the data!

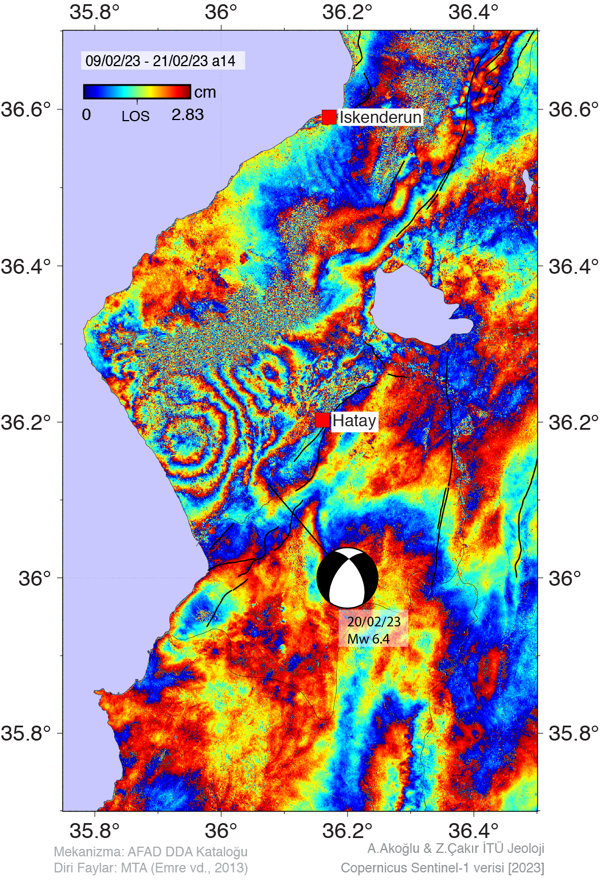
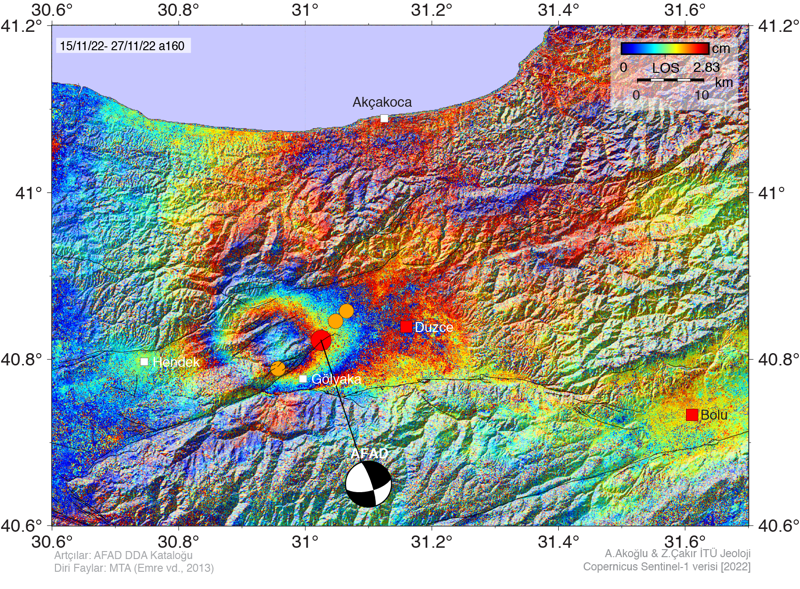
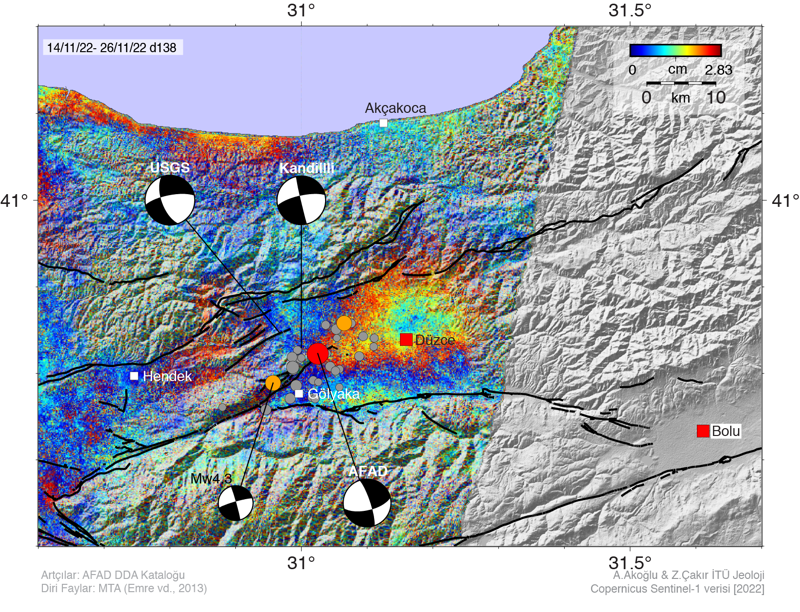
The M6.1 #earthquake occurred in Western Turkey on November 23, 2022, was mapped by the #geObservatory service of the @beyond_center. The co-seismic #interferogram,generated from Sentinel-1 SLC images corresponds to #ground #deformation equal to 2.8 cm.

23 Kasım 2022 Düzce depremine ait ikinci #interferogram (kmz birazdan atag.itu.edu.tr/v4/?p=1062 adresinde)


@esa #Sentinel-1 #interferogram shows #deformation of #Kilauea #Volcano: summit contraction due to magma withdrawal and instability; no deformation in middle and lower East Rift Zone; deformation in Koa`e fault zone due to Monday's M4.1 earthquake.
New @ASI_spazio #interferogram of #Kīlauea summit showing ground deformation that occurred during June 6-July 8. Fringes indicate >25 cm (10 in) of uplift focused in the south caldera over that time span. Ground above June 3 dike continues experience small adjustments.
New #interferogram for #Kīlauea shows deformation during Aug 9-21, 2024, indicating an intrusion near Pauahi Crater (upper East Rift Zone). The intrusion occurred during the night of August 19-20, coincident with high rates of earthquake activity. ow.ly/6WPg50T4t29
#LaPalmaEruption 🌋 Signal of soil deformation in the fissure eruption of #CumbreVieja Using data from the #Interferogram of the #Sentinel1 of @pabloj_gonzalez from September 14 and 20 and the data of @CopernicusEMS of the affected area (red), it results in this map #EMSR546
New #radar #interferogram from @ASI_spazio COSMO-SkyMed data showinga few centimeters of inflation at Kīlauea summit during April 9–17, 2025 (between episodes 17 and 18) due to magma accumulation about 1 mile beneath the surface. Details at ow.ly/SZWn50VEesH

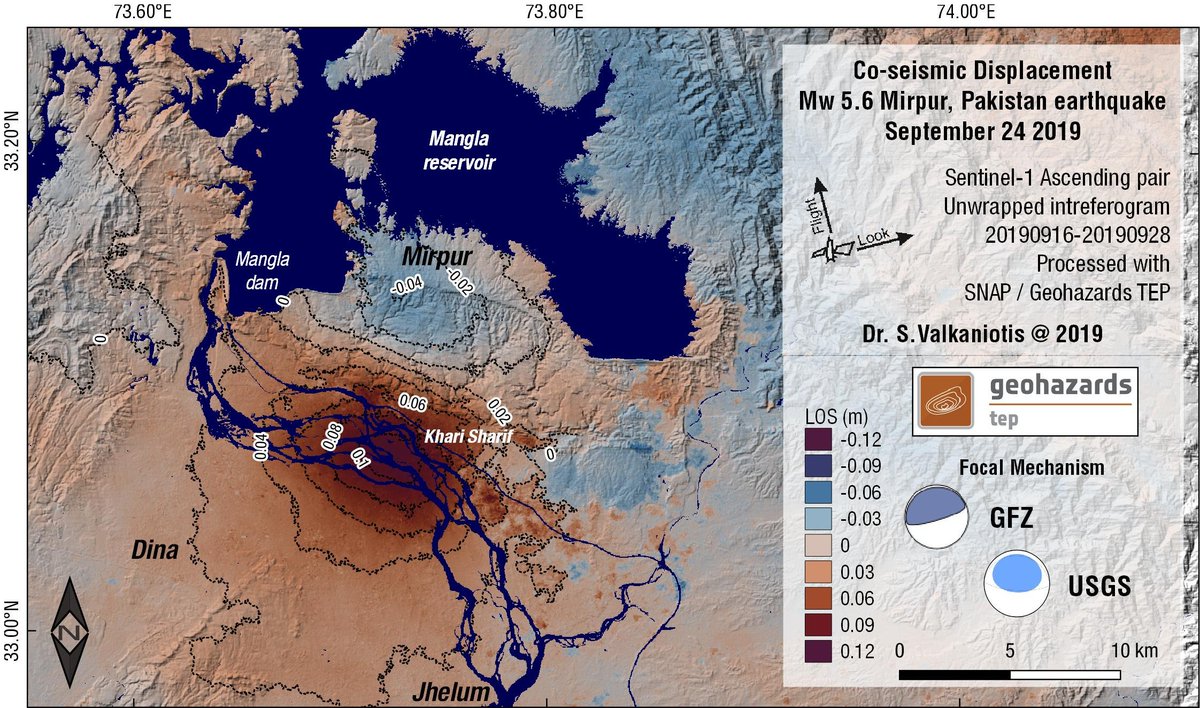
And the unwrapped #interferogram from the Sep 24 Mw 5.6 Kashmir, Pakistan #earthquake; surface displacement relative to satellite track (LOS Line-of-sight). Displacement is consistent with WNW-ESE thrust fault dipping towards south. Processed w/ SNAP at @esa_gep #InSAR #Sentinel1
From USGS: The first space-based view of deformation associated with the Mauna Loa eruption! This #radar #interferogram shows ground motion that occurred during the opening phases of the eruption (through November 29 at 00:22 HST). bit.ly/3AZp0j9
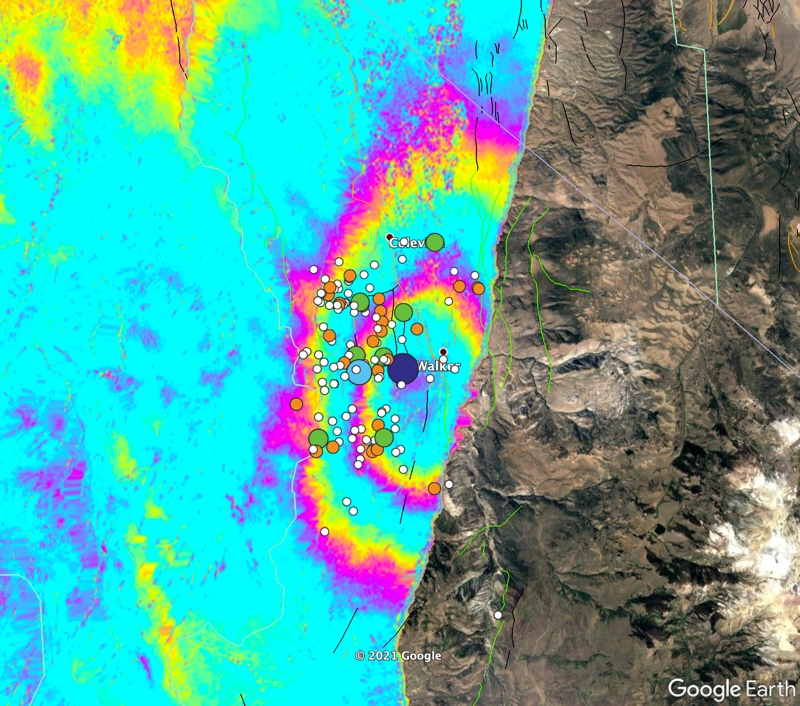
12 Haziran'da Van'da meydana gelen 5 büyüklüğündeki depreme ait #interferogram. Önümüzdeki ATAG çalıştayında daha fazla tartışabilmek ümidiyle.

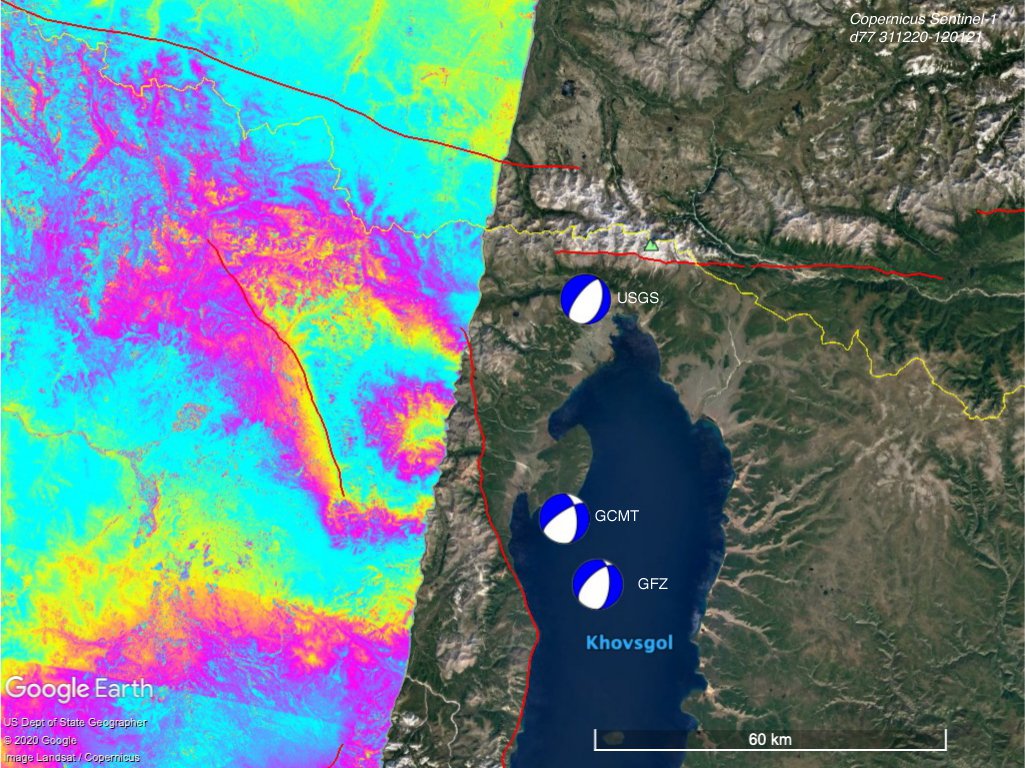
11 Ocak 2021'de Moğolistan Hövsgöl'de meydana gelen Mw 6.7'lik depreme ait ilk #interferogram. (@Peri_Physeos)

14 Haziran Karlıova-Bingöl depremine ait bu sabah ki 2. Sentinel-1 uçuşundan elde edilen #interferogram (A.Akoğlu, @ziyadin)


Bir küçük ek de böyle yapalım... 03.06.2020-15.06.2020(03:17) #Sentinel1 #interferogram ML:5.8(Kandilli)

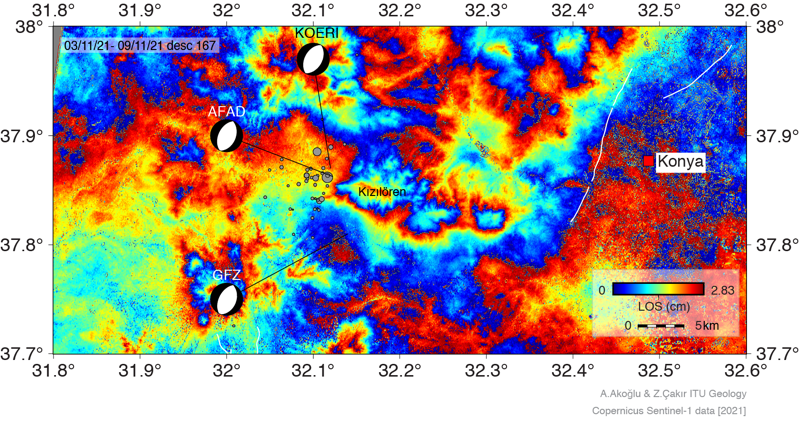
Dün gece #Konya'da meydana gelen depreme ait ilk #interferogram #deprem hakkında yeterli bilgi içermemekte.

Woo! Just successfully processed my first #TSX #interferogram! Just look at those pretty colors. Thanks @VolcanoInSAR for teaching me how to do the processing!

Something went wrong.
Something went wrong.
United States Trends
- 1. Good Wednesday N/A
- 2. Hump Day N/A
- 3. #DaredevilBornAgain N/A
- 4. Fisk N/A
- 5. Indiana N/A
- 6. Reaves N/A
- 7. Vivek N/A
- 8. Luka N/A
- 9. Meek N/A
- 10. Shai N/A
- 11. Bianco N/A
- 12. Bo Jackson N/A
- 13. SSRIs N/A
- 14. Kingpin N/A
- 15. All 10 N/A
- 16. Matt Murdock N/A
- 17. Dottore N/A
- 18. Bullseye N/A
- 19. Becerra N/A
- 20. Katie Porter N/A