#labplot 搜尋結果

We completed our @NGIZero Core funded project! 👉labplot.org/2025/10/04/an-… Coming soon to #LabPlot: Python scripting, live data analysis, and a suite of 13 statistical hypothesis tests like t-Tests, ANOVA or Chi-Square. #OpenSource #Statistics #Python #NGIZero #DataAnalysis

#LabPlot is now also fully available in Ukrainian and French! Thank you ❤️🙂 The following translations still need some work... 😉

2\ Visualization and Analysis of #LiveData from #MQTT in #LabPlot: (the blue line) with a simple function analysis curve (the orange line: x + 0.1). #DataViz #DataAnalysis #Robotics #Engineering #FreeSoftware #OpenSource #Arduino #IoT #HomeAssistant #RaspberryPi #Automation
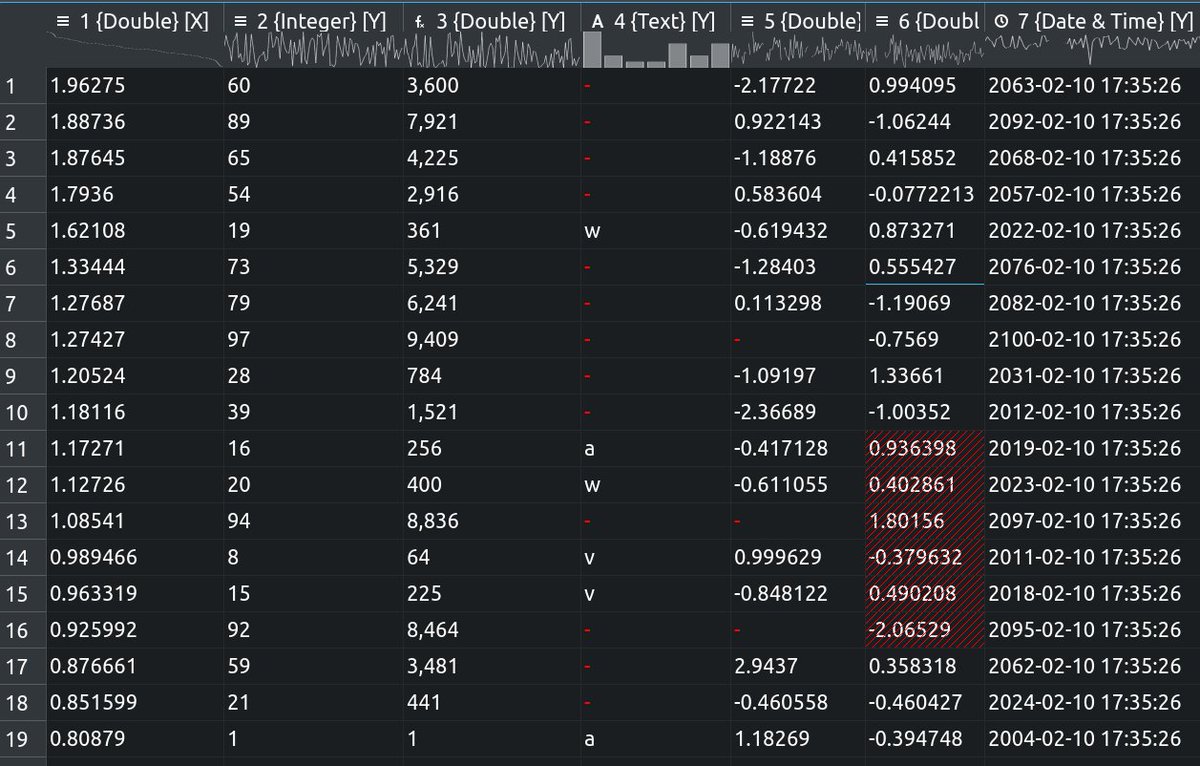
You can also display #sparklines in the header of a spreadsheet in #LabPlot, an open source and cross-platform data visualization and analysis software. #EdwardTufte
We've just written a blog post on the performance of (big) data import in #LabPlot. We import the data set with with 300 million of numerical values (6 cols x 50 million rows). All the values have been visualized in LabPlot. Check out the results! labplot.kde.org/2024/11/05/per… #Data


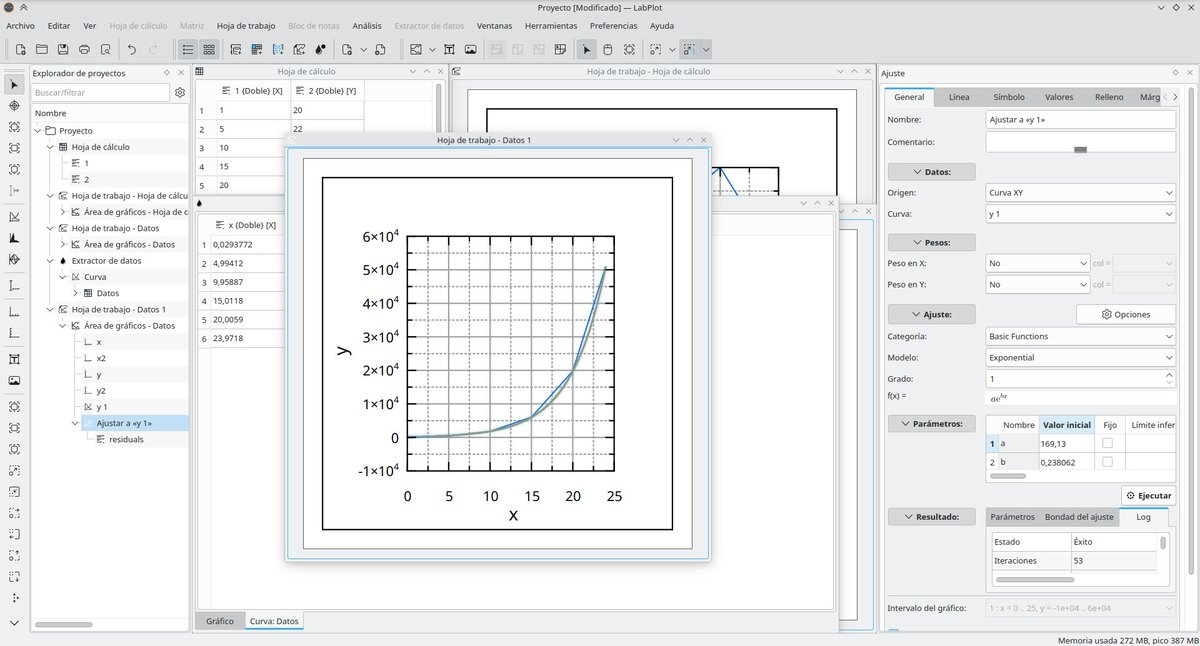
Me estoy desayunando de la potencia de este soft de la suite #KDE, #LabPlot. Es poco lo que he hecho hasta ahora pero parece muy interesante
#LabPlot, the project for #statisticians, #researchers, #scientists, #engineers, #educators and #students, publishes version 2.12 of its #FREE comprehensive #dataAnalysis and #visualization tool. labplot.org/2025/04/28/lab…


#LabPlot is currently fully available in British English, Catalan, Dutch, Galician, German, Polish, Slovenian, Spanish, Swedish and partially available in French, Italian, Ukrainian, Russian and other languages. #Translation #OpenSource #FreeSoftware #FOSS #KDE

Should the legend text color follow the plot (line, symbol etc.) color or have a uniform color? Which one do you prefer? #LabPlot (nightly) supports both cases. #DataAnalysis #DataVisualization #Color #Plot #Chart #EdwardTufte #Sparklines #OpenSource #FreeSoftware #FOSS #FLOSS

New #LabPlot Documentation 📚🚀 We have been working on transferring LabPlot's documentation to a new format. The manual still needs to be supplemented with new content, so we encourage everyone to contribute.🙂 Read more here: labplot.org/2024/12/20/new… #FreeSoftware #OpenSource

A new feature has been recently merged into the dev branch of #LabPlot - the new visualization: Run Chart. The comparison between a Process Behavior Chart (XMR) and a Run Chart: #DataAnalysis #Statistics #Quality #ControlChart #OpenSource #Business #FreeSoftware #Deming #Lean

Color Blind Awareness Day – 6th September! There are multiple color maps that are color-vision deficiency friendly and many of them are already available in #LabPlot. Read more: ➡️labplot.kde.org/2021/04/29/col… #Color #Vision #Visualization #Accessibility #FreeSoftware #OpenSource

We’re announcing the 2.12.1 minor patch release of #LabPlot with improvements and bug fixes. labplot.org/2025/08/18/lab… We recommend everybody update to this patch release which is available here: ➡️labplot.org/download #FOSS #OpenSource #Statistics #DataViz #DataAnalysis

Below is the result of a test conducted on LabPlot's homepage (labplot.org) using Blacklight, a real-time website #privacy inspector. ➡️ themarkup.org/blacklight?url… #LabPlot #DataPrivacy #InfoSec #FreeSoftware #OpenSource #FOSS


With all those quick tutorials, why don't more users get their feet wet? The richness of the design is inescapable. #LabPlot
Just in time to close out 2023. We now have 648 subscribers on X and 661 on Youtube. Thank you! 🙂 ❤️ Will you help us reach 650 subscribers on X and 675 on YT before 2024 comes in? 🙂 youtube.com/@LabPlot HAPPY NEW YEAR 2024! 🍾🎉 @kdecommunity #FOSS #FLOSS #OpenSource
Improving UX is as important as developing new features. When duplicating an object in the project explorer, it's now possible in #LabPlot [dev] to place the copy right below the original object. ➡️invent.kde.org/education/labp… #FreeSoftware #OpenSource #FOSS #DataAnalysis #KDE #UX
"#LabPlot es una solución de código abierto que ofrece una amplia gama de funcionalidades para la visualización de datos científicos y el análisis de datos." ➡️ puntocomunica.com/alternativas-a… #DataVisualization #DataAnalysis #OpenSource #Engineering #Science
Have you seen this short video on plotting real time data using #LabPlot? youtube.com/watch?v=bBI0yf… #RealTime #LiveData #SensorData #Sensors #DataVisualization #Plotting #Graphs #OpenSource #FreeSoftware #FOSS #Robotics #Engineering #Science #Research

youtube.com
YouTube
Live data
We completed our @NGIZero Core funded project! 👉labplot.org/2025/10/04/an-… Coming soon to #LabPlot: Python scripting, live data analysis, and a suite of 13 statistical hypothesis tests like t-Tests, ANOVA or Chi-Square. #OpenSource #Statistics #Python #NGIZero #DataAnalysis
#LabPlot, the project for #statisticians, #researchers, #scientists, #engineers, #educators and #students, publishes version 2.12 of its #FREE comprehensive #dataAnalysis and #visualization tool. labplot.org/2025/04/28/lab…
Below is the result of a test conducted on LabPlot's homepage (labplot.org) using Blacklight, a real-time website #privacy inspector. ➡️ themarkup.org/blacklight?url… #LabPlot #DataPrivacy #InfoSec #FreeSoftware #OpenSource #FOSS
We’re announcing the 2.12.1 minor patch release of #LabPlot with improvements and bug fixes. labplot.org/2025/08/18/lab… We recommend everybody update to this patch release which is available here: ➡️labplot.org/download #FOSS #OpenSource #Statistics #DataViz #DataAnalysis
Improving UX is as important as developing new features. When duplicating an object in the project explorer, it's now possible in #LabPlot [dev] to place the copy right below the original object. ➡️invent.kde.org/education/labp… #FreeSoftware #OpenSource #FOSS #DataAnalysis #KDE #UX
Me estoy desayunando de la potencia de este soft de la suite #KDE, #LabPlot. Es poco lo que he hecho hasta ahora pero parece muy interesante
New #LabPlot Documentation 📚🚀 We have been working on transferring LabPlot's documentation to a new format. The manual still needs to be supplemented with new content, so we encourage everyone to contribute.🙂 Read more here: labplot.org/2024/12/20/new… #FreeSoftware #OpenSource
We've just written a blog post on the performance of (big) data import in #LabPlot. We import the data set with with 300 million of numerical values (6 cols x 50 million rows). All the values have been visualized in LabPlot. Check out the results! labplot.kde.org/2024/11/05/per… #Data
Should the legend text color follow the plot (line, symbol etc.) color or have a uniform color? Which one do you prefer? #LabPlot (nightly) supports both cases. #DataAnalysis #DataVisualization #Color #Plot #Chart #EdwardTufte #Sparklines #OpenSource #FreeSoftware #FOSS #FLOSS
2\ Visualization and Analysis of #LiveData from #MQTT in #LabPlot: (the blue line) with a simple function analysis curve (the orange line: x + 0.1). #DataViz #DataAnalysis #Robotics #Engineering #FreeSoftware #OpenSource #Arduino #IoT #HomeAssistant #RaspberryPi #Automation
A new feature has been recently merged into the dev branch of #LabPlot - the new visualization: Run Chart. The comparison between a Process Behavior Chart (XMR) and a Run Chart: #DataAnalysis #Statistics #Quality #ControlChart #OpenSource #Business #FreeSoftware #Deming #Lean
"#LabPlot es una solución de código abierto que ofrece una amplia gama de funcionalidades para la visualización de datos científicos y el análisis de datos." ➡️ puntocomunica.com/alternativas-a… #DataVisualization #DataAnalysis #OpenSource #Engineering #Science
Color Blind Awareness Day – 6th September! There are multiple color maps that are color-vision deficiency friendly and many of them are already available in #LabPlot. Read more: ➡️labplot.kde.org/2021/04/29/col… #Color #Vision #Visualization #Accessibility #FreeSoftware #OpenSource
Have you seen this short video on plotting real time data using #LabPlot? youtube.com/watch?v=bBI0yf… #RealTime #LiveData #SensorData #Sensors #DataVisualization #Plotting #Graphs #OpenSource #FreeSoftware #FOSS #Robotics #Engineering #Science #Research
youtube.com
YouTube
Live data
Have you seen this video tutorial on how to extract plots, curves and data points from images using #LabPlot's Data Picker tool ? Data Picker has been available in LabPlot since the version 2.2, but we renamed it to Data Extractor. youtube.com/watch?v=D_Pz5a… #PlotDigitizer #Data

youtube.com
YouTube
Data Picker - Simplified Workflow in LabPlot 2.7
#LabPlot is now also fully available in Ukrainian and French! Thank you ❤️🙂 The following translations still need some work... 😉
#LabPlot is currently fully available in British English, Catalan, Dutch, Galician, German, Polish, Slovenian, Spanish, Swedish and partially available in French, Italian, Ukrainian, Russian and other languages. #Translation #OpenSource #FreeSoftware #FOSS #KDE
You can also display #sparklines in the header of a spreadsheet in #LabPlot, an open source and cross-platform data visualization and analysis software. #EdwardTufte
@EdwardTufte suggests two principles for making efficient plots: ▶️ Erase non-data-ink, within reason. ▶️ Erase redundant data-ink, within reason. In #LabPlot you can apply #Tufte's theme for plots with a single click via Theme > Tufte. #DataVisualization #DataAnalysis

We completed our @NGIZero Core funded project! 👉labplot.org/2025/10/04/an-… Coming soon to #LabPlot: Python scripting, live data analysis, and a suite of 13 statistical hypothesis tests like t-Tests, ANOVA or Chi-Square. #OpenSource #Statistics #Python #NGIZero #DataAnalysis
@EdwardTufte suggests two principles for making efficient plots: ▶️ Erase non-data-ink, within reason. ▶️ Erase redundant data-ink, within reason. In #LabPlot you can apply #Tufte's theme for plots with a single click via Theme > Tufte. #DataVisualization #DataAnalysis
#LabPlot is now also fully available in Ukrainian and French! Thank you ❤️🙂 The following translations still need some work... 😉
Me estoy desayunando de la potencia de este soft de la suite #KDE, #LabPlot. Es poco lo que he hecho hasta ahora pero parece muy interesante
You can also display #sparklines in the header of a spreadsheet in #LabPlot, an open source and cross-platform data visualization and analysis software. #EdwardTufte
#LabPlot, the project for #statisticians, #researchers, #scientists, #engineers, #educators and #students, publishes version 2.12 of its #FREE comprehensive #dataAnalysis and #visualization tool. labplot.org/2025/04/28/lab…
An open access article by W. Morales González and J. E. Hernández-Ruiz: Experiencias en el uso del software LabPlot en el procesamiento analítico y gráfico de datos experimentales ➡️ researchgate.net/publication/36… #LabPlot #Students #Physics #Chemistry #Science #DataAnalysis

New #LabPlot Documentation 📚🚀 We have been working on transferring LabPlot's documentation to a new format. The manual still needs to be supplemented with new content, so we encourage everyone to contribute.🙂 Read more here: labplot.org/2024/12/20/new… #FreeSoftware #OpenSource
We've just written a blog post on the performance of (big) data import in #LabPlot. We import the data set with with 300 million of numerical values (6 cols x 50 million rows). All the values have been visualized in LabPlot. Check out the results! labplot.kde.org/2024/11/05/per… #Data
Below is the result of a test conducted on LabPlot's homepage (labplot.org) using Blacklight, a real-time website #privacy inspector. ➡️ themarkup.org/blacklight?url… #LabPlot #DataPrivacy #InfoSec #FreeSoftware #OpenSource #FOSS
We’re announcing the 2.12.1 minor patch release of #LabPlot with improvements and bug fixes. labplot.org/2025/08/18/lab… We recommend everybody update to this patch release which is available here: ➡️labplot.org/download #FOSS #OpenSource #Statistics #DataViz #DataAnalysis
A new feature has been recently merged into the dev branch of #LabPlot - the new visualization: Run Chart. The comparison between a Process Behavior Chart (XMR) and a Run Chart: #DataAnalysis #Statistics #Quality #ControlChart #OpenSource #Business #FreeSoftware #Deming #Lean
Color Blind Awareness Day – 6th September! There are multiple color maps that are color-vision deficiency friendly and many of them are already available in #LabPlot. Read more: ➡️labplot.kde.org/2021/04/29/col… #Color #Vision #Visualization #Accessibility #FreeSoftware #OpenSource
#LabPlot is currently fully available in British English, Catalan, Dutch, Galician, German, Polish, Slovenian, Spanish, Swedish and partially available in French, Italian, Ukrainian, Russian and other languages. #Translation #OpenSource #FreeSoftware #FOSS #KDE
➡️ Olympic medals per 1k $GDP per capita - Paris 2024 - represented in the Tukey's boxplot 🏅 The highest number, relative to $GDP per capita, is best. Outliers marked as circles. Made in #LabPlot, an open-source data analysis and visualization software. #Olympics #USA #China

This page contains a list of external resources mentioning #LabPlot and its usage in various areas. ➡️ labplot.kde.org/references/ If you are aware of other resources that should be listed, please contact us! #Research #Physics #Medicine #Chemistry #Biology #Engineering #Robotics

Should the legend text color follow the plot (line, symbol etc.) color or have a uniform color? Which one do you prefer? #LabPlot (nightly) supports both cases. #DataAnalysis #DataVisualization #Color #Plot #Chart #EdwardTufte #Sparklines #OpenSource #FreeSoftware #FOSS #FLOSS
Something went wrong.
Something went wrong.
United States Trends
- 1. #NationalCatDay 3,727 posts
- 2. FOMC 45.8K posts
- 3. Azure 15K posts
- 4. Huda 27.6K posts
- 5. Hutch 1,464 posts
- 6. Jennifer Welch 10.7K posts
- 7. #SaveSudan 1,501 posts
- 8. The Federal Reserve 10.2K posts
- 9. NBA Street 2,399 posts
- 10. Powell 32.1K posts
- 11. #SpaceMarine2 1,933 posts
- 12. #Spooktacular25 N/A
- 13. Vistoso Bosses N/A
- 14. #SellingSunset N/A
- 15. Jay Z 10.1K posts
- 16. South Korea 168K posts
- 17. Jake Browning N/A
- 18. 25 BPS 7,010 posts
- 19. Olandria 44.9K posts
- 20. Mandy 17.9K posts