#linegraphs search results


I know in #appdesign everyone loves the curvy #linegraphs, but it doesn't always workout the way you think it should. Example: This screenshot from the Canadian Blood Services app. Look at the dip after Oct. 12. This didn't happen IRL but it shows up on the graph. Thoughts?


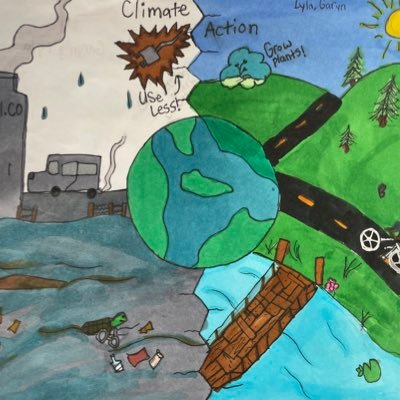
Collecting data from our traveling paper airplanes and graphing it @PleasantUnionYR #linegraphs #datatables


(Line Graphs Problems) - #LineGraphs, #QuantitativeAptitudeTutorials, #QuantitativeAptitude, #SPLessons


Read/interpret #LineGraphs. Working together 2 answer Q's that other students created 4 us. @orioleparkjps @tdsb


Teaching graphing through inquiry. I gave students paper strips. They were given 3 minutes to create the longest paper chain they could. The students then wanted to line them up at one starting point to compare them. #learninginlevel1 #linegraphs


Ss chose an area of interest to make line graphs to show data changing over time. Many students got real world data to plot and learn from, & they chose to show their work digitally or on graph paper. #math #LineGraphs #PersonalizedLearning @GroveAve220


Excellent maths lesson with Year 5 yesterday: #linegraphs. @ReadingFC reckon Ovie can cover 16km per game?


Introduction to Information Handling! Developing our skills in interpreting information 😊 #tables #bargraphs #linegraphs #comparison


How to Display: Line graphs connect data points that are related, great way to monitor the temperature! #linegraphs


The Grade 5/6’s used the new whiteboards with grids today to create #linegraphs! Thanks for the boards #dsbn! @merritt_ps


IELTS Writing Task 1 (Academic): If describing multiple line graphs, group related data. Don't just list numbers sequentially. Identify main trends and significant points for clarity. Get your multi-graph descriptions reviewed. Link in bio. #LineGraphs

It's Monday freebie time 🥳this time with a statistical twist. #primarymaths #teachersofmaths #linegraphs


📊 Line Graph Secrets: From Novice to Pro in Minutes! 📈 Transform boring data into captivating stories 💡 Choose the perfect chart for every situation 🚀 Make your numbers crystal clear instantly #ExcelTips #LineGraphs #Analytics #Future #Innovation #Excel #Technology

How to Choose the Right Graph for Data Visualization tinyurl.com/3r8u6xk8 #Barcharts #Datavisulaization #LineGraphs #CircularGraph #DifferentGraphs #AINews #AnalyticsInsight #AnalyticsInsightMagazine


📉 Line graphs connect data points over a continuous scale, ideal for illustrating trends and patterns. #LineGraphs #DataTrends

Line graphs ➕ Google Sheets 🟰 Easy to read data! 👩🏻💻 Read our article and see how to make line graphs in Google Sheets with easy steps and more! forms.app/en/blog/how-to… #LineGraphs #GoogleSheets #LineChart


📈📊 Ready to turn your data into dynamic visuals? Check out our guide on making line graphs in Excel. Learn how to visualize trends and insights for impactful presentations. Read more! bit.ly/3QPizq8 #ExcelTips #DataVisualization #LineGraphs


Day 26: Line Graphs - Tracing Health Trends 📊📈 Line graphs are the storytellers of health data. Join us as we follow the lines that chronicle trends over time – be it patient recovery rates, disease progression, or medication effectiveness. #LineGraphs #Biostatistics #datasgp

Let's start with line graphs. Do you have data that changes over time? This type of graph is ideal for visualizing trends. Drawing a line has never been easier! 📈 #Matplotlib #LineGraphs #DataVisualization

Thank you to the 8th graders who helped me teach my 7th graders about types of #graphs. They covered #bargraphs #linegraphs #dotplots #histograms and #piecharts @ Field School instagram.com/p/CnSaGaBvE5O/…

I know in #appdesign everyone loves the curvy #linegraphs, but it doesn't always workout the way you think it should. Example: This screenshot from the Canadian Blood Services app. Look at the dip after Oct. 12. This didn't happen IRL but it shows up on the graph. Thoughts?

#Rabobank saving the world, one privileged line graph lady at a time. The world used to be so complex and beyond our comprehension, but thankfully we now have #linegraphs

Do you want to make a line graph in #GoogleSheets but don't know how to? This guide demonstrates how to make #LineGraphs in google sheets. To #read the full #HowToGuide, click itechguides.com/how-to-make-a-…

The Grade 5/6’s used the new whiteboards with grids today to create #linegraphs! Thanks for the boards #dsbn! @merritt_ps

Grade 6/7s @PortWellerPS used #RatioTables and #LineGraphs and other student-led methods to help solve #Rate problems and make #Connections to #Patterning and #Graphing. #Math #Number #Operations #MathCommunity


There were six other groups as well. It was fun to look back on what we accomplished and create some more #LineGraphs! #Graphs #Data


The girls have been busy plotting #linegraphs to show how many presents Santa delivers. Be good and he might come to you!


(Line Graphs Problems) - #LineGraphs, #QuantitativeAptitudeTutorials, #QuantitativeAptitude, #SPLessons
Collecting data from our traveling paper airplanes and graphing it @PleasantUnionYR #linegraphs #datatables
Line graphs ➕ Google Sheets 🟰 Easy to read data! 👩🏻💻 Read our article and see how to make line graphs in Google Sheets with easy steps and more! forms.app/en/blog/how-to… #LineGraphs #GoogleSheets #LineChart


Read/interpret #LineGraphs. Working together 2 answer Q's that other students created 4 us. @orioleparkjps @tdsb
Excellent maths lesson with Year 5 yesterday: #linegraphs. @ReadingFC reckon Ovie can cover 16km per game?
I know in #appdesign everyone loves the curvy #linegraphs, but it doesn't always workout the way you think it should. Example: This screenshot from the Canadian Blood Services app. Look at the dip after Oct. 12. This didn't happen IRL but it shows up on the graph. Thoughts?
The Grade 5/6’s used the new whiteboards with grids today to create #linegraphs! Thanks for the boards #dsbn! @merritt_ps
Introduction to Information Handling! Developing our skills in interpreting information 😊 #tables #bargraphs #linegraphs #comparison

What’s the average high or low temperature by month in your favorite US city? #linegraphs #ABDrocks @AbingdonGIFT @AbingdonMath

Grade 6/7s @PortWellerPS used #RatioTables and #LineGraphs and other student-led methods to help solve #Rate problems and make #Connections to #Patterning and #Graphing. #Math #Number #Operations #MathCommunity
There were six other groups as well. It was fun to look back on what we accomplished and create some more #LineGraphs! #Graphs #Data
How to Choose the Right Graph for Data Visualization tinyurl.com/3r8u6xk8 #Barcharts #Datavisulaization #LineGraphs #CircularGraph #DifferentGraphs #AINews #AnalyticsInsight #AnalyticsInsightMagazine
Something went wrong.
Something went wrong.
United States Trends
- 1. Marshawn Kneeland 16.6K posts
- 2. Nancy Pelosi 21K posts
- 3. #MichaelMovie 29.3K posts
- 4. ESPN Bet 2,155 posts
- 5. #영원한_넘버원캡틴쭝_생일 22.8K posts
- 6. #NO1ShinesLikeHongjoong 23K posts
- 7. Gremlins 3 2,501 posts
- 8. Jaafar 8,879 posts
- 9. Good Thursday 35.2K posts
- 10. Joe Dante N/A
- 11. Madam Speaker N/A
- 12. Chimecho 4,496 posts
- 13. #thursdayvibes 2,838 posts
- 14. #LosdeSiemprePorelNO N/A
- 15. Happy Friday Eve N/A
- 16. Baxcalibur 3,201 posts
- 17. Penn 9,408 posts
- 18. VOTAR NO 27.7K posts
- 19. Chris Columbus 2,214 posts
- 20. Barstool 1,611 posts