#presentingdata 検索結果

Am getting a sneaking suspicion that today is going to be very bioinformatics / finance focused... #PresentingData


Really enjoyed #PresentingData class today. Thx for the retweet & nice meeting you today after lunch, @EdwardTufte!


Boost engagement with data visualisation. Infogram allows you to quickly communicate complex ideas in a visually appealing way, as you can see here: ow.ly/PYyX50xwMdW #infographic #presentingdata


Narcissism: Exceptional interest & admiration for yourself #presentingdata #implyingquestions #anticipatinganswers


At the @EdwardTufte workshop on #presentingdata in PDX today any other cartographers here? Wanna grab lunch together? #nacis #gis #cartography #womeningeospatial

Infographics are a great way to present data visually. Check out this interactive infographic we created about Le Tour de France using Infogram: theprezenter.com/news/the-tour-… #datavisualisation #presentingdata

Infographics are a great way to tell data stories. We're big fans of Infogram and we created a fair few infographics like this one over the years: ow.ly/UdMa50x8YJ6 #presentingdata #presentationdesign

Data doesn't have to mean boring graphs. With Infogram you can be creative and present data in a more visual, engaging way. Check out this infographic we made: ow.ly/pmy150wRy6q #presentingdata #presentation

What do you get when you blend information and graphics together? An infographic where data and facts are presented and accessed more quickly and easily: ow.ly/gfzg50wSSJo #presentingdata #infographic


Want to make your data presentations more engaging and impactful? Join us and learn how to design compelling visual aids that enhance your message. #presentingdata ow.ly/V6ZM50NGWhb


Study the rules and practices of quantitative communication to ensure that your audience understands your financial and other numerical presentations, and apply the tools to your specific business needs. Begins 9/21. bit.ly/3grBKop #PresentingData #Accounting #Finance


10 Tips for Presenting Data. resources.observepoint.com/blog/10-tips-f… #presentingdata #leadershipskills #skakeholders

Everyone's talking about cricket this week. A big match for England team tomorrow #CWC19. 🤞🤞 We're delighted to feature @ECB_cricket on our blog: ow.ly/Mo0N50uxV0O #presentingdata

How do you make data more visual and appealing for your audience? Try @infogram, like we did in this fun infographic about the John Wick movies: ow.ly/7Gwd50vW1ZD #presentingdata #infographic


This coming Monday! Don't miss "Chart Hacks" with Dr. Stephanie Evergreen from @evergreendata Conquer PowerPoint graphs with Stephanie's expert guidance. #dataviz #presentingdata #powerpointgraphs presentationguild.org/events/must-kn…

How familiar are you with @Infogram? This is a brilliant tool for #presentingdata. Here's an infographic we created about the 3rd John Wick movie with Keanu Reeves: ow.ly/E5kY50uNa7U


You know how hard extracting value from survey data is? You can spend weeks and get nowhere. We built Displayr to make analysis and reporting fast and easy, so you can quickly find evidence and inspiration in your survey data. #MarketResearch #PresentingData

Want to make your data speak volumes? 📢 Join us for the Presenting Data course, and unleash the potential of your presentations! ow.ly/7Eln50Rhgs6 #presentingdata

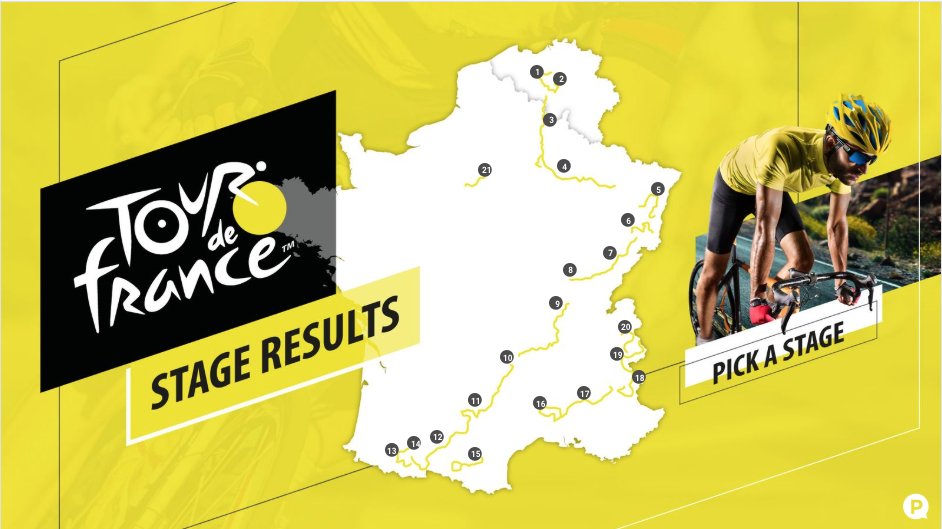
Making data visual is easier than you think. Take a look at this #infographic with the #TDF19 stage results: ow.ly/9Efh50xlhe7. Get in touch for a free consultation: [email protected] #presentingdata
Your data is powerful… but only if your audience understands its impact 📊✨ We can help you! Register for our FREE March Webinar to learn “Four Tools to Translate Data. Don’t miss out 🤩 Register today ➡️ hubs.la/Q037G9PP0 #iSpeakWebinar #PresentingData


youtube.com/watch?v=Ez5yS4… Karen is a leadership consultant extremely passionate about #storytelling. Her mission is to help people understand that their companies will perform better and be more empathetic if their leaders learn to use storytelling. #presentingdata #tedtalk #data
youtube.com
YouTube
Why storytelling is more trustworthy than presenting data | Karen...

Please spend 5 seconds and watch this: most people have no clue: #presentingdata #datatables imgur.com/gallery/ZY8dKpA
imgur.com
Imgur: Funny Memes & GIF Maker
How to make your tables less terrible
Want to make your data speak volumes? 📢 Join us for the Presenting Data course, and unleash the potential of your presentations! ow.ly/7Eln50Rhgs6 #presentingdata
Want to make your data presentations more engaging and impactful? Join us and learn how to design compelling visual aids that enhance your message. #presentingdata ow.ly/V6ZM50NGWhb
Don't miss out on the chance to improve your data presentation skills with our Presenting Data course. Sign up today! #datapresentation #presentingdata ow.ly/qFnn50NGW73


#Presentingdata is not always easy. Check out today's #testingtip for how to get and keep your audience's attention & lay the foundation for action! Join us for more tips for delivering impactful & relatable data. #streamliingassessmenteffort @naesp @nassp buff.ly/3JhNloT

#Presentingdata can be kind of boring and it is almost presentation time. How will you get ready? Today's #testingtip will help you. Check it out and share it with a friend so we can #streamlineassessmentefforts, presentations included! @nassp @NAESP buff.ly/3kS0Ke5

You know how hard extracting value from survey data is? You can spend weeks and get nowhere. We built Displayr to make analysis and reporting fast and easy, so you can quickly find evidence and inspiration in your survey data. #MarketResearch #PresentingData

“One of the resources I've been working on is our YouTube series on ‘Presenting Research Results’. It covers different aspects of presenting data and is also a great starting point for learning more about statistics! View here: buff.ly/3wwGAs2” ~ Grace #presentingdata

This coming Monday! Don't miss "Chart Hacks" with Dr. Stephanie Evergreen from @evergreendata Conquer PowerPoint graphs with Stephanie's expert guidance. #dataviz #presentingdata #powerpointgraphs presentationguild.org/events/must-kn…

Tips for Nailing Your Next Scientific Data Presentation via @PresentGurucom #presentingdata presentation-guru.com/scientific-pre…
Study the rules and practices of quantitative communication to ensure that your audience understands your financial and other numerical presentations, and apply the tools to your specific business needs. Begins 9/21. bit.ly/3grBKop #PresentingData #Accounting #Finance
We have a new webinar series! This is entitled ‘Presenting Research Results’ with the first on ‘Presenting Results as Telling Stories’. It looks at how strategies for good storytelling can be applied to the presentation of research results buff.ly/3ghEwvO #presentingdata


Join our free webinar on April 14th at 9am PST/12pm EST! You don’t want to miss the final session in our three-part Excel webinar series! #Excel #PresentingData #FreeWebinar CVSoci.al/mchErWxu
Really enjoyed #PresentingData class today. Thx for the retweet & nice meeting you today after lunch, @EdwardTufte!
Study the rules and practices of quantitative communication to ensure that your audience understands your financial and other numerical presentations, and apply the tools to your specific business needs. Begins 9/21. bit.ly/3grBKop #PresentingData #Accounting #Finance
Narcissism: Exceptional interest & admiration for yourself #presentingdata #implyingquestions #anticipatinganswers
At the @EdwardTufte workshop on #presentingdata in PDX today any other cartographers here? Wanna grab lunch together? #nacis #gis #cartography #womeningeospatial
Am getting a sneaking suspicion that today is going to be very bioinformatics / finance focused... #PresentingData
Your data is powerful… but only if your audience understands its impact 📊✨ We can help you! Register for our FREE March Webinar to learn “Four Tools to Translate Data. Don’t miss out 🤩 Register today ➡️ hubs.la/Q037G9PP0 #iSpeakWebinar #PresentingData
This coming Monday! Don't miss "Chart Hacks" with Dr. Stephanie Evergreen from @evergreendata Conquer PowerPoint graphs with Stephanie's expert guidance. #dataviz #presentingdata #powerpointgraphs presentationguild.org/events/must-kn…
Boost engagement with data visualisation. Infogram allows you to quickly communicate complex ideas in a visually appealing way, as you can see here: ow.ly/PYyX50xwMdW #infographic #presentingdata
Infographics are a great way to present data visually. Check out this interactive infographic we created about Le Tour de France using Infogram: theprezenter.com/news/the-tour-… #datavisualisation #presentingdata
You know how hard extracting value from survey data is? You can spend weeks and get nowhere. We built Displayr to make analysis and reporting fast and easy, so you can quickly find evidence and inspiration in your survey data. #MarketResearch #PresentingData
Infographics are a great way to tell data stories. We're big fans of Infogram and we created a fair few infographics like this one over the years: ow.ly/UdMa50x8YJ6 #presentingdata #presentationdesign
Want to make your data speak volumes? 📢 Join us for the Presenting Data course, and unleash the potential of your presentations! ow.ly/7Eln50Rhgs6 #presentingdata
Data doesn't have to mean boring graphs. With Infogram you can be creative and present data in a more visual, engaging way. Check out this infographic we made: ow.ly/pmy150wRy6q #presentingdata #presentation
What do you get when you blend information and graphics together? An infographic where data and facts are presented and accessed more quickly and easily: ow.ly/gfzg50wSSJo #presentingdata #infographic
Don't miss out on the chance to improve your data presentation skills with our Presenting Data course. Sign up today! #datapresentation #presentingdata ow.ly/qFnn50NGW73
10 Tips for Presenting Data. resources.observepoint.com/blog/10-tips-f… #presentingdata #leadershipskills #skakeholders
Want to make your data presentations more engaging and impactful? Join us and learn how to design compelling visual aids that enhance your message. #presentingdata ow.ly/V6ZM50NGWhb
Everyone's talking about cricket this week. A big match for England team tomorrow #CWC19. 🤞🤞 We're delighted to feature @ECB_cricket on our blog: ow.ly/Mo0N50uxV0O #presentingdata
How do you make data more visual and appealing for your audience? Try @infogram, like we did in this fun infographic about the John Wick movies: ow.ly/7Gwd50vW1ZD #presentingdata #infographic
Something went wrong.
Something went wrong.
United States Trends
- 1. Ukraine 530K posts
- 2. #KayJewelers N/A
- 3. #Veloragpt N/A
- 4. Putin 180K posts
- 5. Geraldo 2,756 posts
- 6. #pilotstwtselfieday 1,006 posts
- 7. #FursuitFriday 13.8K posts
- 8. Anthony Joshua 4,299 posts
- 9. Le Cowboy N/A
- 10. #FanCashDropPromotion 4,156 posts
- 11. Start Cade N/A
- 12. NOTAM 3,327 posts
- 13. Chris DeMarco N/A
- 14. Kenyon 2,211 posts
- 15. Mark Kelly 80.7K posts
- 16. Zelensky 113K posts
- 17. Happy Thanksgiving 3,669 posts
- 18. UNLAWFUL 154K posts
- 19. Carlton 4,624 posts
- 20. Tina Peters 46.5K posts