#rawgraphs2 ผลการค้นหา


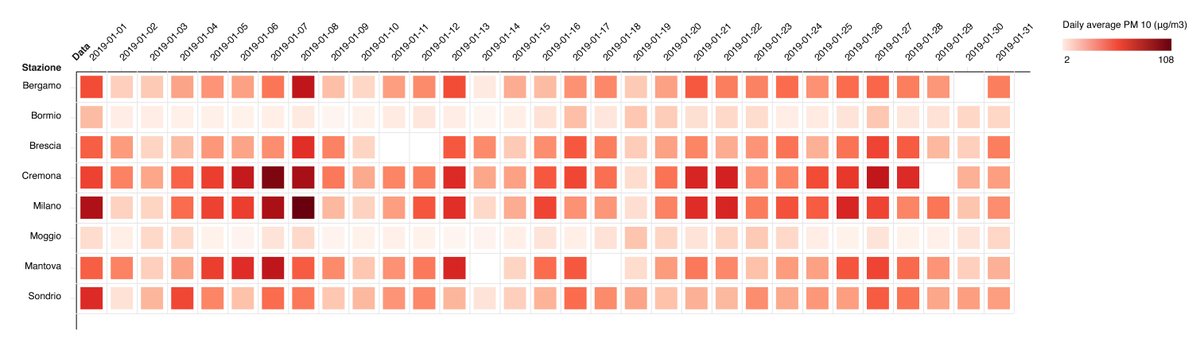
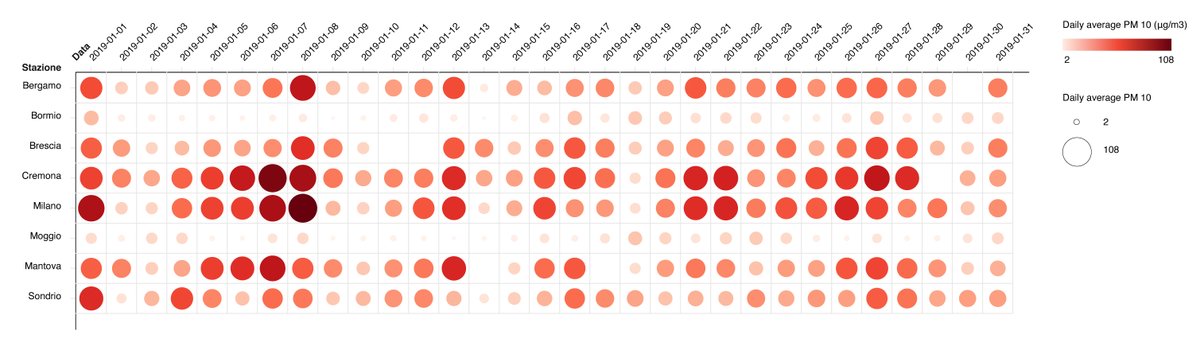
Testing a new chart for #RAWGraphs2: a Matrix Chart/Heatmap. In this example, we visualize the daily average levels of PM 10 in Lombardia during a month. What do you think - besides the fact that the air quality in Lombardia is very low?


Visualizing frequency of average daily temperatures 1901 - 2020 🇳🇱 using Matrix heatmap from #RAWGraphs2 Data @KNMI

Every time you create a chart with RAWGraphs you always have to start from scratch...but not for long 🔜 on #RAWGraphs2 Save and open .rawgraphs projects (data+mapping+options) 😎
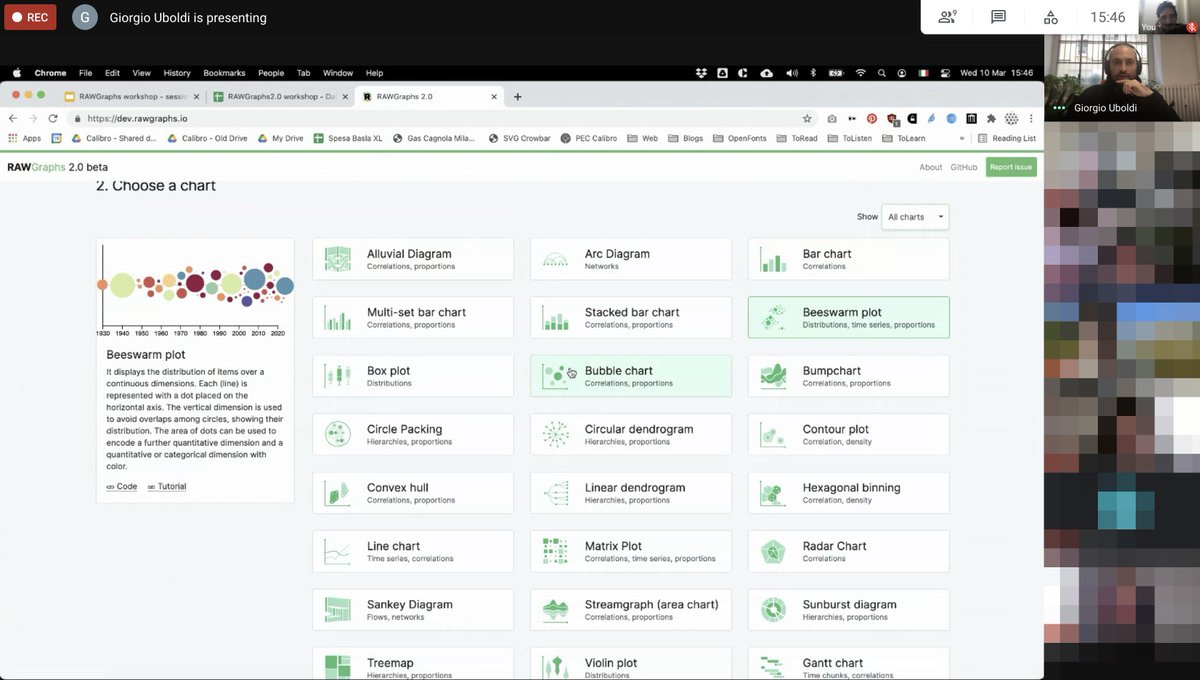
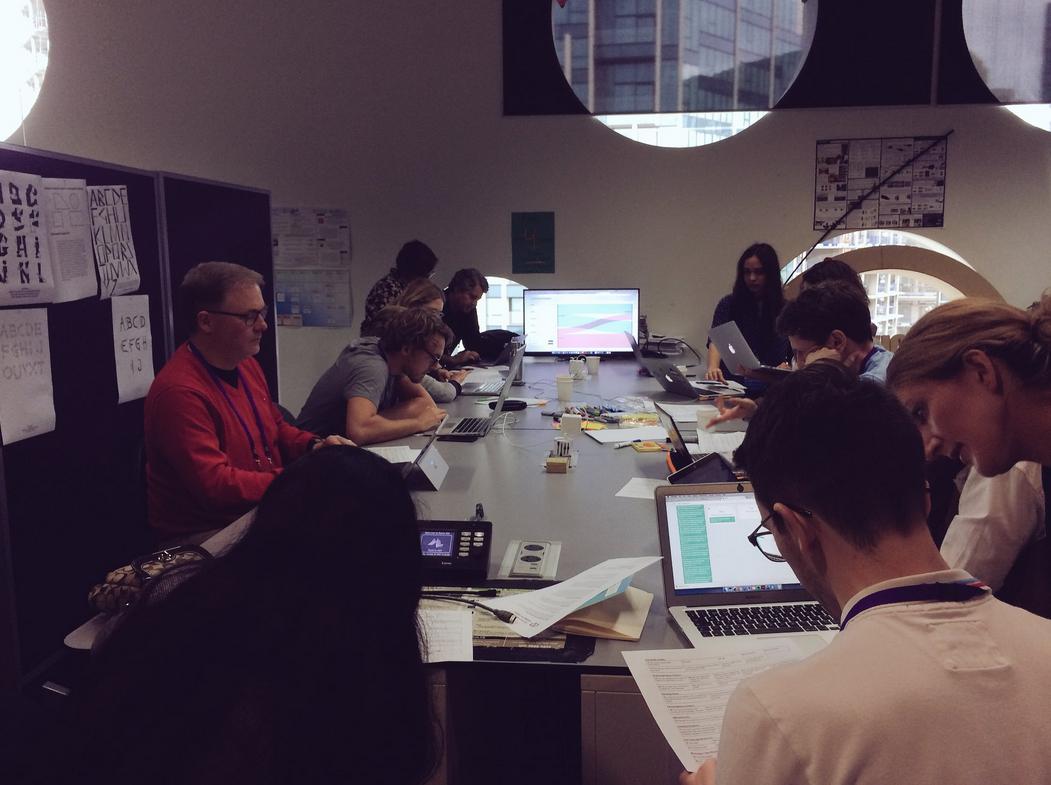
@giorgiouboldi kicking off the first #rawgraphs2 workshop 🚀🚀🚀 a huge thank you to all our sponsors for making this possible!
What a day! @Code4Africa backed our campaign and it's the 4th Gold Sponsor of #RAWGraphs2. @Code4Africa is Africa’s Largest Civic Technology + Data Journalism Initiative and operates in 8+ countries with labs in Lagos, Abuja, Nairobi, Dar es Salaam, Kampala and Cape Town.
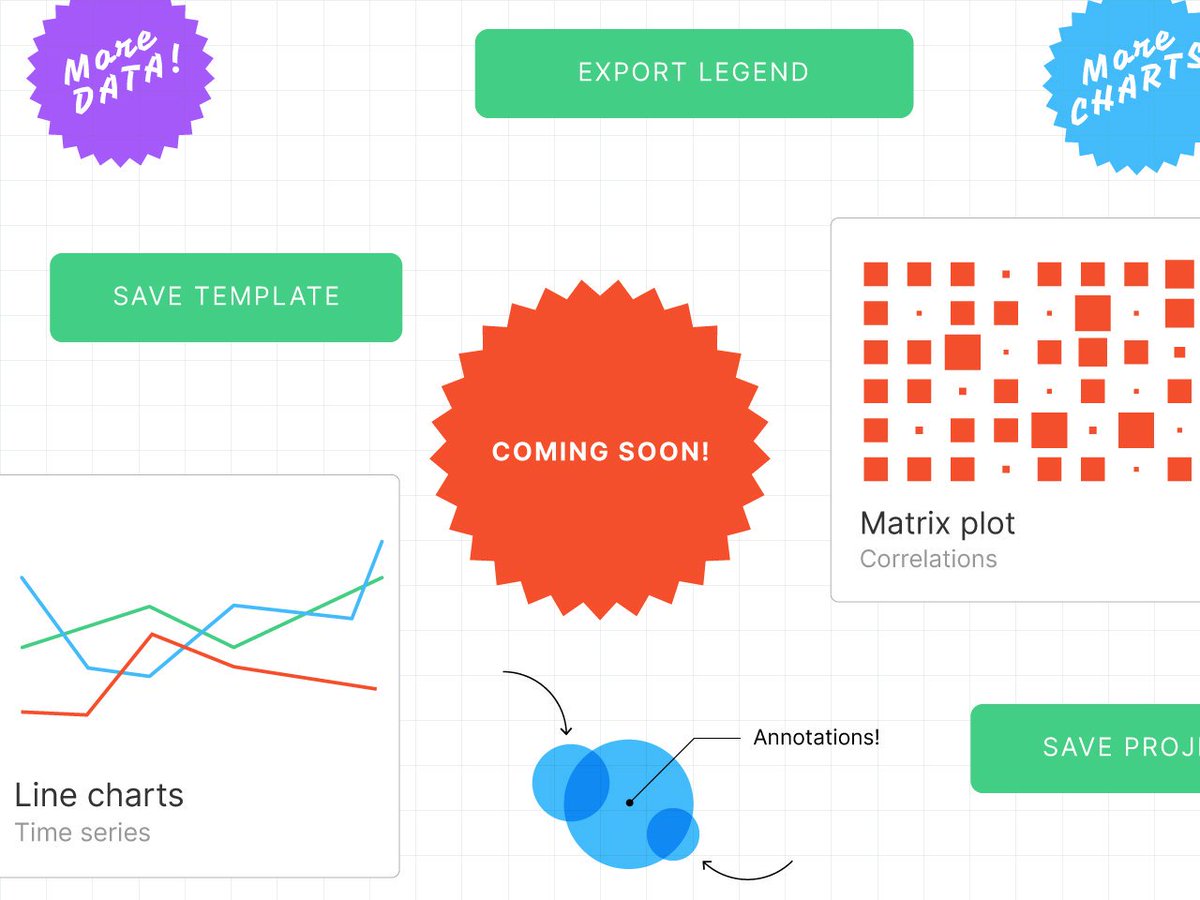
What do you think about our plans for #RAWGraphs2? rawgraphs.io/crowdfunding-c… From October 1st we will need your help to make all these things possible! Help us by spreading the word about the campaign through social media and within your network. 🙏 #encode19
What about a one day #datavisualization #RAWGraphs2 workshop with us in #Milan? There is a perk just for you on our indiegogo campaign: igg.me/at/rawgraphs2/… No prior knowledge required. We will announce the dates as soon as possible. Only 18 perks left. Hurry up!!


Your tool is so powerful ♥️! vizualism.nl/datavisualisat… Can't hardly wait for full deployment of #RAWGraphs2 !


If you love #dataviz you should support the @rawgraphs campaign on #indiegogo. #RAWGraphs2 #datavisualization #crowdfunding #densitydesign #studiocalibro #milan
It's time to support #RAWGraphs: a free and #opensource software to visualize data. Check the campaign on #Indiegogo and choose a perk: igg.me/at/rawgraphs2 DONATE💰, SUPPORT🤝& SHARE📣! #datavisualization #dataviz #crowdfunding #RAWGraphs2

Today i'll present @rawgraphs at #nicar21! Join us if you want to see the new features of #RAWGraphs2 ✨
Happy to participate at #NICAR21 @IRE_NICAR today. @mikima will present the new features and how to use #RAWGraphs nicar21.pathable.co/meetings/virtu…

33 days to go, 69% still to be collected! Help us in keeping #RAWGraphs2 open and free: support and donate! igg.me/at/rawgraphs2 #datavisualization #dataviz #crowdfunding
33-33-33 (thanks @dataninjait for the new sponsorship!) #RAWGraphs2 #crowdfunding #infoviz
33% of 33k reached and 33 days left to support our campaign! 33-33-33 (cit.) A pretty clear reference for our italian followers :) youtube.com/watch?v=RWi-up…

The RAWGraphs funding campaign is live on INDIEGOGO! it's time show us your support by donating and sharing the campaign link: igg.me/at/rawgraphs2 #dataviz #RAWgraphs2
It's time to support #RAWGraphs: a free and #opensource software to visualize data. Check the campaign on #Indiegogo and choose a perk: igg.me/at/rawgraphs2 DONATE💰, SUPPORT🤝& SHARE📣! #datavisualization #dataviz #crowdfunding #RAWGraphs2
Have you also forked RAWGraphs by tweaking it or adding new features? Share it with us, show the potential of open projects and help us in promoting the #rawgraphs2 campaign --> igg.me/at/rawgraphs2

I've just supported #RAWGraphs2 – a web app for data visualization. It's a simple and powerful tool that I use in my workshops and work. And I can't wait to see @rawgraphs 2.0 new features! igg.me/p/rawgraphs-2-… #indiegogo
Here is the list of the sponsors of @rawgraphs campaign so far: join them, become a sponsor of #rawgraphs2!
We invite you to give a big round applause to the companies and organizations that supported our campaign by becoming our sponsors: @zazukocom @accuratstudio @data4change @Code4Africa @thevisualagency - @ImpactVI @dataninjait 24 days left to donate 💸 igg.me/at/rawgraphs2/…

@giorgiouboldi kicking off the first #rawgraphs2 workshop 🚀🚀🚀 a huge thank you to all our sponsors for making this possible!
Today i'll present @rawgraphs at #nicar21! Join us if you want to see the new features of #RAWGraphs2 ✨
Happy to participate at #NICAR21 @IRE_NICAR today. @mikima will present the new features and how to use #RAWGraphs nicar21.pathable.co/meetings/virtu…
Visualizing frequency of average daily temperatures 1901 - 2020 🇳🇱 using Matrix heatmap from #RAWGraphs2 Data @KNMI
Every time you create a chart with RAWGraphs you always have to start from scratch...but not for long 🔜 on #RAWGraphs2 Save and open .rawgraphs projects (data+mapping+options) 😎
Testing a new chart for #RAWGraphs2: a Matrix Chart/Heatmap. In this example, we visualize the daily average levels of PM 10 in Lombardia during a month. What do you think - besides the fact that the air quality in Lombardia is very low?
201 backers supported #RAWGraphs2 so far! Stop scrolling around and support a free and open source project developed by @densitydesign @studiocalibro @inmagiklabs igg.me/at/rawgraphs2/…
Here is the list of the sponsors of @rawgraphs campaign so far: join them, become a sponsor of #rawgraphs2!
We invite you to give a big round applause to the companies and organizations that supported our campaign by becoming our sponsors: @zazukocom @accuratstudio @data4change @Code4Africa @thevisualagency - @ImpactVI @dataninjait 24 days left to donate 💸 igg.me/at/rawgraphs2/…

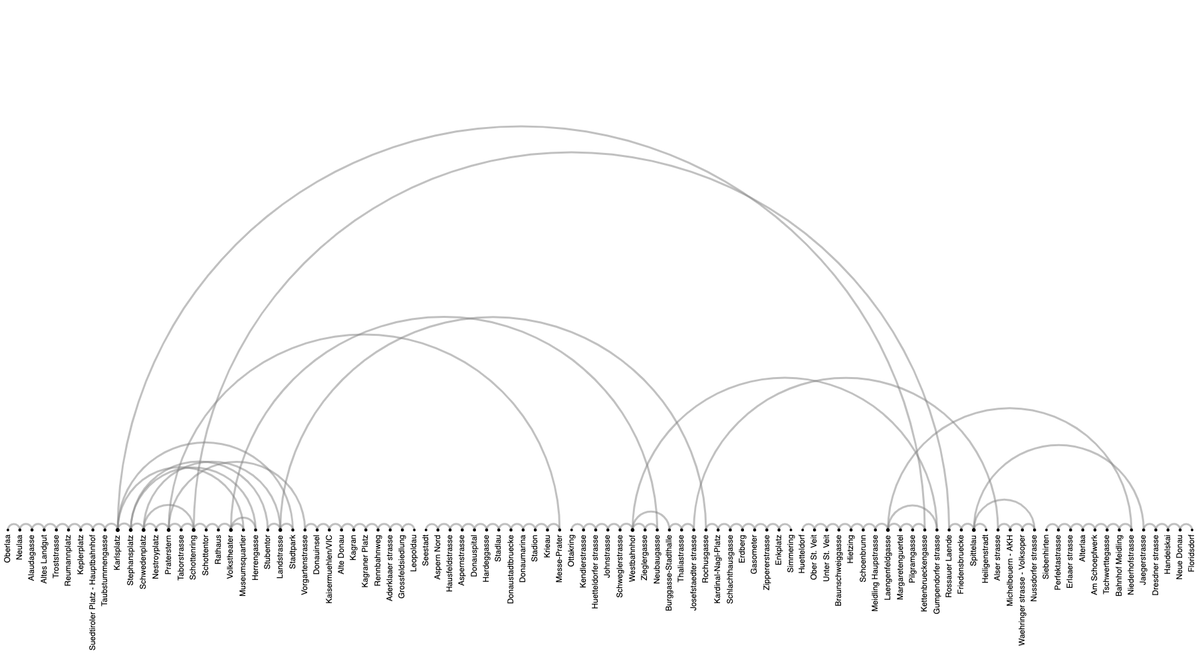
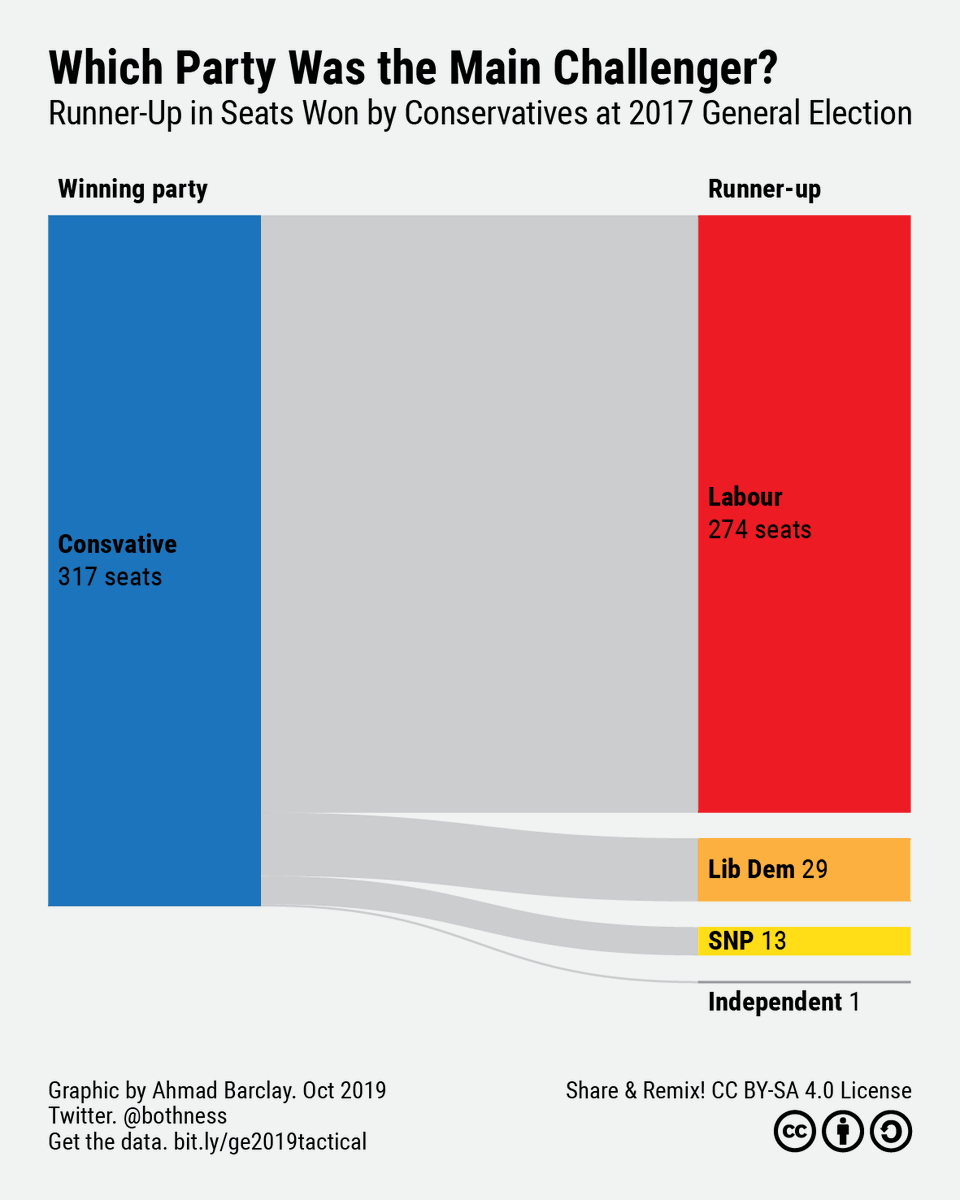
I made this alluvial diagram with the help of @rawgraphs, a free and open-source #dataviz tool... Be sure to support their crowdfunder to make #RAWGraphs2 even better... indiegogo.com/projects/rawgr…
3/ I narrowed down my analysis to the 317 seats won by @Conservatives at the 2017 General election, since these are the core focus for tactical voting, whether to get the #ToriesOut or #StopBrexit. This chart shows which party came second in each of these constituencies in 2017
We're very happy to announce our first Special Gold Sponsor, with a custom version of #RAWGraphs2: @zazukocom!
We are super glad to present our new Special Gold Sponsor: @zazukocom ! They are a small and skilled team working on anything related to #RDF based knowledge graphs and #linkeddata and they decided to donate 5,000€ to support our new release.
What a day! @Code4Africa backed our campaign and it's the 4th Gold Sponsor of #RAWGraphs2. @Code4Africa is Africa’s Largest Civic Technology + Data Journalism Initiative and operates in 8+ countries with labs in Lagos, Abuja, Nairobi, Dar es Salaam, Kampala and Cape Town.
A new bronze sponsorship for #RAWGraphs2: thanks @dataninjait! Check out their work and their new online school: dataninja.it/en/
We are super happy to announce the second bronze sponsor of our project: @dataninjait ! Dataninja is a data-driven company stemmed from an eclectic working group based in Italy and active throughout Europe since 2012.

33-33-33 (thanks @dataninjait for the new sponsorship!) #RAWGraphs2 #crowdfunding #infoviz
33% of 33k reached and 33 days left to support our campaign! 33-33-33 (cit.) A pretty clear reference for our italian followers :) youtube.com/watch?v=RWi-up…
33 days to go, 69% still to be collected! Help us in keeping #RAWGraphs2 open and free: support and donate! igg.me/at/rawgraphs2 #datavisualization #dataviz #crowdfunding
Have you also forked RAWGraphs by tweaking it or adding new features? Share it with us, show the potential of open projects and help us in promoting the #rawgraphs2 campaign --> igg.me/at/rawgraphs2
I just backed #rawgraphs2 crowdfunder on Indiegogo. I hope all #datavis professionals, students + hobbyists who rely on @rawgraphs to make their life easier will do the same! (I'll share some of my own #rawgraphs #datavisualization examples in this thread) igg.me/at/rawgraphs2/…
If you love #dataviz you should support the @rawgraphs campaign on #indiegogo. #RAWGraphs2 #datavisualization #crowdfunding #densitydesign #studiocalibro #milan
It's time to support #RAWGraphs: a free and #opensource software to visualize data. Check the campaign on #Indiegogo and choose a perk: igg.me/at/rawgraphs2 DONATE💰, SUPPORT🤝& SHARE📣! #datavisualization #dataviz #crowdfunding #RAWGraphs2
What about a one day #datavisualization #RAWGraphs2 workshop with us in #Milan? There is a perk just for you on our indiegogo campaign: igg.me/at/rawgraphs2/… No prior knowledge required. We will announce the dates as soon as possible. Only 18 perks left. Hurry up!!
What do you think about our plans for #RAWGraphs2? rawgraphs.io/crowdfunding-c… From October 1st we will need your help to make all these things possible! Help us by spreading the word about the campaign through social media and within your network. 🙏 #encode19
@giorgiouboldi kicking off the first #rawgraphs2 workshop 🚀🚀🚀 a huge thank you to all our sponsors for making this possible!
Visualizing frequency of average daily temperatures 1901 - 2020 🇳🇱 using Matrix heatmap from #RAWGraphs2 Data @KNMI
Every time you create a chart with RAWGraphs you always have to start from scratch...but not for long 🔜 on #RAWGraphs2 Save and open .rawgraphs projects (data+mapping+options) 😎
What a day! @Code4Africa backed our campaign and it's the 4th Gold Sponsor of #RAWGraphs2. @Code4Africa is Africa’s Largest Civic Technology + Data Journalism Initiative and operates in 8+ countries with labs in Lagos, Abuja, Nairobi, Dar es Salaam, Kampala and Cape Town.
Testing a new chart for #RAWGraphs2: a Matrix Chart/Heatmap. In this example, we visualize the daily average levels of PM 10 in Lombardia during a month. What do you think - besides the fact that the air quality in Lombardia is very low?
What about a one day #datavisualization #RAWGraphs2 workshop with us in #Milan? There is a perk just for you on our indiegogo campaign: igg.me/at/rawgraphs2/… No prior knowledge required. We will announce the dates as soon as possible. Only 18 perks left. Hurry up!!
Something went wrong.
Something went wrong.
United States Trends
- 1. #happybdayTYGA N/A
- 2. $SENS $0.70 Senseonics CGM N/A
- 3. $APDN $0.20 Applied DNA N/A
- 4. $LMT $450.50 Lockheed F-35 N/A
- 5. Peggy 35.1K posts
- 6. GeForce Season 2,834 posts
- 7. Sonic 06 3,117 posts
- 8. Comey 45.2K posts
- 9. Stargate 4,457 posts
- 10. Halligan 18.1K posts
- 11. $NVDA 47K posts
- 12. Zeraora 18K posts
- 13. Cory Mills 37.1K posts
- 14. Berseria 5,869 posts
- 15. Dearborn 401K posts
- 16. #ComunaONada 4,630 posts
- 17. Rick Hendrick 1,774 posts
- 18. International Men's Day 99.8K posts
- 19. Tati 3,210 posts
- 20. Ronaldo 279K posts