#datavis 搜索结果

New Fonts! Wavefont and Linefont by Dmitry Ivanov are non-text #variablefonts to render data. #datavis 📈 fonts.google.com/share?selectio…


This is a Sankey diagram of how a typical lab project goes. Let us know if we missed any categories #Sankey #DataVis


Why did I have a temporary post-Covid #MEcfs *improvement*..?!🤔 I've tried to figure it out by assembling this Google Sheets self-tracking #dataVis extravaganza.😵💫 I'll try to break it down into more manageable parts and explain the various ideas I've brainstormed.🙂 🧵 1/n


Learn how to use Principal Component Analysis (PCA) in R to simplify large data sets while retaining crucial information. Click this link for detailed information: statisticsglobe.com/online-course-… #Rpackage #tidyverse #datavis #DataScience #ggplot2 #DataVisualization #RStats #Statistics

How to draw a pairs plot using Base R & the ggplot2 package: statisticsglobe.com/r-pairs-plot-e… #statisticians #datavis #Rpackage #coding #tidyverse #ggplot2 #RStats #rstudioglobal #VisualAnalytics

Making subplots in Python can be challenging. An alternative to the traditional plt.subplots() is using plt.subplot_mosaic(). Benjamin Marlé recently shared this useful tip! More details are available at this link: eepurl.com/gH6myT #datavis#Python#programmer#datascience


Hoy presenté esta visualización sobre viajes en @ecobici en el marco del @forobicimex. Además, ya pueden consultarla en línea. #muéveteenbici #datavis

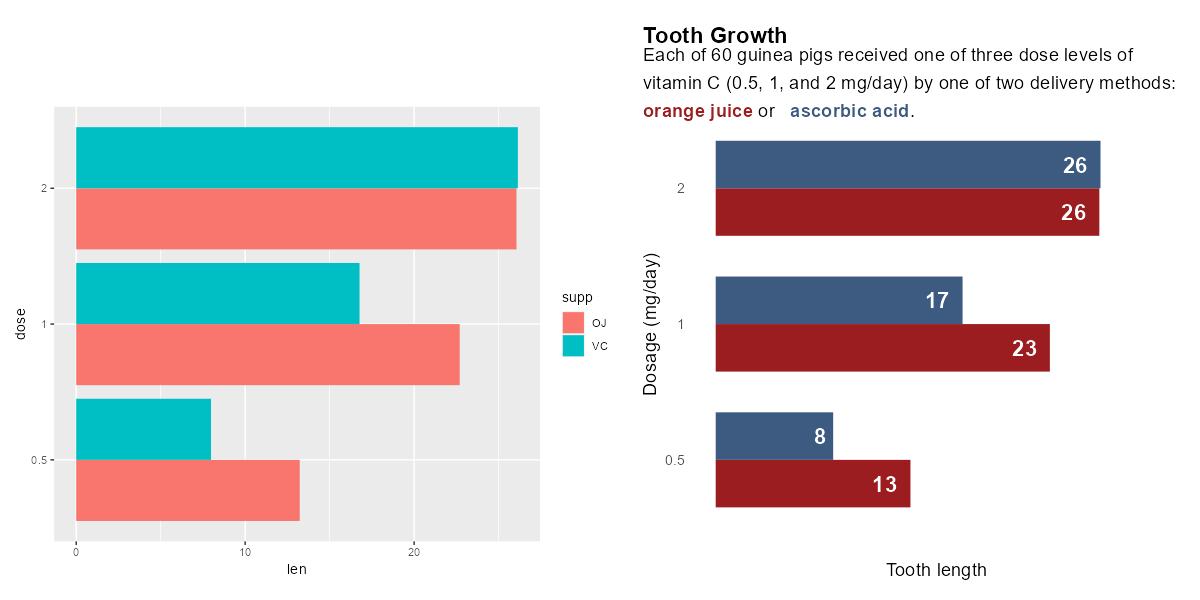
📣We've just launched a new guide for data visualisation Covering the core principles & elements of #datavis - the structure of charts & tables and how they can be refined to aid readability. Read it here ⬇️ rss.org.uk/news-publicati…

Interrupting the usual #datavis #rstats broadcast: 📰ANNOUNCE: Big Day here -- 📘📗📕 ✔️Finished final editing & tweaks on my book ✔️re-built PDF & web versions, ✔️clicked SEND to forward to my editor. ✔️Published the online version ✔️DONE, for now:


🚨 ¡Encuentra la paleta de colores perfecta para tus gráficos en R! 🎨 Elegir colores para tus gráficos puede ser frustrante y consumir mucho tiempo... 😩 ¡Pero no tiene por qué ser así! 💡🧵👇 #dataviz #datavis #analytics #stats #rstats #datascience

Governments collect a lot of data, but it's important to ask where they got the data and how they compiled it. Government data is entered by people, and they don't always type well. 📺 Full discussion on YouTube: youtu.be/Wdau5wH1xX4 #datavis #opendata
How to draw an interactive violin plot using the plotly library in the Python programming language. The tutorial was created in collaboration with Ifeanyi Idiaye: statisticsglobe.com/plotly-violin-… #DataViz #datavis #Python #pythoncode #datasciencetraining #programming


Ever wondered how to visualize data sets like a pro in Python? I've got you covered with a comprehensive tutorial on drawing pandas DataFrame columns in different plot types using the Matplotlib library. More info: statisticsglobe.com/draw-plot-from… #Statistics #datavis #database #Python

Have you read our guide for data visualisation? 📖 Now with a new section on Julia, it covers the core principles & elements of #datavis - the structure of charts & tables and how they can be refined to aid readability Read it here ⬇️ royal-statistical-society.github.io/datavisguide/


Next time you need to visualize data, add Mapbox Studio to your toolkit. In this tutorial, learn how to upload and style custom data using the Data Visualization component in Mapbox Studio: buff.ly/422LxHm #dataviz #datavis #datavisualization #datavisualisation


At our #cancergenomics course you'll learn: • High throughput sequencing • Genomics & epigenetics • Structural variation, SNV & CNV analysis, & #datavis • CRISPR-Cas9 genome editing • RNA-seq analysis • Single-cell research Apply by 31 March: ebi.ac.uk/training/event…


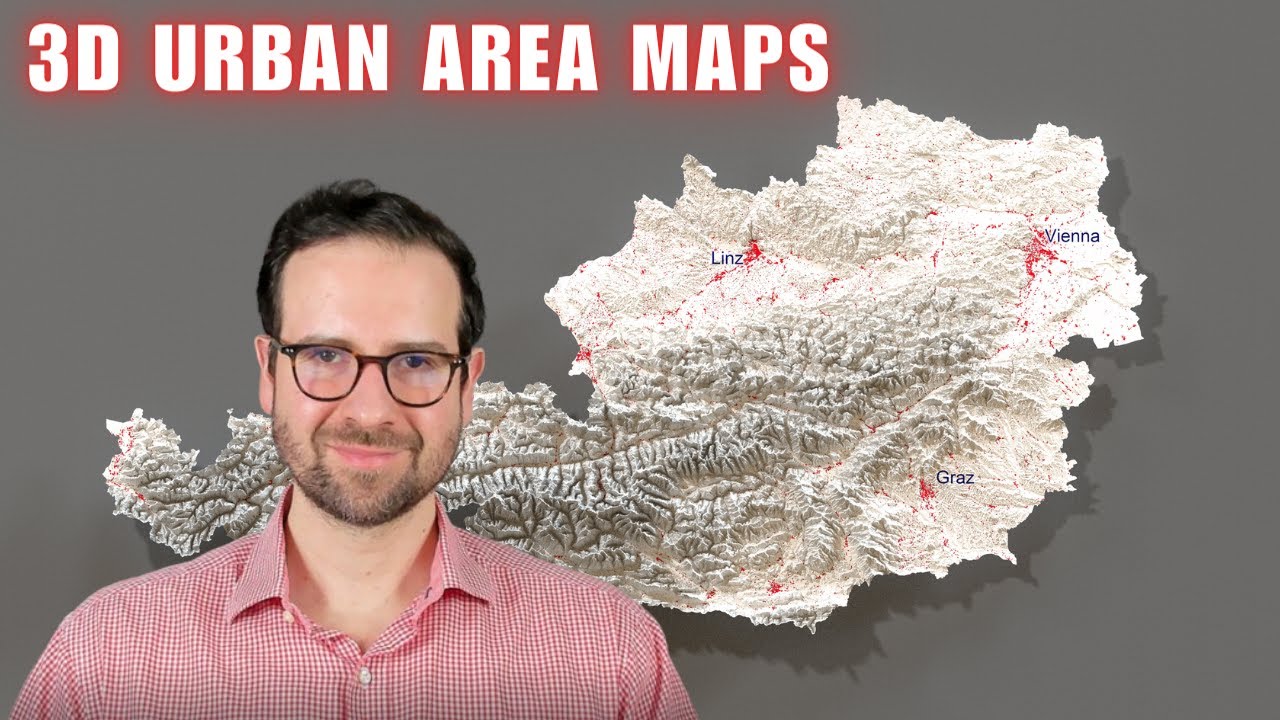
3D elevation and urban area maps with R youtube.com/watch?v=K5Qf6Q… #rstats #datavis
youtube.com
YouTube
Why 3D Maps Will Change Your City Forever

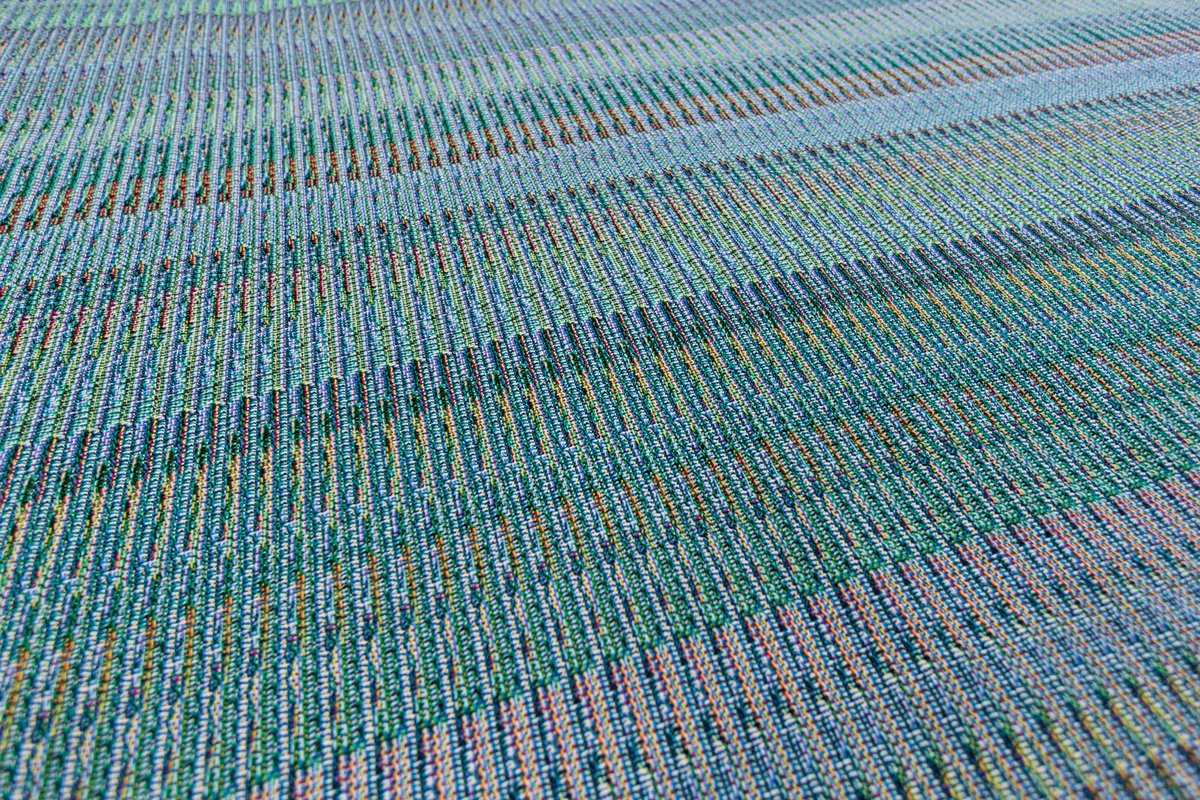
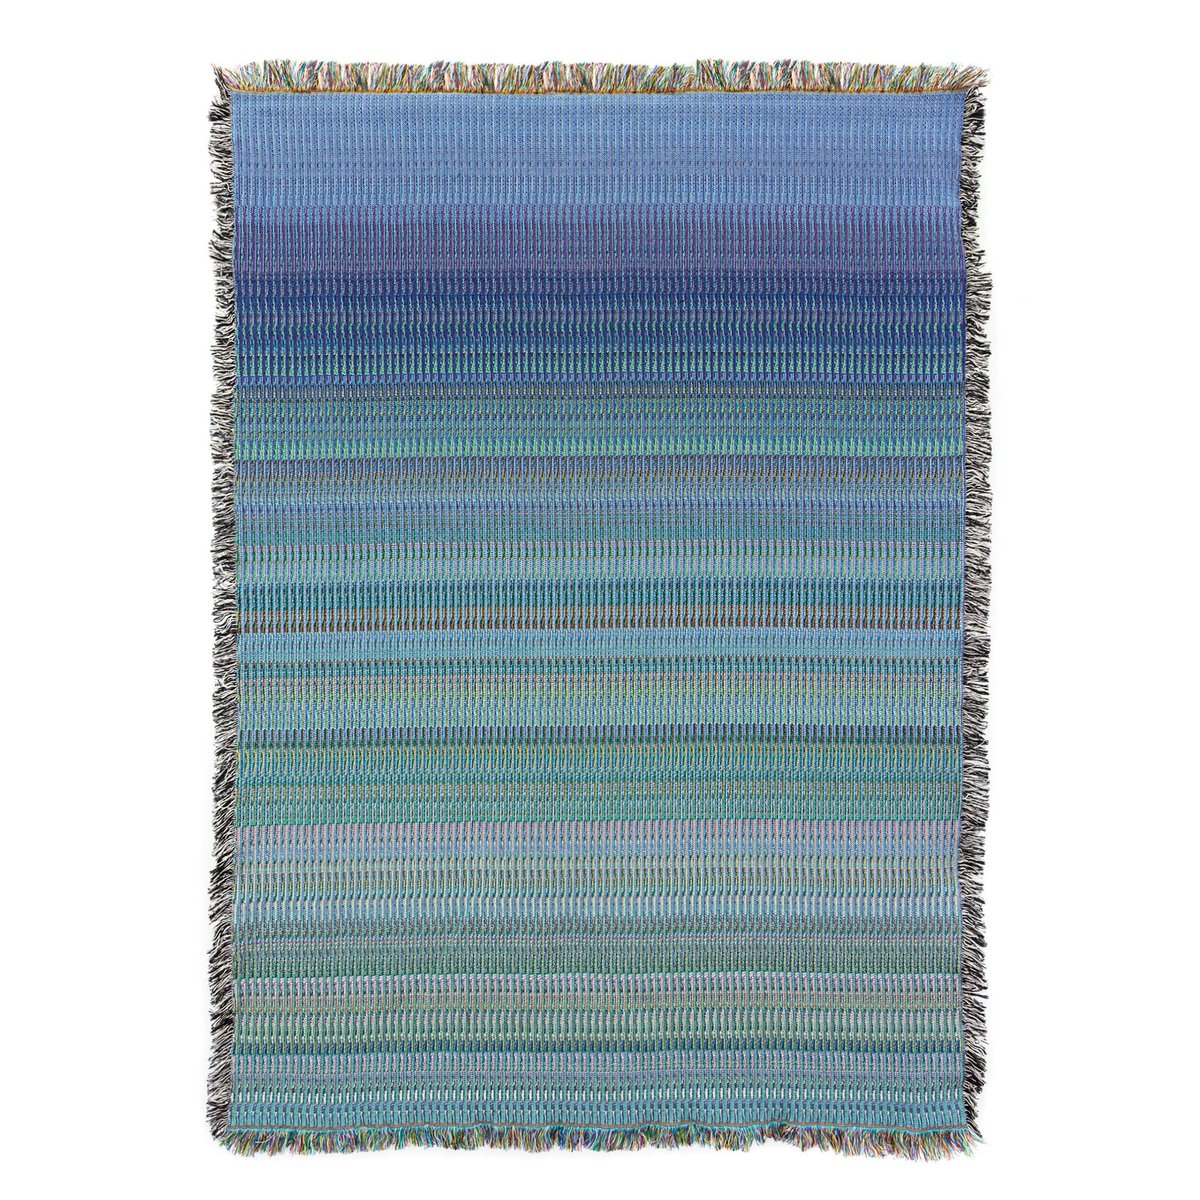
Data Visions Collection 1. Growth Potential Throw - Detail 2. Growth Potential Throw - Detail 3. Growth Potential Throw - Front glitchtextiles.com #uniqlo #datavis #processing #creativecoding #fastretailing #glitchtextiles #textiles #textiledesign #textileart #woven
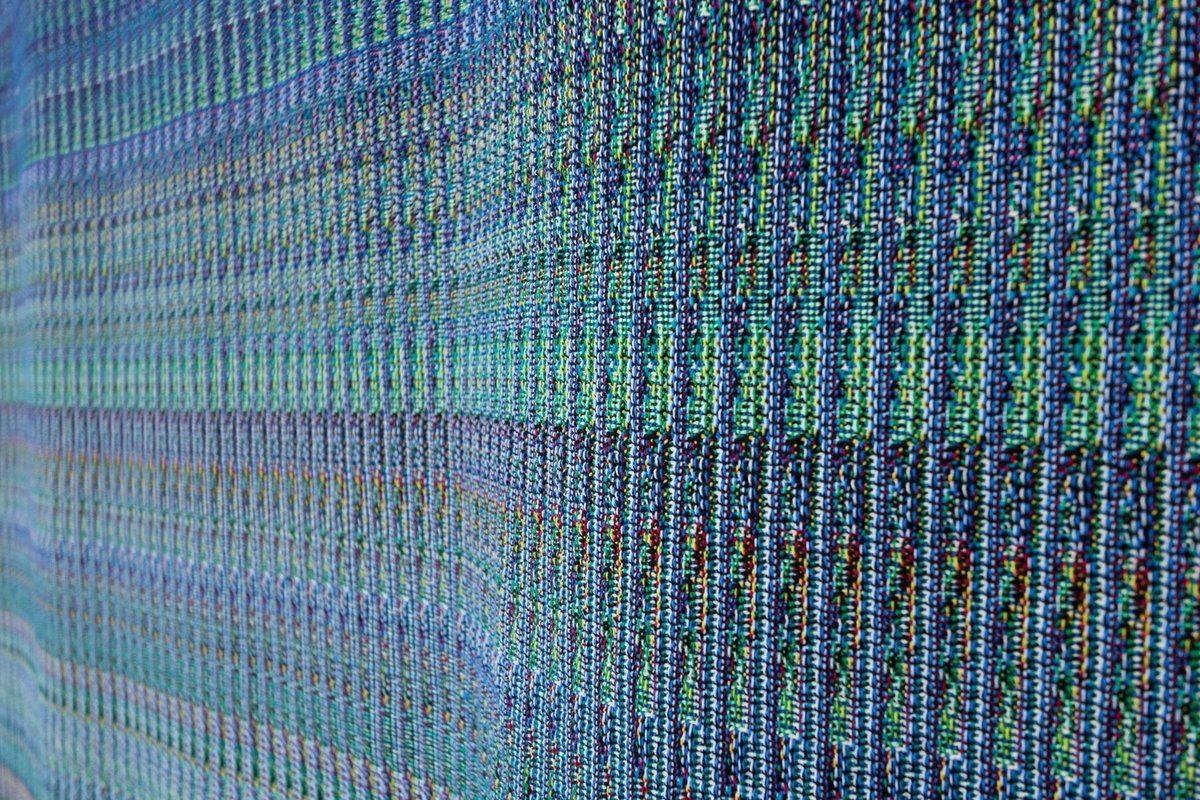
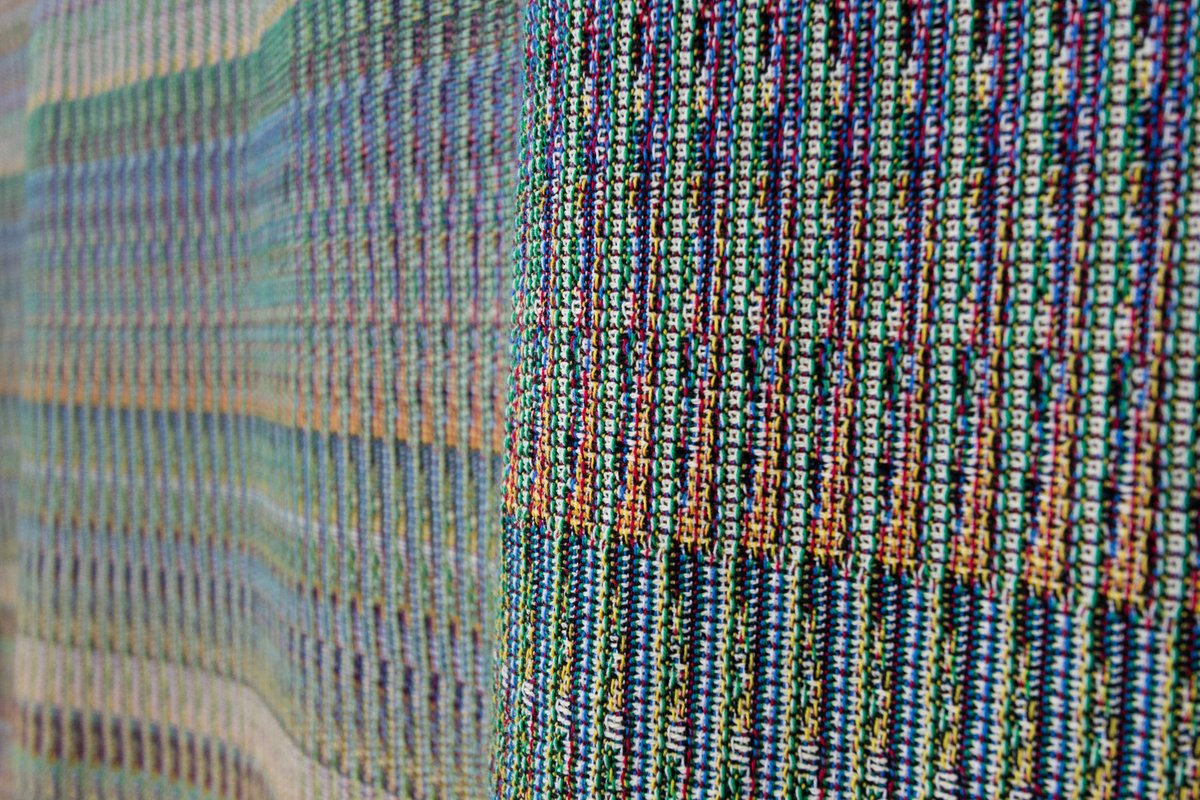
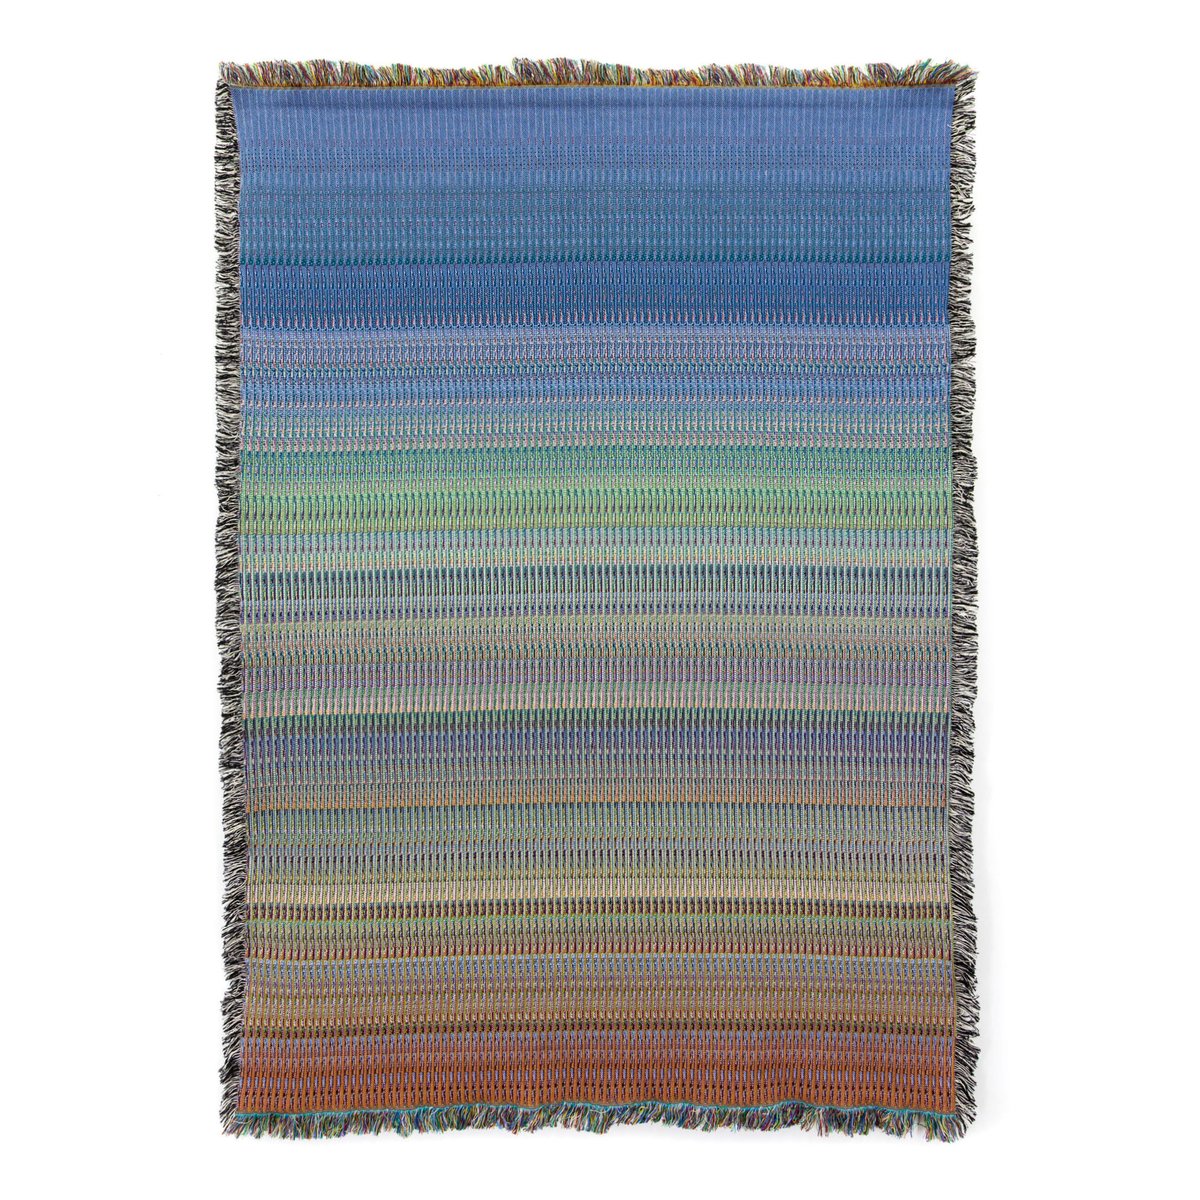
Data Visions Collection 1. Upward Trend Throw - Detail 2. Upward Trend Throw - Front glitchtextiles.com #datavis #dataviz #datavisualization #uniqlo #creativecoding #glitchtextiles #textiles #textiledesign #textileart #woven

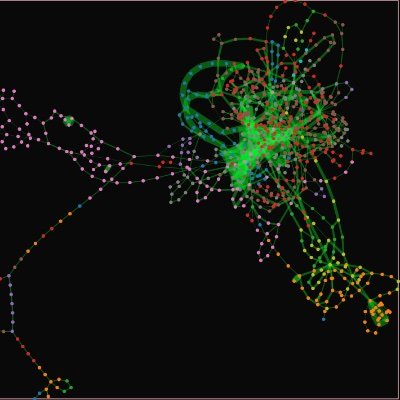
Guest editor Christian Miles stepped in for Bryce for this week’s Weekly Edge with a deeper dive into some recent graph visualization curiosities. The full visual feast: gdotv.com/blog/weekly-ed… #graphvisualization #datavis #IEEEVIS #graphdatabases #knowledgegraphs
SARS-CoV-2 Collection 1. Nucleocapsid Warped 10 Pillow - Detail 2. Nucleocapsid Warped 10 Pillow - Front 3. SARS CoV-2 Diagonal Pillow - Front glitchtextiles.com #datavis #dataviz #dna #covid19 #processing #glitchtextiles #textiles #textiledesign #textileart #woven
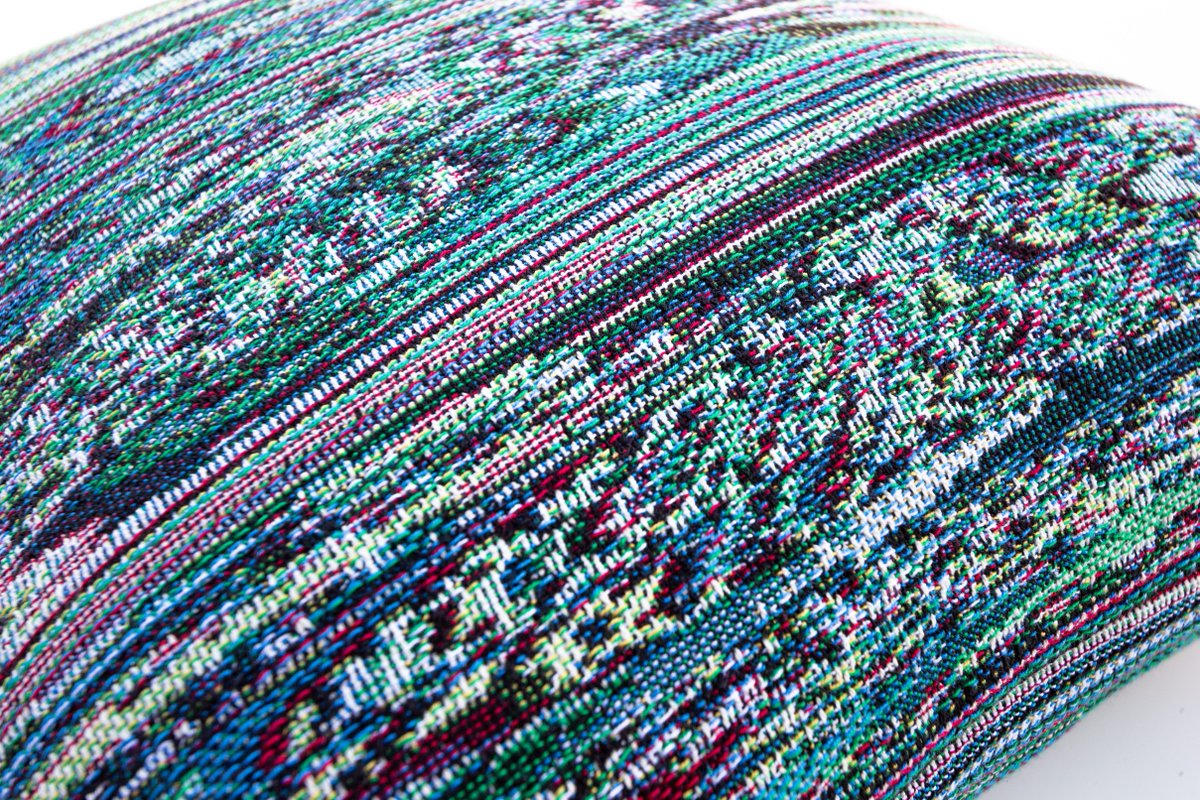
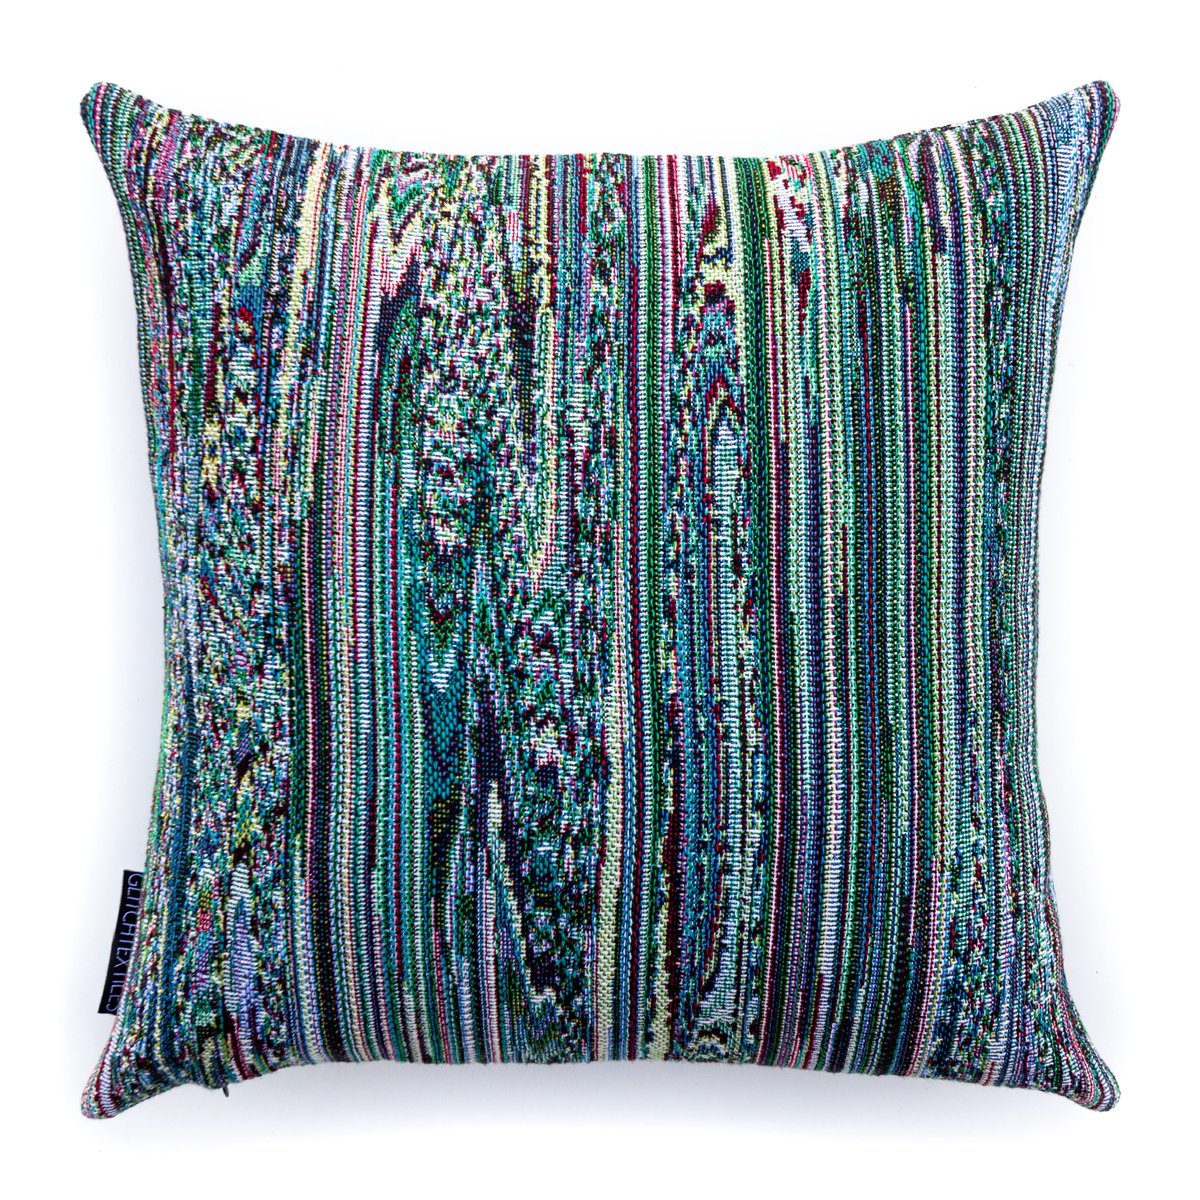
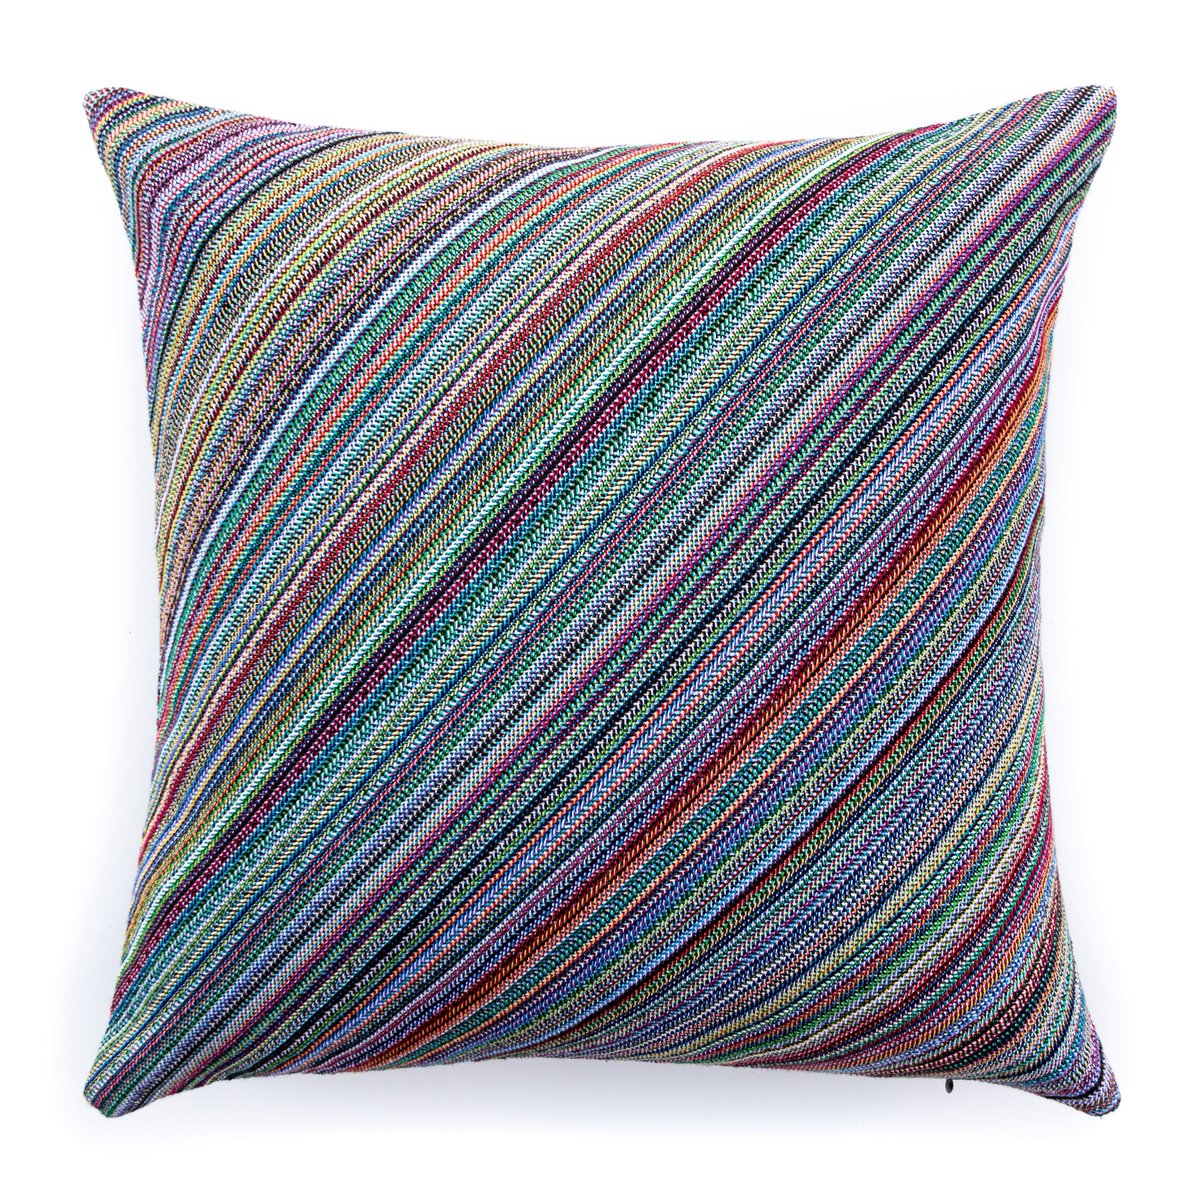


SARS-CoV-2 Collection 1. Nucleocapsid Warped 10 Pillow - Detail 2. Nucleocapsid Warped 10 Pillow - Front 3. SARS CoV-2 Diagonal Pillow - Front glitchtextiles.com #datavis #dataviz #dna #covid19 #processing #glitchtextiles #textiles #textiledesign #textileart #woven
Data Visions Collection 1. Upward Trend Throw - Detail 2. Upward Trend Throw - Front glitchtextiles.com #datavis #dataviz #datavisualization #uniqlo #creativecoding #glitchtextiles #textiles #textiledesign #textileart #woven
Data Visions Collection 1. Growth Potential Throw - Detail 2. Growth Potential Throw - Detail 3. Growth Potential Throw - Front glitchtextiles.com #uniqlo #datavis #processing #creativecoding #fastretailing #glitchtextiles #textiles #textiledesign #textileart #woven
Something went wrong.
Something went wrong.
United States Trends
- 1. Lakers 46.7K posts
- 2. Giants 80K posts
- 3. Dillon Brooks 4,254 posts
- 4. #WWERaw 64K posts
- 5. Bron 21.7K posts
- 6. Patriots 118K posts
- 7. Drake Maye 22.2K posts
- 8. Dart 33.4K posts
- 9. Collin Gillespie 1,091 posts
- 10. Suns 14.5K posts
- 11. Diaz 34K posts
- 12. Devin Williams 7,248 posts
- 13. Pats 15.1K posts
- 14. Ryan Nembhard 2,920 posts
- 15. Gunther 13.7K posts
- 16. Joe Schoen 3,063 posts
- 17. Devin Booker 2,223 posts
- 18. Younghoe Koo 6,092 posts
- 19. Mets 18.3K posts
- 20. Abdul Carter 9,959 posts