#vizintooltip 搜尋結果

Hey #rstats folks! In the next highcharter release you can experiment with #VizInTooltip in a easy way (I hope!) (just like the T software) @Highcharts

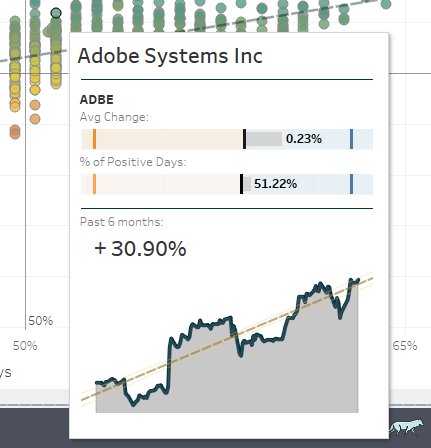
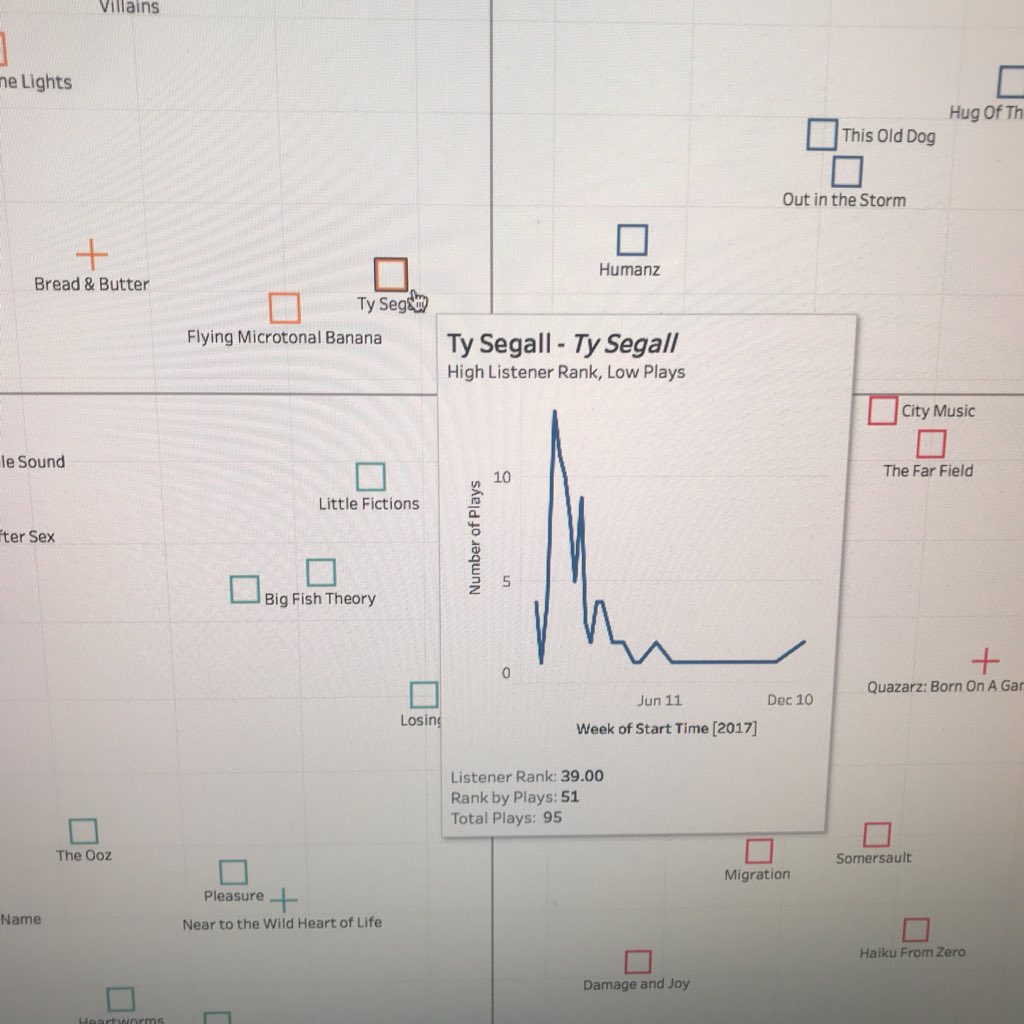
Weirdly can't leave it alone - I love the dynamic scorecard style nature of it. #vizintooltip #tableau


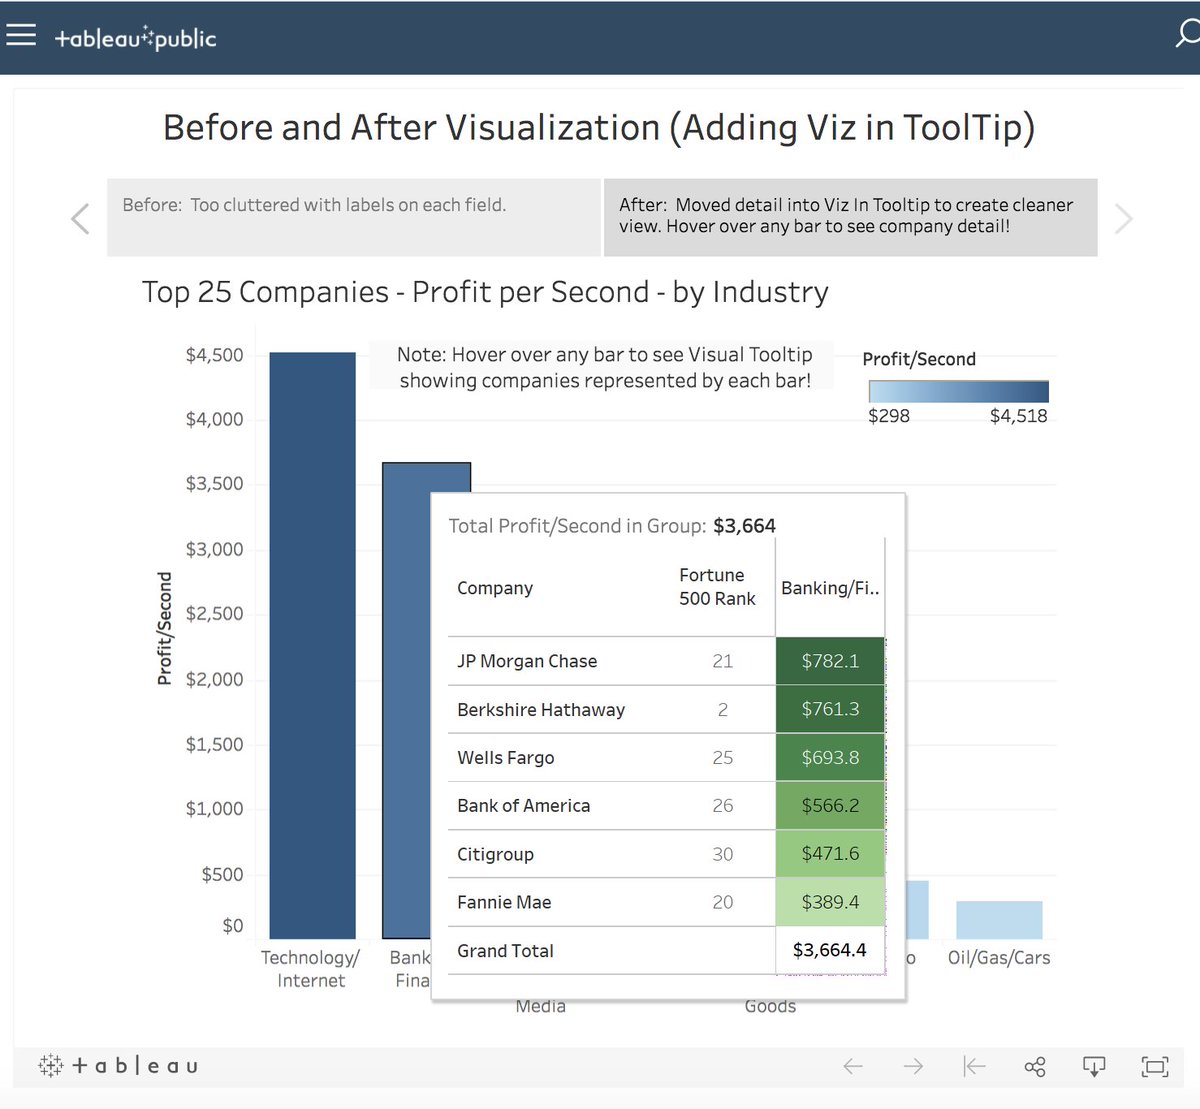
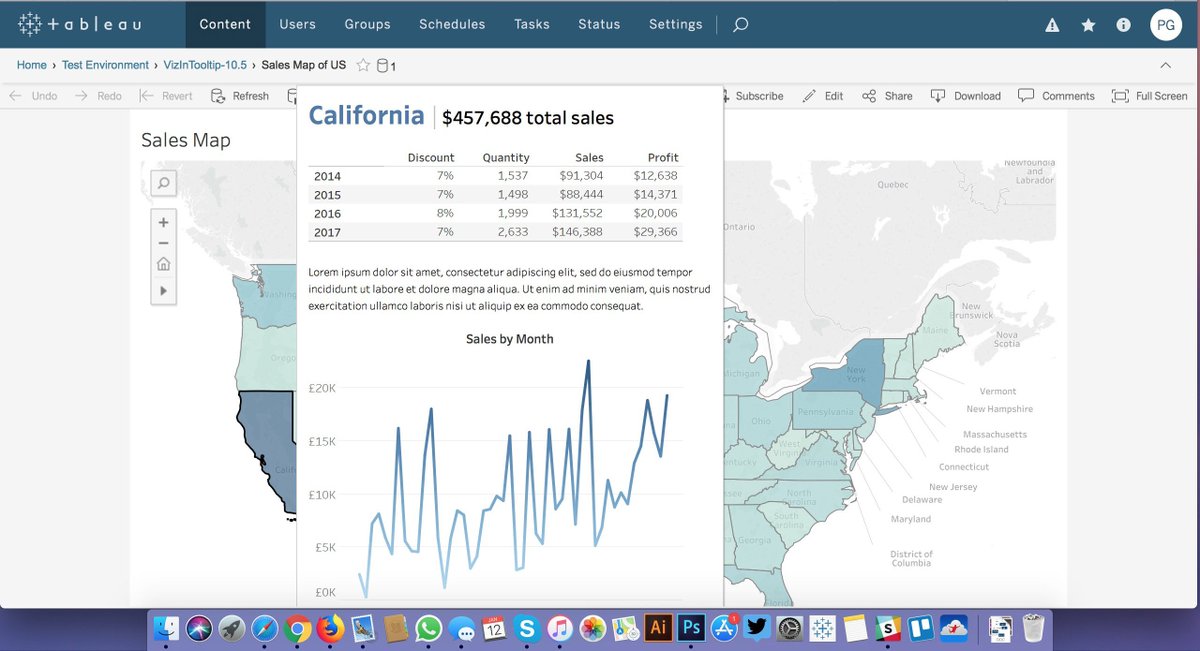
#MakeOverMonday Thanks for the feedback, @sarahlovesdata! Putting the detail into a #VizInToolTip definitely neatens up the Viz. This is looking better. public.tableau.com/views/MostProf…

I love you @tableau and I'm going to let you finish, but it took you ten and a half versions to implement #VizinTooltip while Semiotic had it back in 0.7.3.


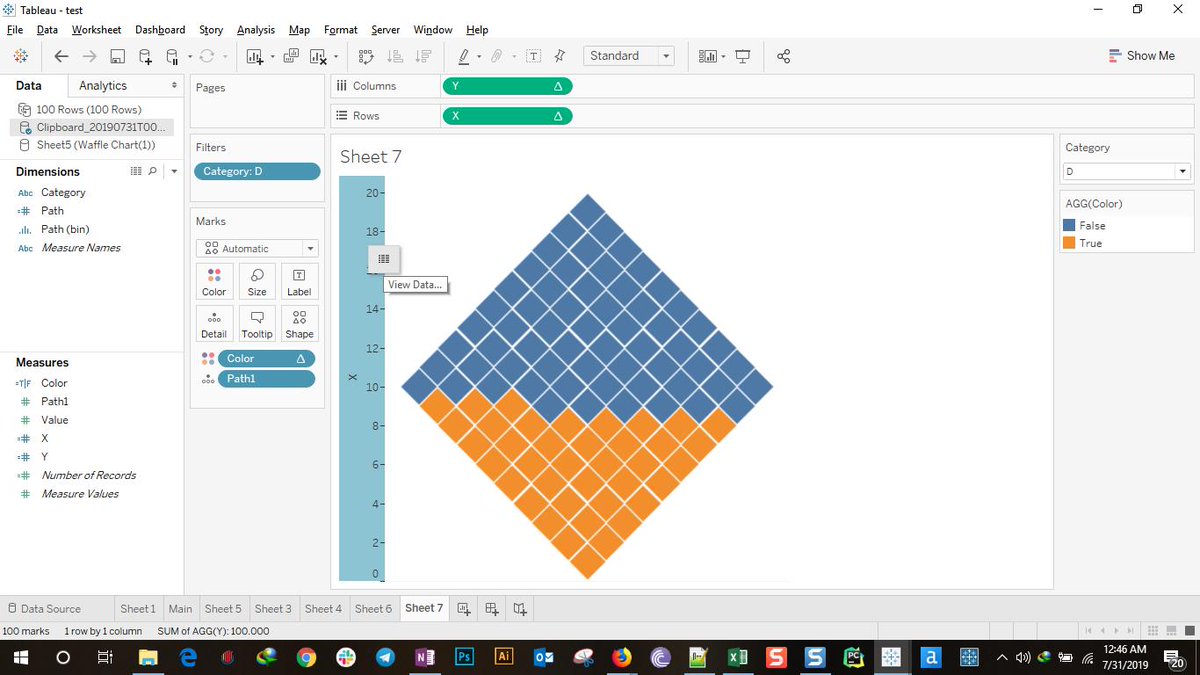
#TinyTableauTip - In tableau 2019.2,you can View entire data by clicking on Axis . What is Really like , the same feature is available on #vizIntooltip as well. Spoiler Alert: Created a dynamic Waffle Chart by using X and Y Calc in @tableau . Blogpost will be out tomorrow.

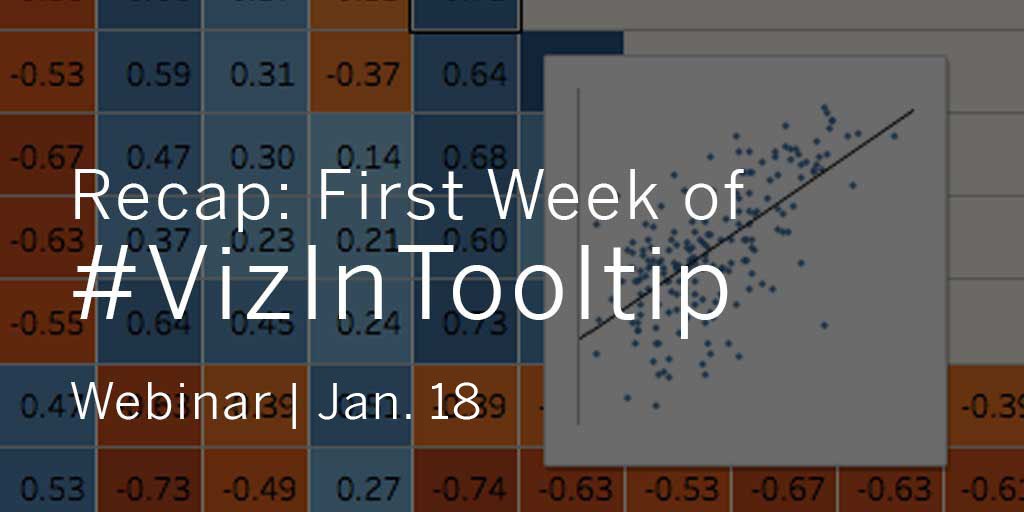
Need a recap on #VizInTooltip tips, tricks, and examples? Join us this Thursday to find out! Register: tabsoft.co/2B3tgN1

I've been working on a viz about stars and just used #VizInTooltip to add a sort of zoom when you hover over a star.


🚨New Blog Post Alert🚨📣 Starting Viz? Want to know how to use Viz in Tooltips, and make an impact on your viewers 💡? Read this blog ✍️ for steps. tableau-ish.blogspot.com/2020/12/viz-in… #VizInTooltip #Tableau #Datafam @tableaupublic #DataAnalytics #Basics #blogger


This week's #MakeoverMonday offered a great way to practice #Vizintooltip and Calculations. TIA for your feedback! #MMVizReview 2020 week 43 public.tableau.com/views/Finalapp… via @tableaupublic

Life Satisfaction vs GDP Rich countries are generally happier than poor ones. Here is my submission for #makeovermonday W11 #vizintooltip #boxplots @tableau @tableaupublic Interactive Link : tabsoft.co/2w4TFgZ

#TinyTableauTip - In tableau 2019.2,you can View entire data by clicking on Axis . What is Really like , the same feature is available on #vizIntooltip as well. Spoiler Alert: Created a dynamic Waffle Chart by using X and Y Calc in @tableau . Blogpost will be out tomorrow.
Thanks for the reco @YvanFornes! This means a lot to us :) #data19 #datafam #vizintooltip

Welcome to the community! This is solid with good context throughout. The #vizintooltip is big. I think the info. in the tooltip is more than enough without the slope chart.
Thx Kevin! And thanks for your help with the #vizintooltip. It adds a lot to the context for the first part of the viz.
This was a real treat to read. Love your header solution to create a dynamic design (would have never guessed the entire thing was a pic!). Great inspiration from @flerlagekr's Modern Slavery viz and @tableauing's #vizintooltip dashboard technique. I'm inspired!

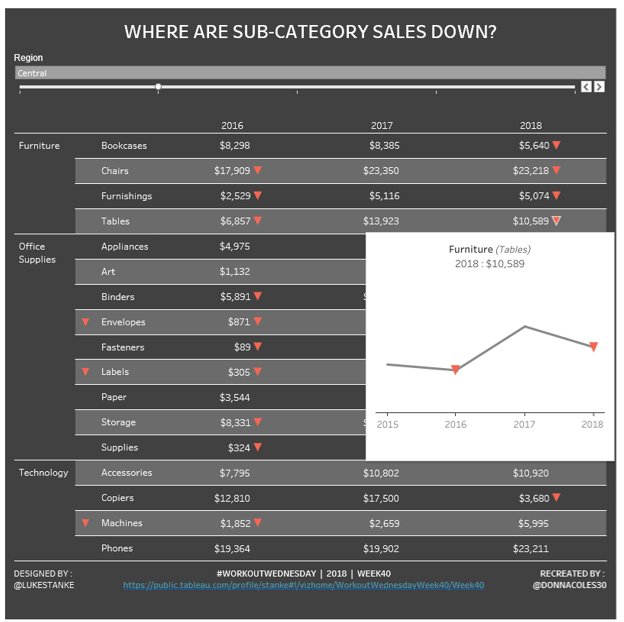
Text tables that aren't text tables in #Tableau for #WorkoutWednesday week 40 plus a bit of #VizInTooltip action. Nice challenge @lukestanke! tinyurl.com/yazl6ty6 @RodyZakovich @AnnUJackson @VizWizBI

Iterated, thanks to @theneilrichards for his feedback inspiring a #vizintooltip solution to provide some context within the interactive. Updated version on @tableaupublic now. public.tableau.com/profile/mtedw#…

Thanks Kevin!!! It’s more fun interactive. I’ve got some #vizintooltip (which PS I’m voting for viz in tooltip highlighting!). Love the continuous select concept! Which I saw first in @flerlagekr’s viz but I guess was an idea from @j_olsufka. Very clever!

Attention #KCTUG users! It's time for the next meetup. We're gonna be hanging out at @AmericanCentury hearing about their #Tableau journey. Hear some highlights from the greater community & I'm showing you how to make your #VizInTooltip's shine! Register: augustkctug.eventbrite.com

I like this...a lot. The text intro sells me right away and the viz quality shines throughout. #vizintooltip for the win!
This is really cool and stuffed with interesting stats. LOVED the #vizintooltip images of race cars over the years.

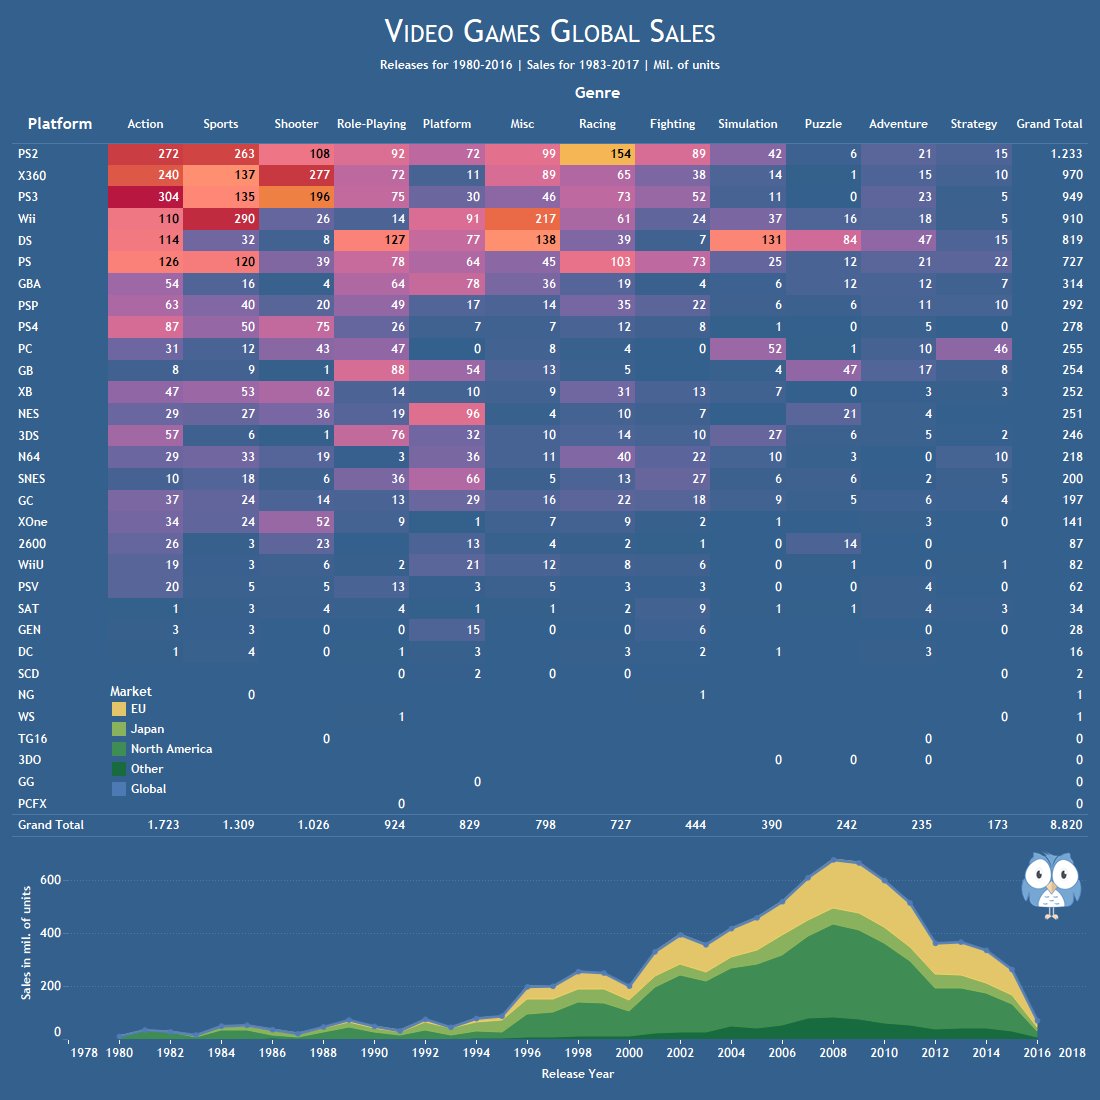
Here's my new #Tableau viz of Video Games Global Sales with data found on @datadotworld I'm glad I stuck with the #VizInTooltip for this one. public.tableau.com/profile/sever.…

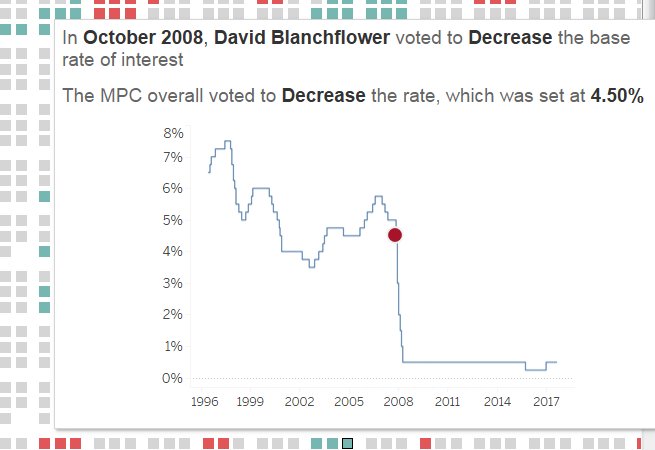
Really useful technique for using #VizInTooltip as part of guided analytics,worth checking out 👇

I guess it's a case of 'great minds think alike', @SimonBeaumont04 :) Here is my application for Selective Tooltips in @Tableau #VizInTooltip curvediscussion.com/selective-tool…
I guess it's a case of 'great minds think alike', @SimonBeaumont04 :) Here is my application for Selective Tooltips in @Tableau #VizInTooltip curvediscussion.com/selective-tool…
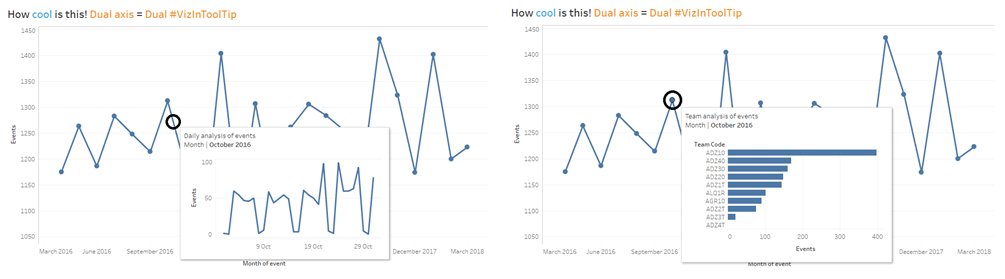
NEW | One #VizInToolTip or Two?! It's a given @tableau #VizInToolTip is amazing functionality but what if you could use a dual axis to show two different #VizInToolTip for the same data point without them being in the same pop-up?! Find out how | vizionaryblog.co.uk/blog/one-viz-i…

Hey #rstats folks! In the next highcharter release you can experiment with #VizInTooltip in a easy way (I hope!) (just like the T software) @Highcharts
Need a recap on #VizInTooltip tips, tricks, and examples? Join us this Thursday to find out! Register: tabsoft.co/2B3tgN1

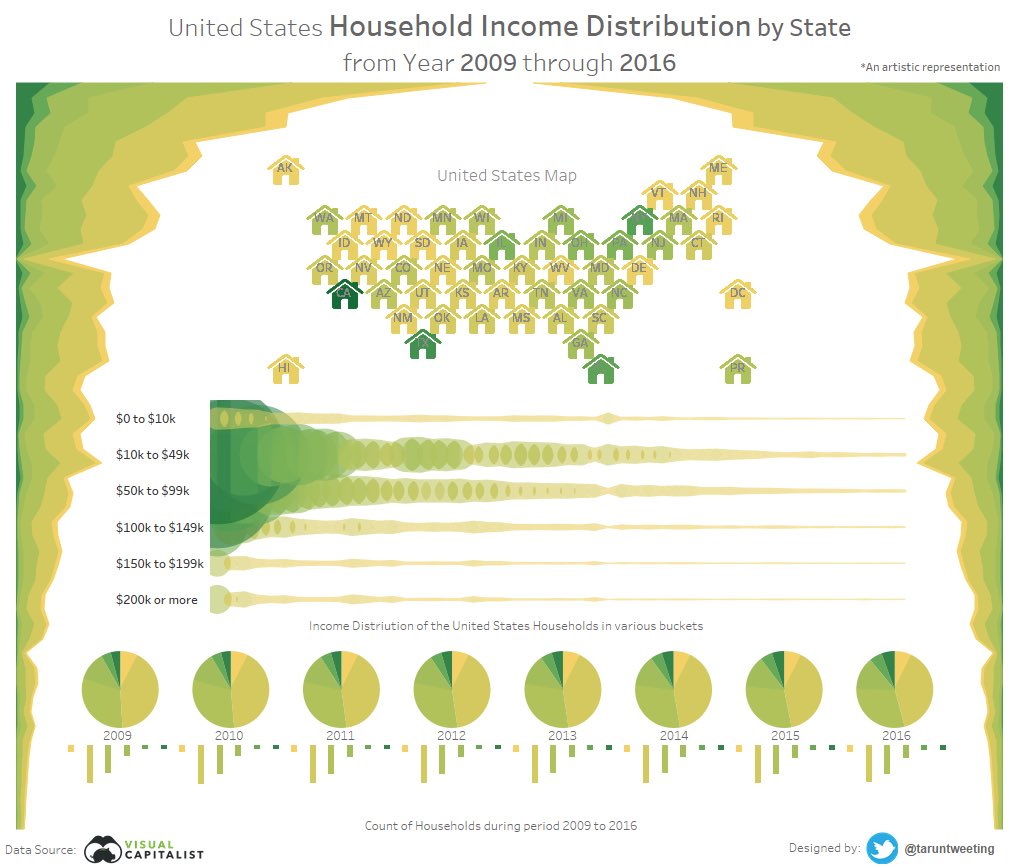
#MakeoverMonday Wk 1 U.S. Consumption of Poultry & Livestock goo.gl/1Q1TuN @VizWizBI @TriMyData #10.5 #vizintooltip
Weirdly can't leave it alone - I love the dynamic scorecard style nature of it. #vizintooltip #tableau
#TinyTableauTip - In tableau 2019.2,you can View entire data by clicking on Axis . What is Really like , the same feature is available on #vizIntooltip as well. Spoiler Alert: Created a dynamic Waffle Chart by using X and Y Calc in @tableau . Blogpost will be out tomorrow.
I love you @tableau and I'm going to let you finish, but it took you ten and a half versions to implement #VizinTooltip while Semiotic had it back in 0.7.3.
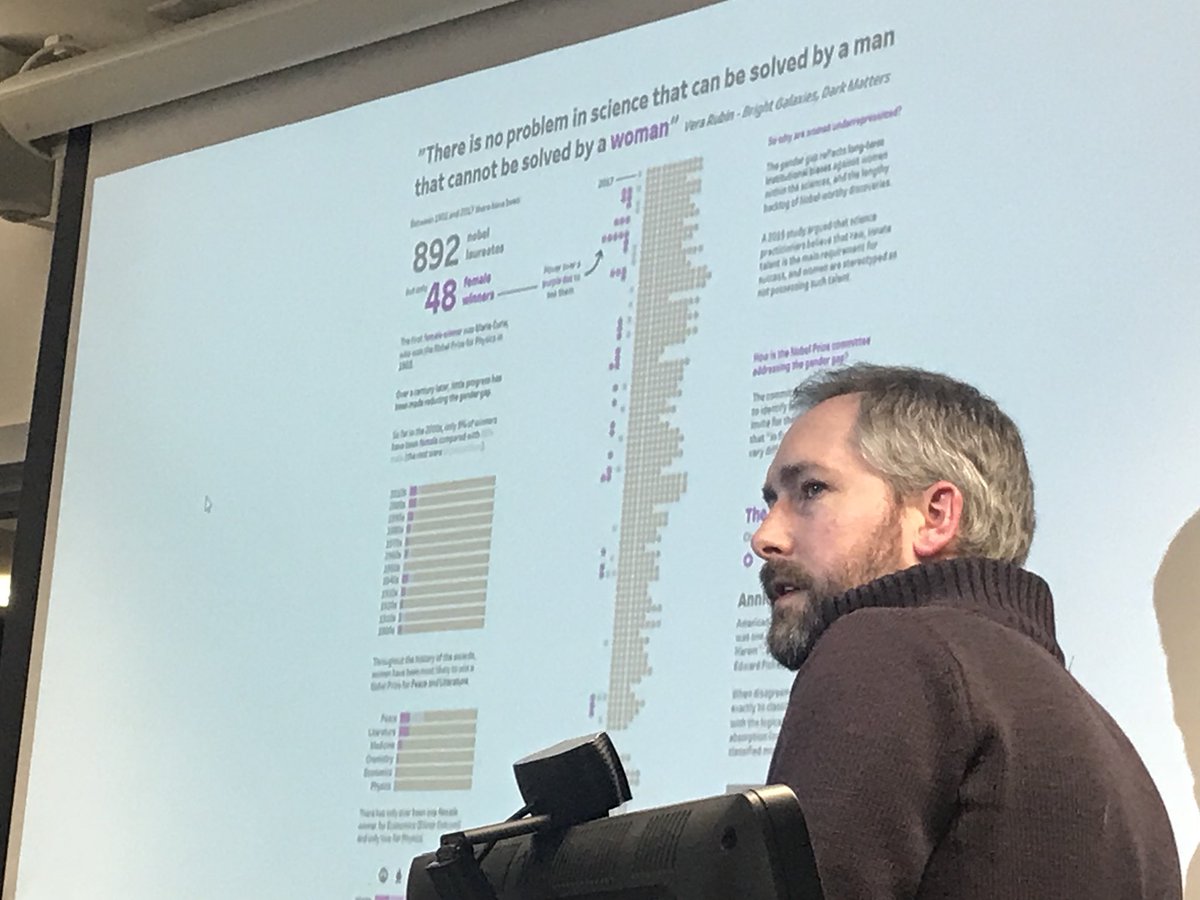
Loving hearing @data_ink thought process for his #midlandstug data viz challenge submission,such an impressive story telling viz and definitely worth checking out his #vizintooltip for female winners 👏
Something went wrong.
Something went wrong.
United States Trends
- 1. #StrangerThings5 243K posts
- 2. Thanksgiving 671K posts
- 3. BYERS 55K posts
- 4. robin 90.6K posts
- 5. Reed Sheppard 5,750 posts
- 6. Afghan 285K posts
- 7. Podz 4,402 posts
- 8. holly 63.7K posts
- 9. Dustin 89.2K posts
- 10. Vecna 57.7K posts
- 11. National Guard 659K posts
- 12. Jonathan 74.4K posts
- 13. hopper 15.7K posts
- 14. Lucas 82.6K posts
- 15. Gonzaga 8,480 posts
- 16. Erica 17.1K posts
- 17. Nancy 67.6K posts
- 18. Tini 9,405 posts
- 19. noah schnapp 8,848 posts
- 20. Joyce 31.4K posts