#informationdesign search results

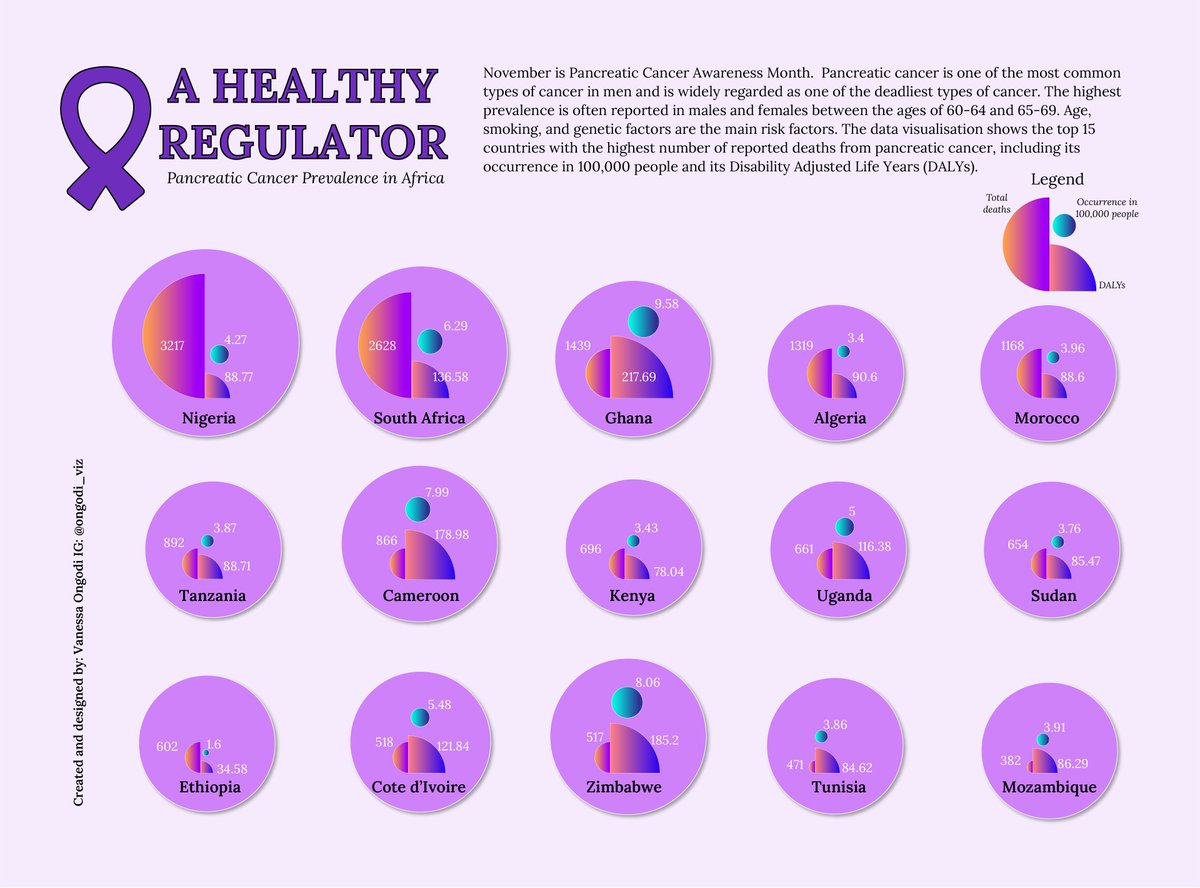
November is pancreatic cancer awareness month and the sex at risk of pancreatic cancer are males between the ages of 60 - 69. This data visualisation shows the top 15 African countries with highest reported deaths from pancreatic cancer. #dataviz #informationdesign


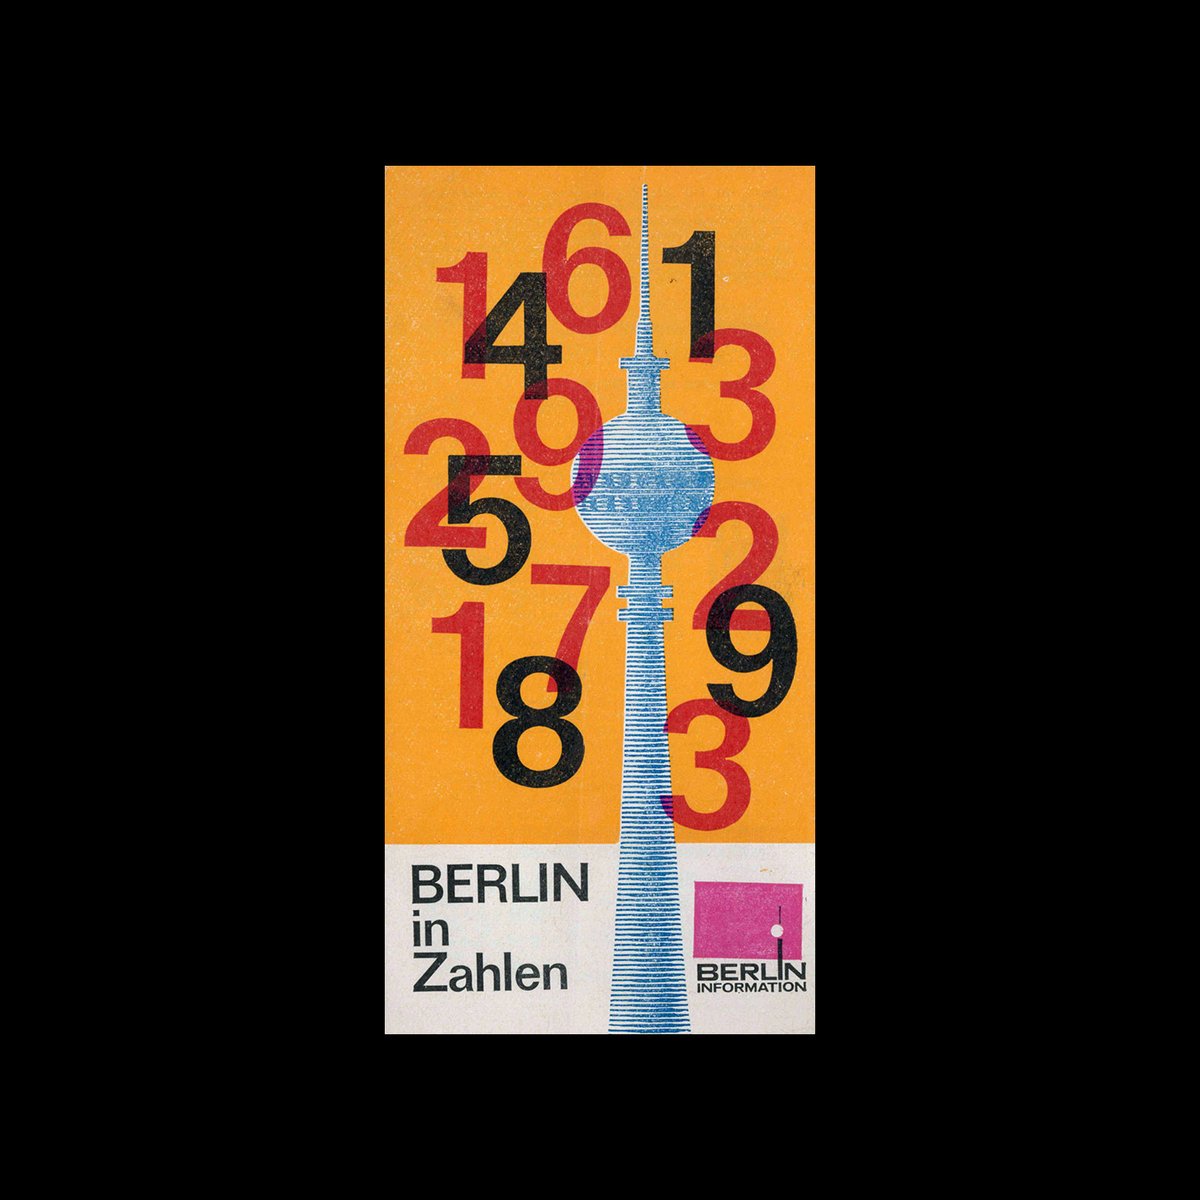
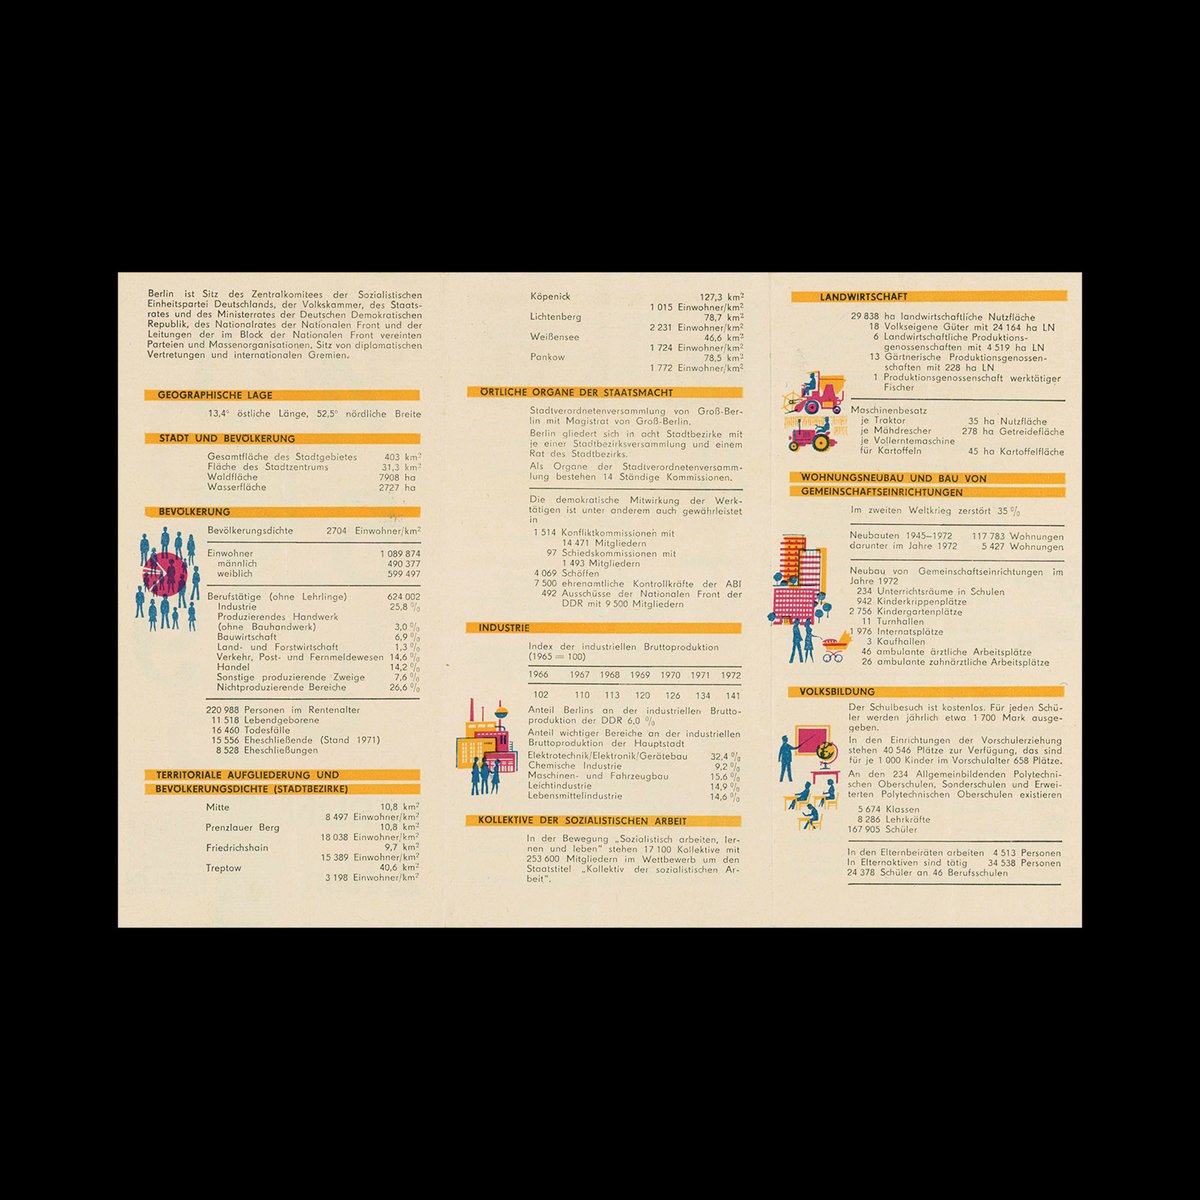
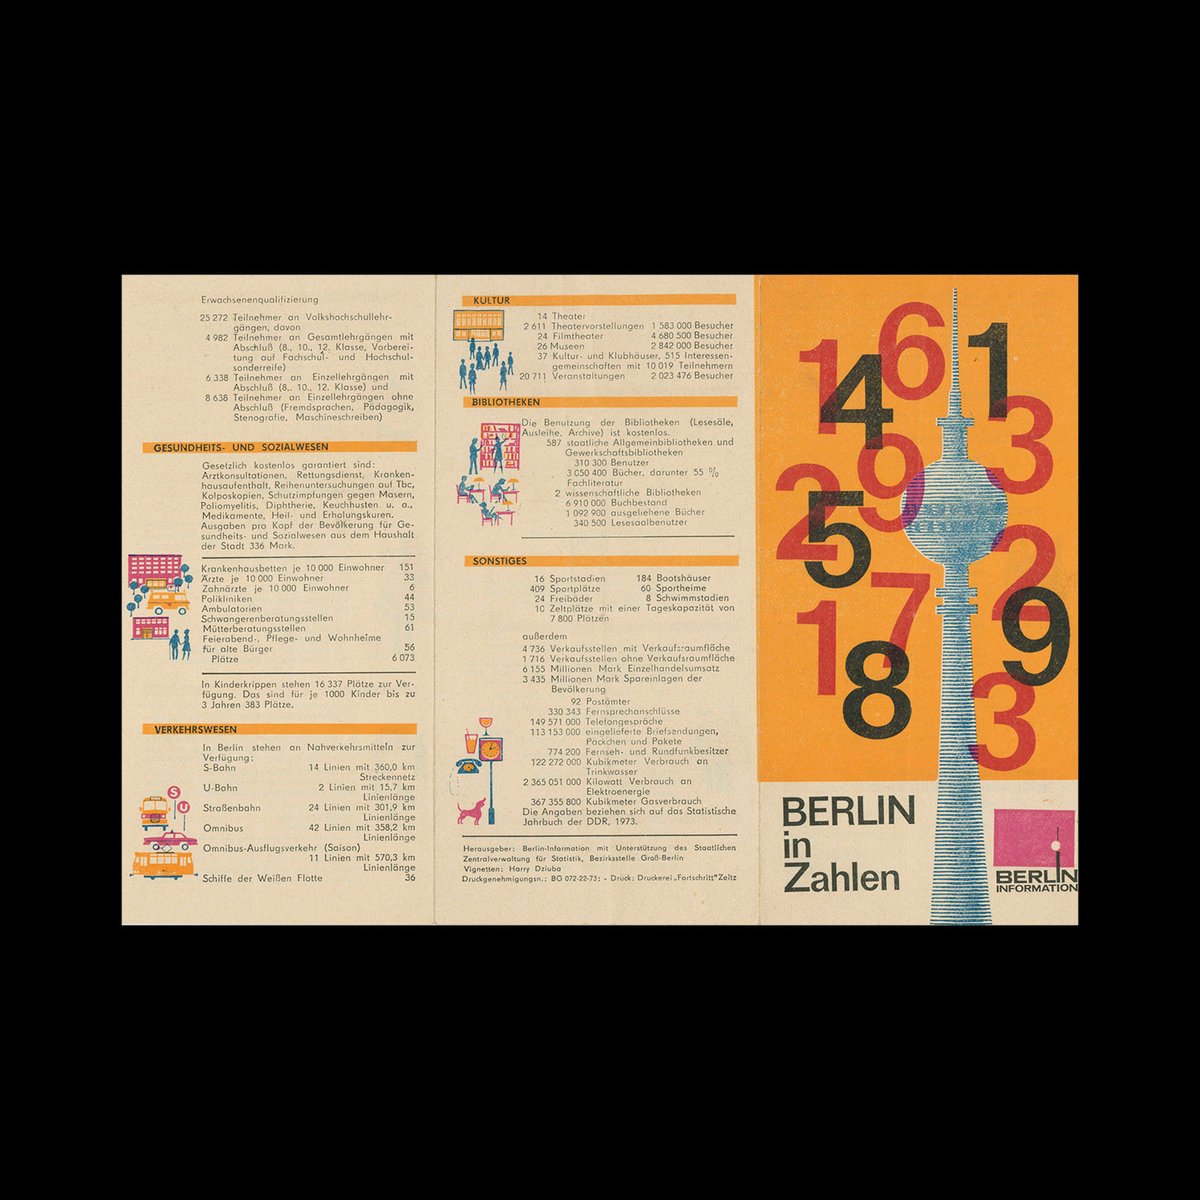
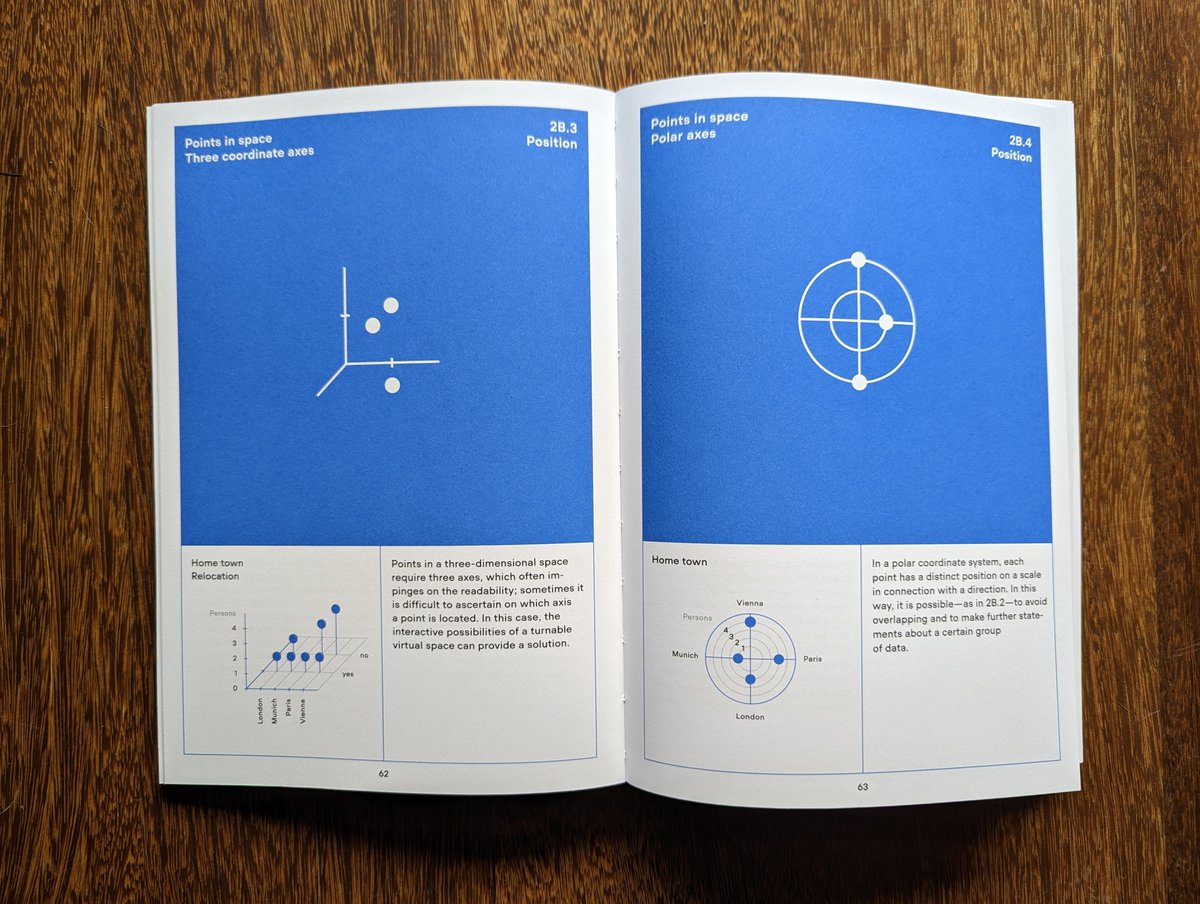
Berlin in Numbers, Berlin-Information Brochure, 1973 designreviewed.com/artefacts/berl… #germandesign #statistics #informationdesign

📈 Weekend Project: Experimenting with Data Viz and d3.js How does Gen Z communicate in the digital era? This interactive visualization captures the most frequently used slangs and emojis that define their language. 🚀 #InformationDesign #GenZTrends

Thanks @DarjanHil for sending a copy of the book "Visualizing Complexity – Modular Information Design Handbook". The book is a tremendous effort. Well done 👏👏👏 #dataviz #datavisualization #informationdesign #visualizingcomplexity #design #infographics #UX #designsystem


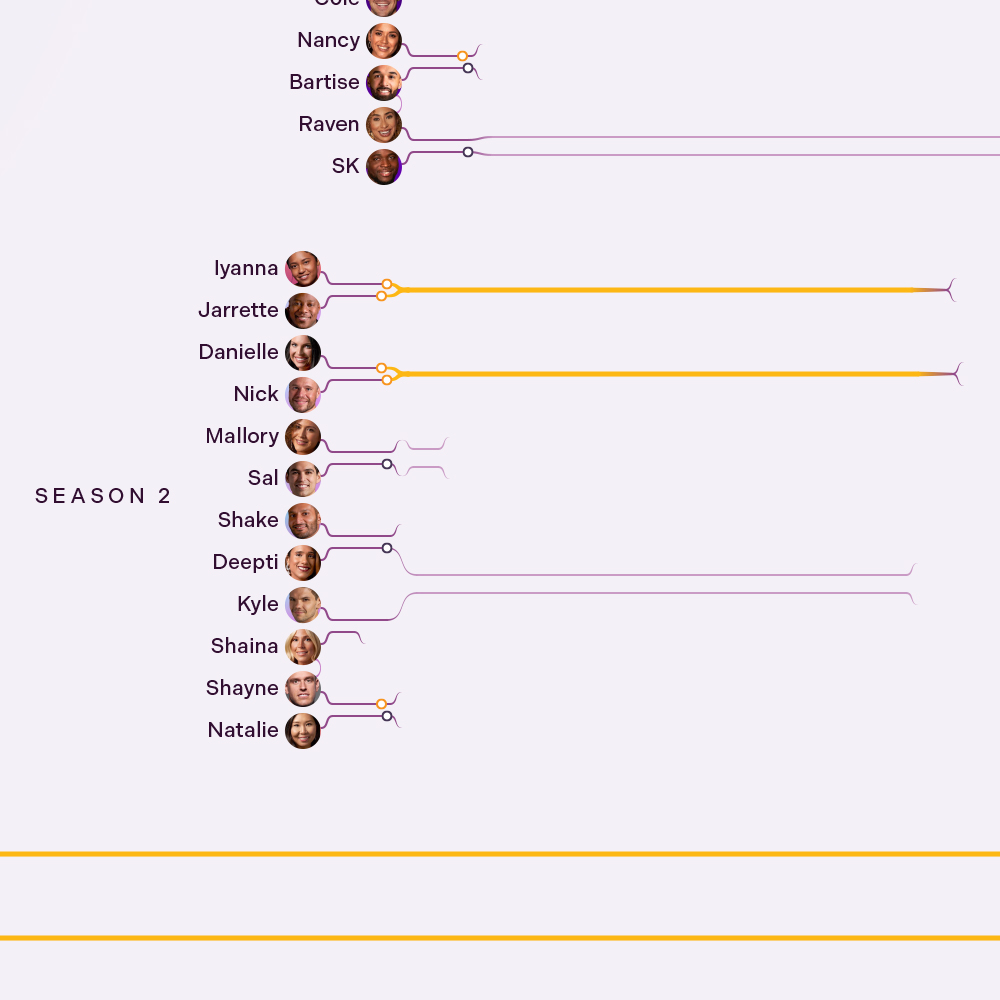
SPOILER ALERT I'm a Love Is Blind @LoveisBlindShow fan and I had some spare time, so why not? See full size here: denizcemonduygu.com/portfolio/love… #LoveIsBlind #LoveIsBlindReunion #informationdesign #datavisualization


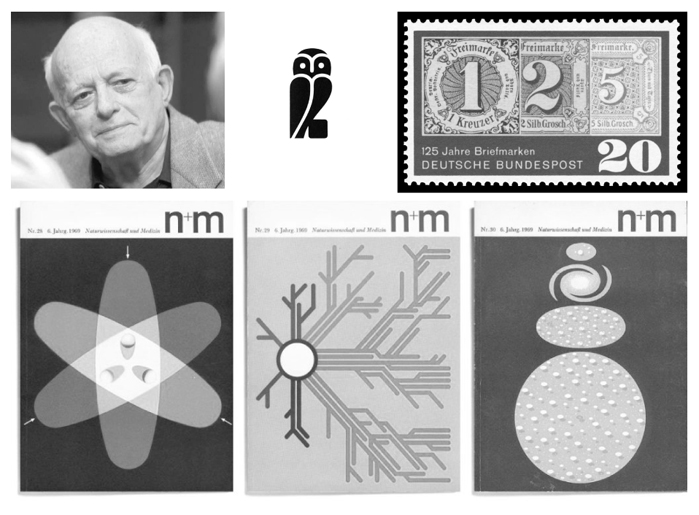
Happy birthday Erwin Poell. The prolific graphic, type & book designer, famous for postage stamp & book designs as well as information design for scientific journals, was born today in 1930. #informationdesign

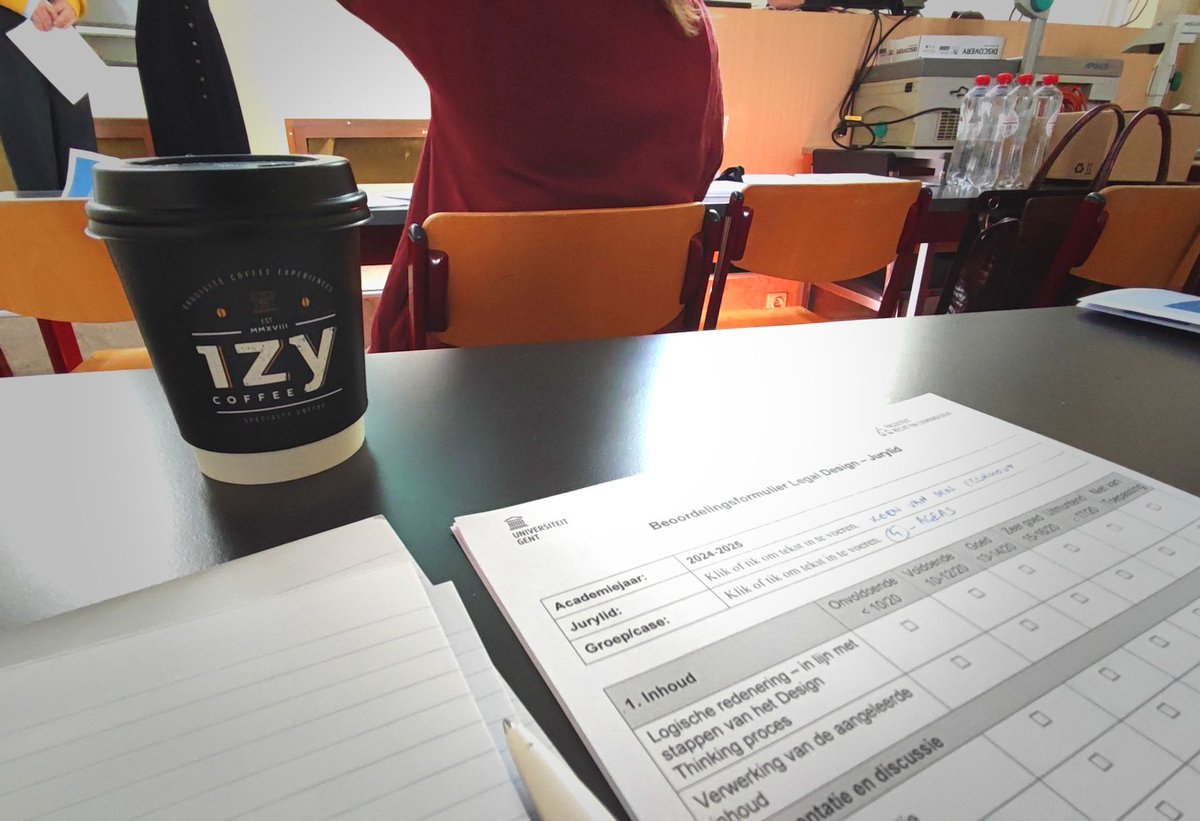
⚖️ One of my favorite days of the year is when I can evaluate the Legal Design projects of law students @ugent. 🏆 After teaching the principles of #informationdesign, and providing feedback, it's rewarding to see them proudly show their work to the jury. 1/3
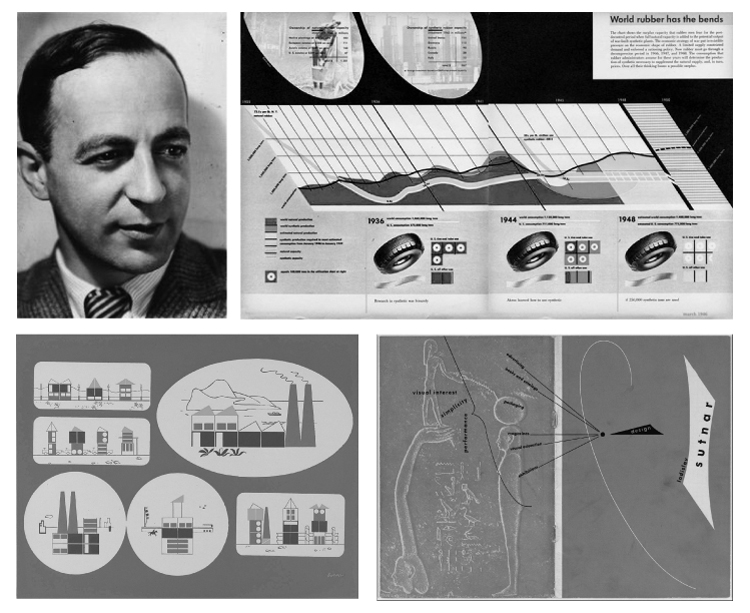
Happy birthday Ladislav Sutnar. The award-winning graphic designer, famous for his pioneering information design work as well as numerous books including Controlled Visual Flow & Visual Design in Action, was born today in 1897. #informationdesign #graphicdesign
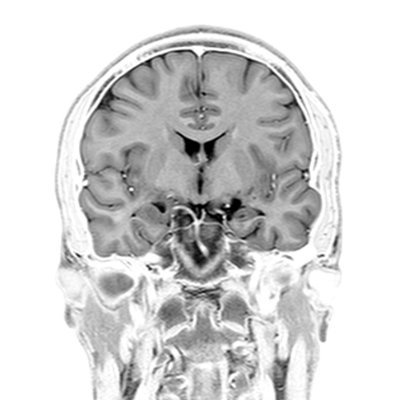
New paper for which I did information design. Congrats to Işık Arel, Ayşe Ay, @ahugumrah, @matist_ozge. #scientificillustration #informationdesign


Another great collaborative work with @matist_ozge. pubs.acs.org/doi/10.1021/ac… The mighty C-dots can help the growth of crops. Is there a practical, cost-efficient, and sustainable method to devise a controlled release system to use in agricultural scales? Let's find out 👀

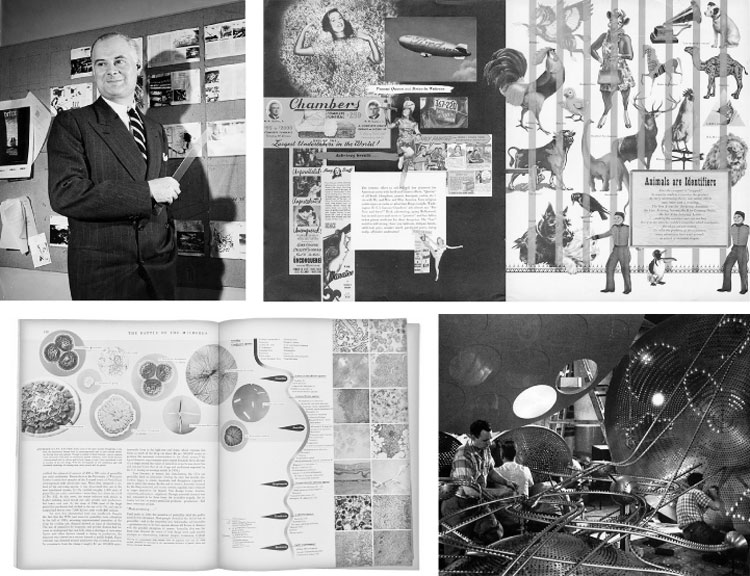
Happy birthday Will Burtin. The graphic designer, educator & exhibit designer, famous for adeptly explaining science concepts through design, was born today in 1908. #graphicdesign #informationdesign bit.ly/20Cttg3
🪨 VISUAL HIERARCHY: a fundamental principle in #informationdesign 😰 If you're dealing with a lot of information in a single visual - maybe you're making an #infographic, writing a report, or building a #dashboard - your guiding principle should be visual hierarchy. (1/4)


A list of Romanian inventors from the 19th and 20th centuries. #datavisualization #informationdesign #datadesign


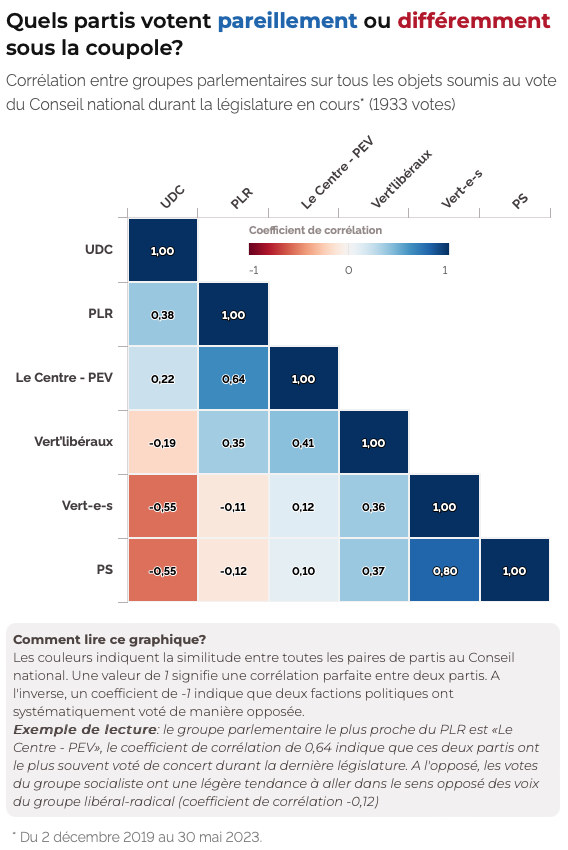
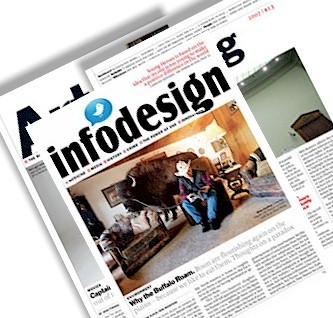
Et dans le journal, première matrice de corrélation en p.3 @LeTemps 🤓. Je n'ai même pas eu besoin d'insister #dataviz #DataVisualization #informationdesign #print #infographic

Le @PLR_Suisse est bien plus proche du #Centre que de l'@UDCch selon notre analyse de tous les votes du Conseil national. Tous les détails des thèmes qui divisent ou rassemblent les partis 👇🏼 letemps.ch/suisse/qui-vot… #EF2023 #politique #Suisse #dataviz #ddj @VinNicolet
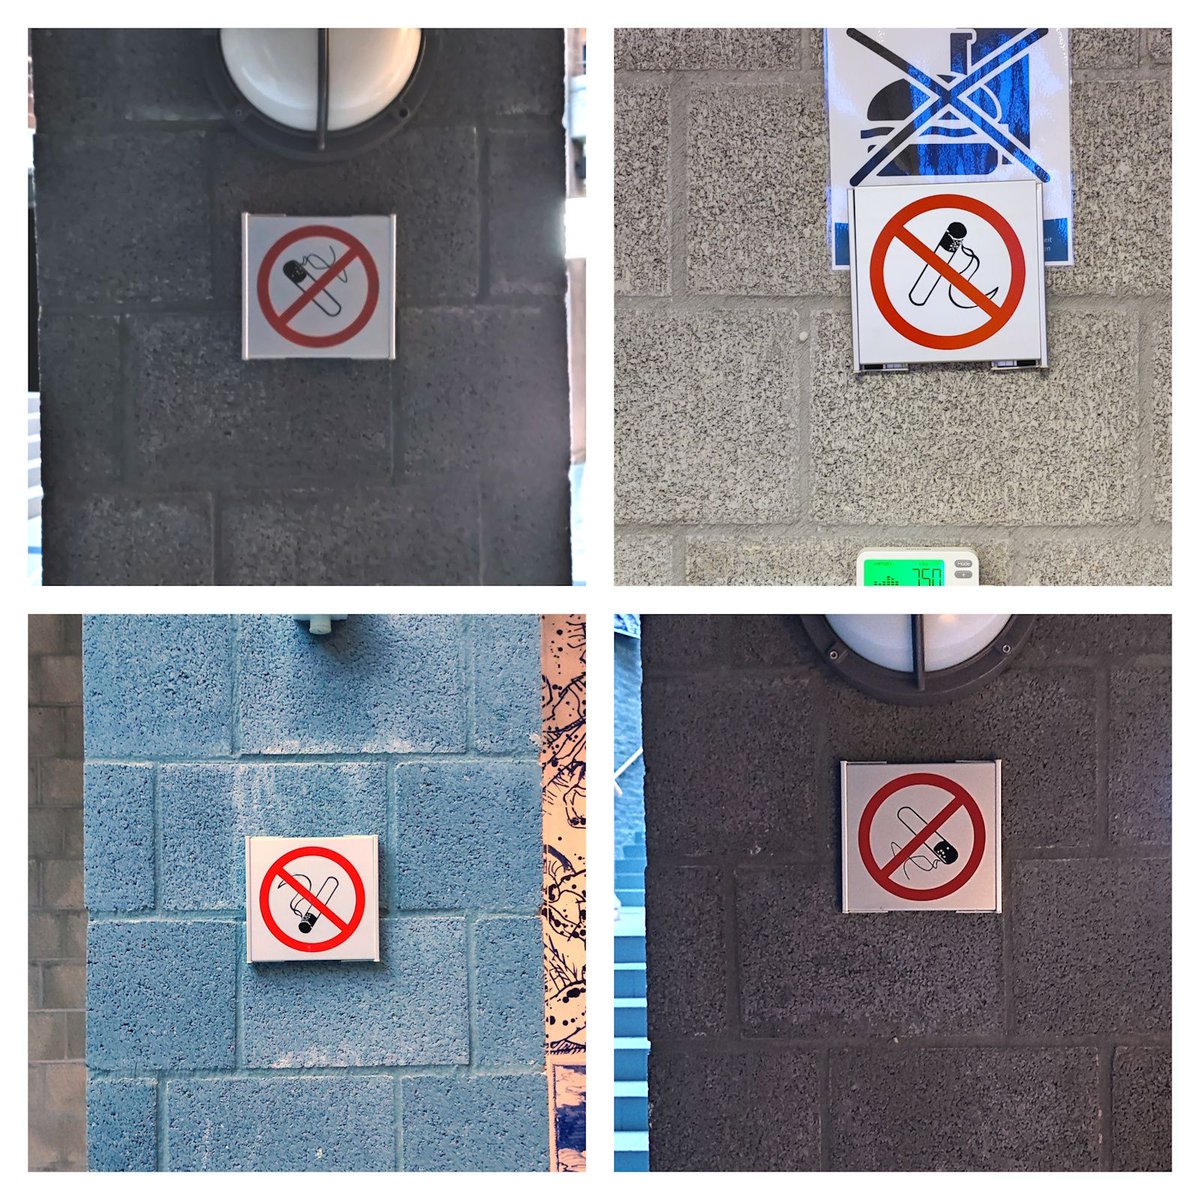
🐊 Back from my family trip with lots of great memories, and some nice examples of #informationdesign. I mean, look at this stunning map of the Everglades! What a feast for the eyes 😍

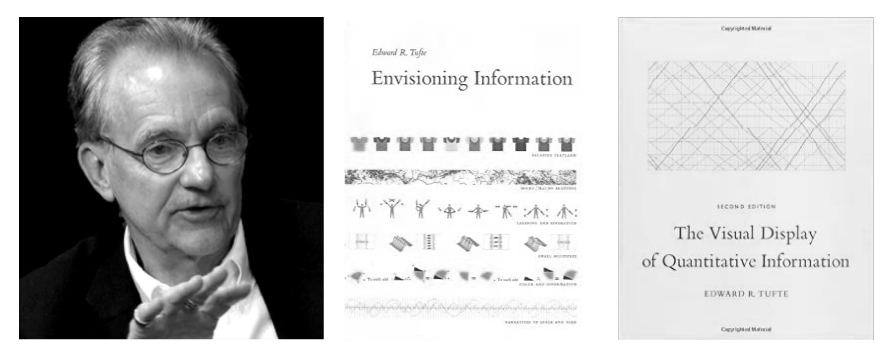
Happy birthday Edward R. Tufte. The influential & award-winning statistician, political scientist, author & educator, known as a primary authority on information design & data visualization, was born today in 1942. #informationdesign edwardtufte.com

Information Design, Inc. is organized as one of the Most Promising IBM Solutions Providers by CIOReview. Read More: bit.ly/3pLLS2R #ibm #ibmmq #informationdesign #infrastructure #marketing #technology #design


Curious to find out how we approach information design? This blog dives into our process and thinking 👇 designbysoapbox.com/inside-our-inf… #informationdesign #dataviz #wonkcomms
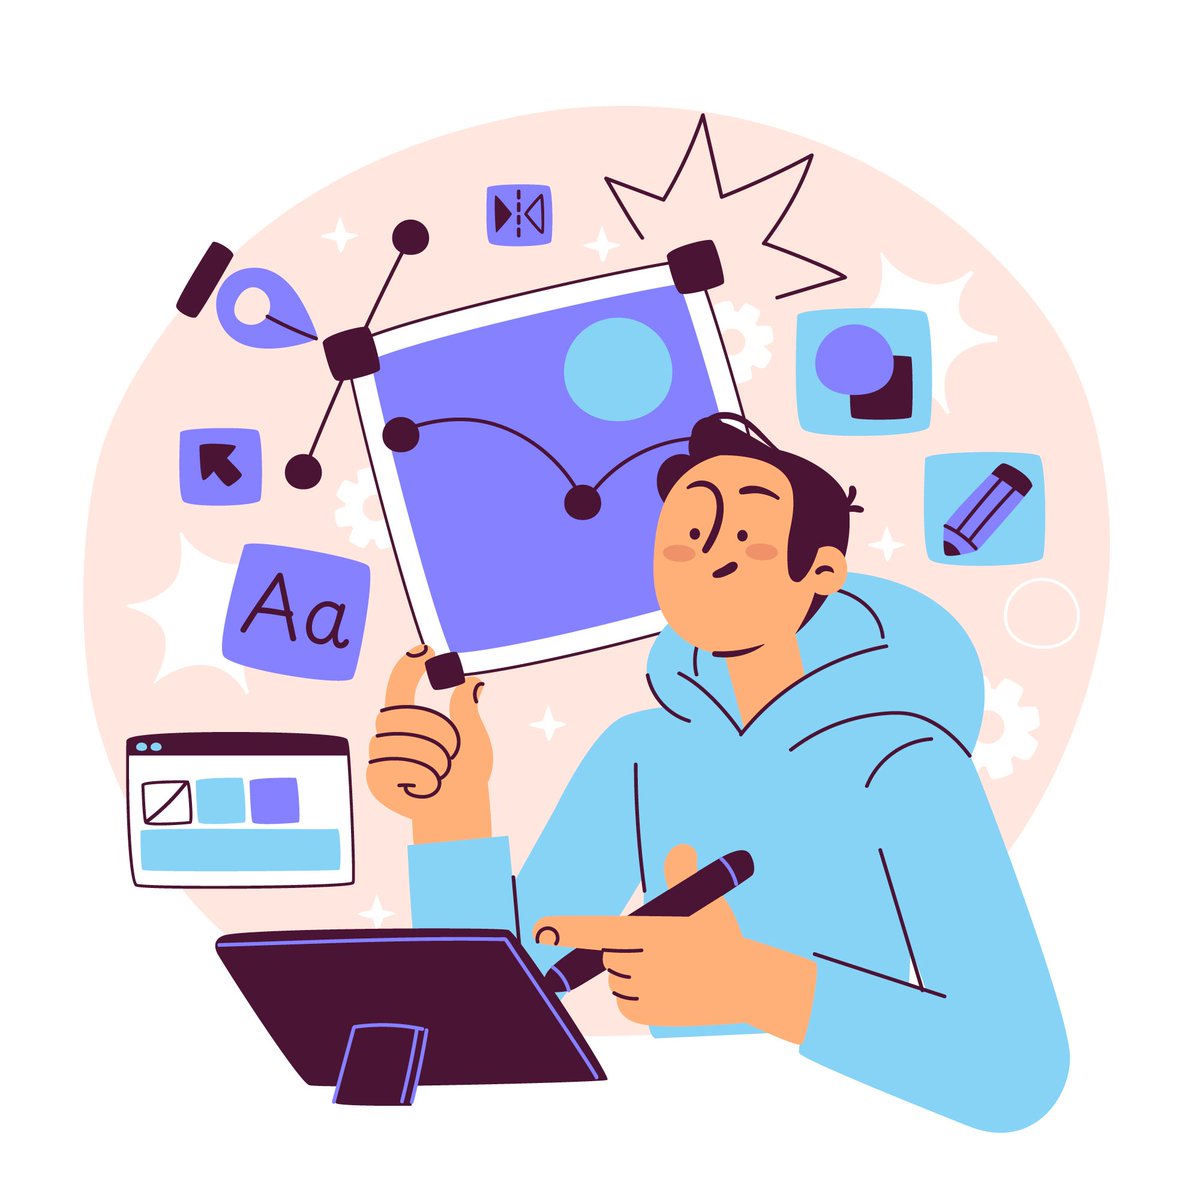
I love vector images. But not for the obvious reasons. The obvious benefits are well known: ✅ they're infinitely scalable without worries about the resolution ✅ they're easy and fast to edit 1/4 #informationdesign
Clear structure = better understanding. Denise Marshall, one of our Senior Technical Authors, explains how principles of information architecture can make your documentation more user-friendly and effective. Read more at hubs.la/Q03N3rt-0 #informationdesign #uxwriting

Happy birthday Ladislav Sutnar. The award-winning graphic designer, famous for his pioneering information design work as well as numerous books, including Controlled Visual Flow & Visual Design in Action, was born today in 1897. #informationdesign #graphicdesign

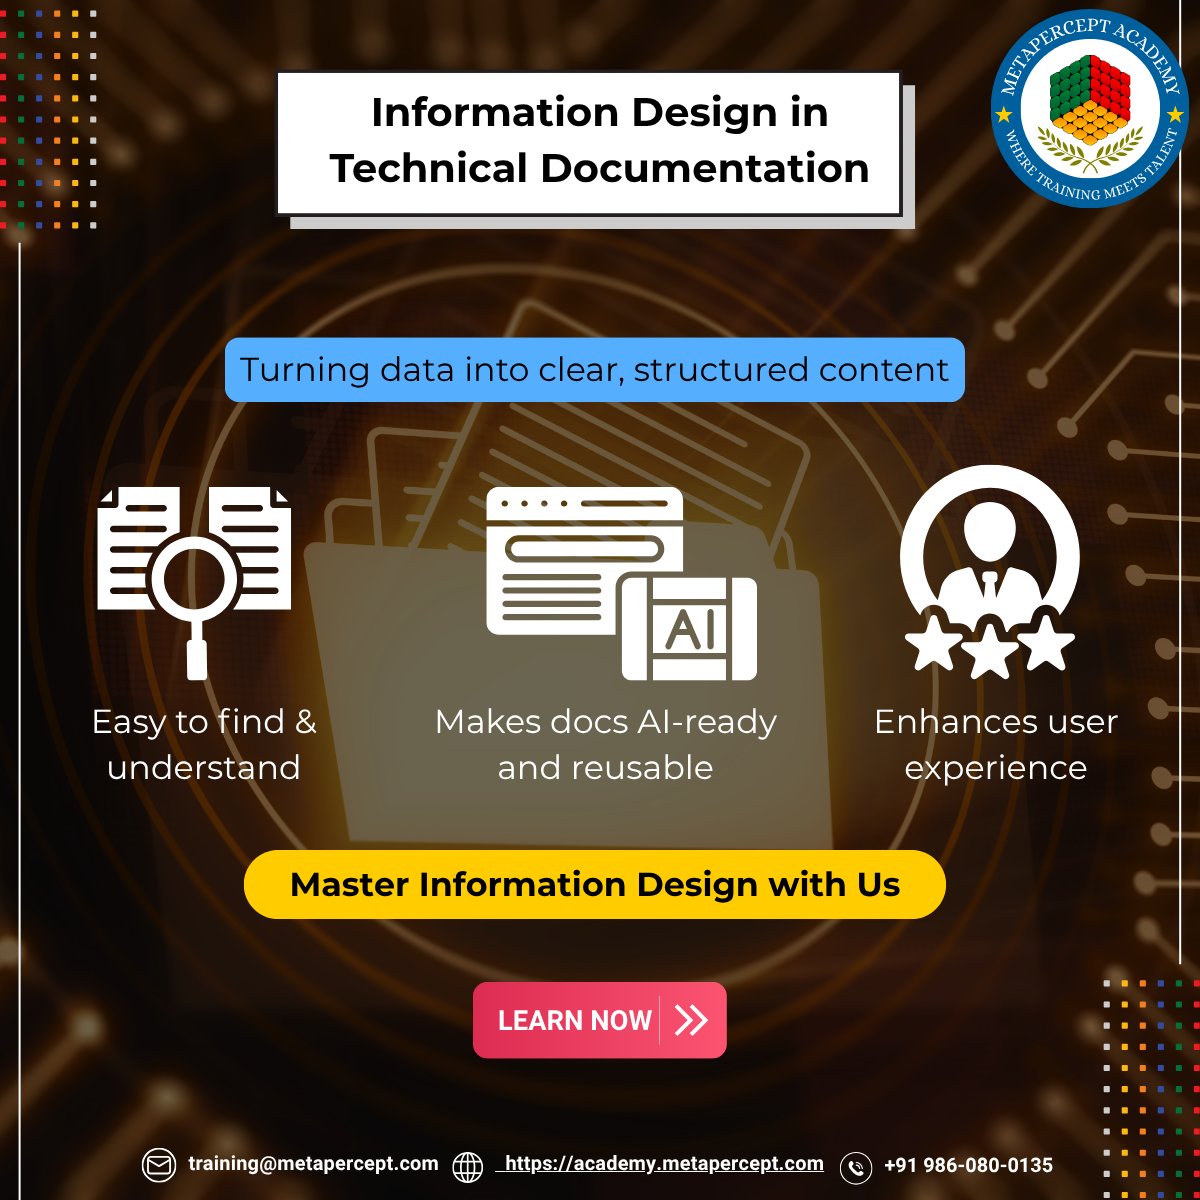
🧠 Great docs aren’t written, they’re designed. Learn to turn complex info into clear, structured, and AI-ready content. 📚 Master Information Design with Metapercept Academy. 🔗 training.metapercept.com #InformationDesign #TechnicalWriting #ContentDesign

The structured layout, with icons and distinct colors, simplifies understanding complex financial products. Easy to scan and digest, it boosts reader confidence 📊💡 #financialliteracy #informationdesign

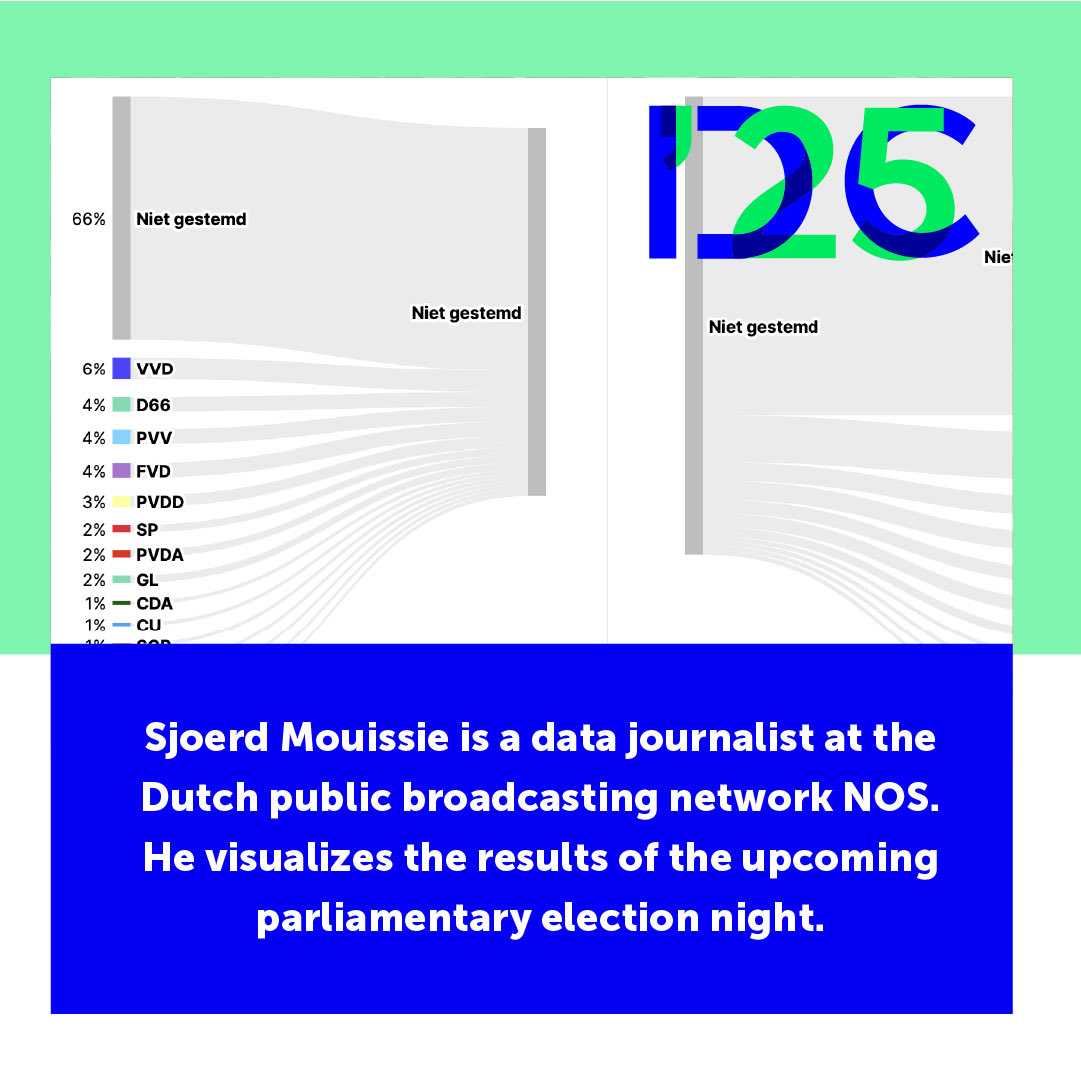
Up next is Sjoerd Mouissie Data Journalism & Visualizations at NOS Fresh from the elections, Sjoerd will show how data visualizations make complex news clear and engaging. 📰 📅 Oct 31, 2025 📍 Gooiland Theater, Hilversum 🎟 informationdesigncon.eu #IDC25 #informationdesign


A good dashboard doesn’t display data, it tells a story. Context > Quantity. #DataViz #InformationDesign #UIUX #Analytics
Data Visualization Nuance: When charting, only highlight the data point that directly supports the narrative you want to communicate. Grey out the noise. Data clarity is about aggressive editing, not exhaustive inclusion. #DataViz #InformationDesign #DesignClarity
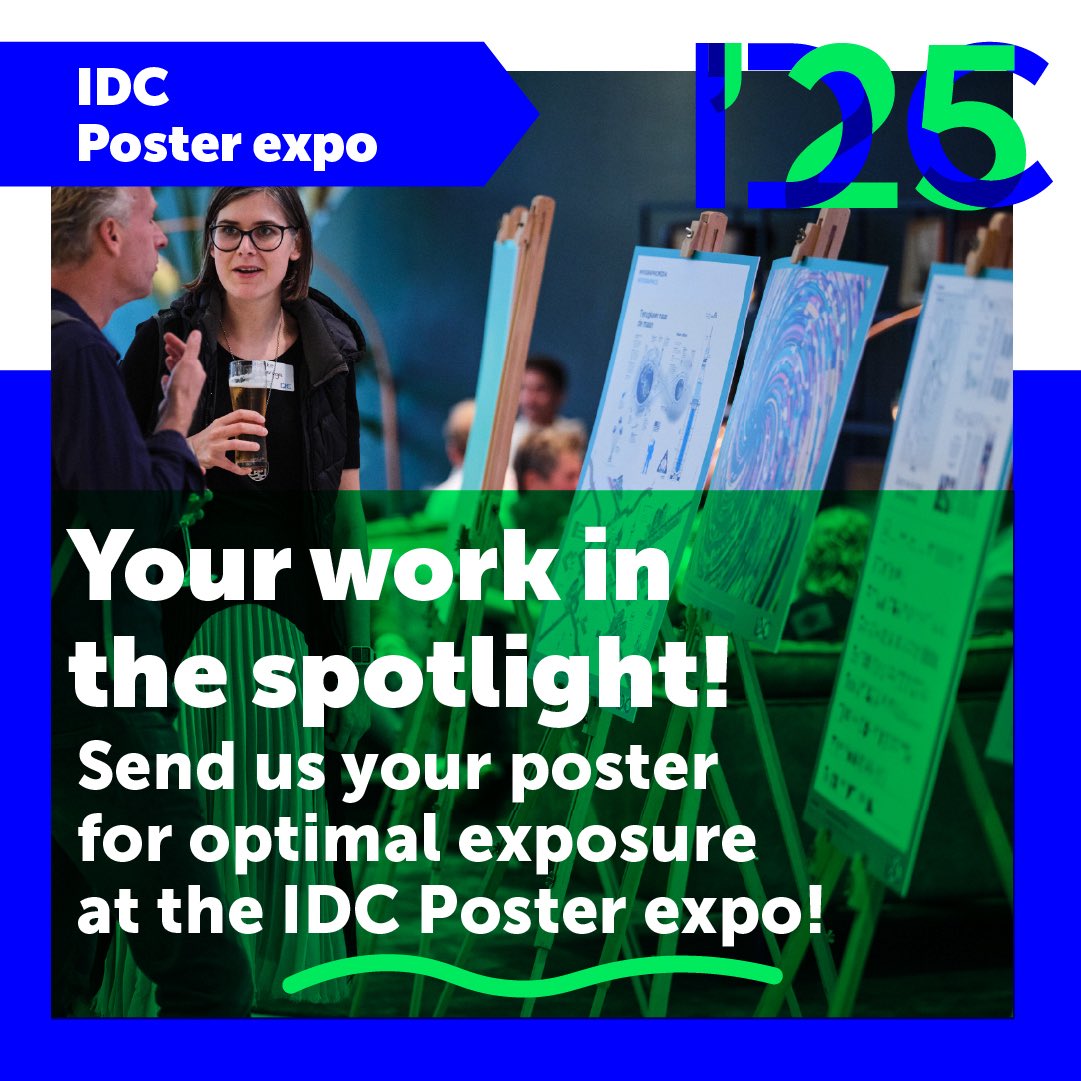
📣 Call for posters! Show your work at IDC25. Open to all ticket holders Deadline: Oct 15, 2025 Posters, interactive, or animated work welcome 🎟️ Info & submit → informationdesigncon.eu/exhibition-2025 #IDC25 #informationdesign #conference #poster

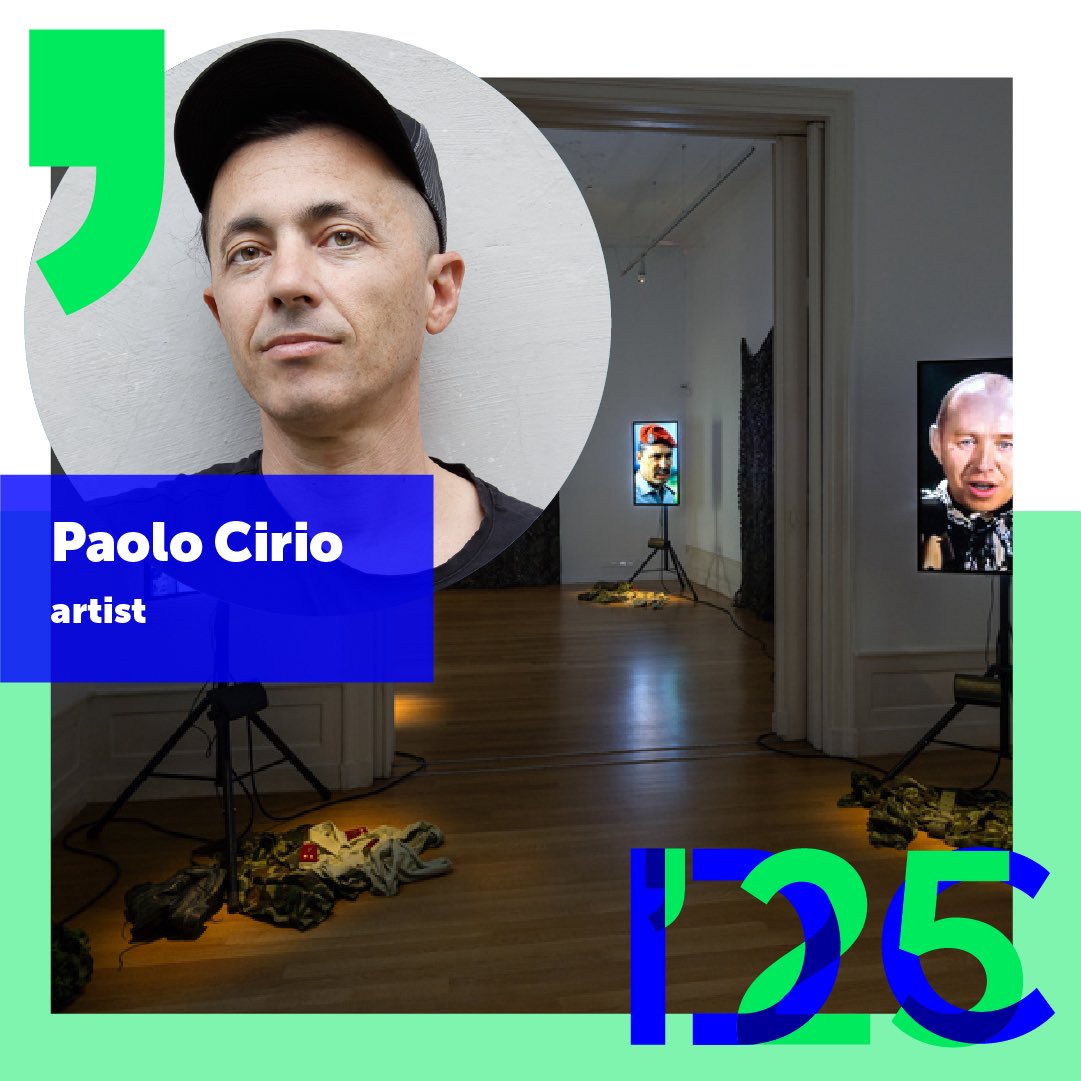
Up next: Paolo Cirio Artist & activist Exploring the power of data, surveillance & design through art and activism. 🌍 📅 Oct 31, 2025 📍 Gooiland Theater, Hilversum 🎟 informationdesigncon.eu #IDC25 #informationdesign #conference #speakers

Introducing Edwin Gardner — futurologist & designer at Studio Monnik. At #IDC25 he’ll show how imagination, history & design help us navigate the future. 💡 🗓️ Oct 31, 2025 📍 Gooiland Theater, Hilversum 🎟️ informationdesigncon.eu #informationdesign #conference #futures


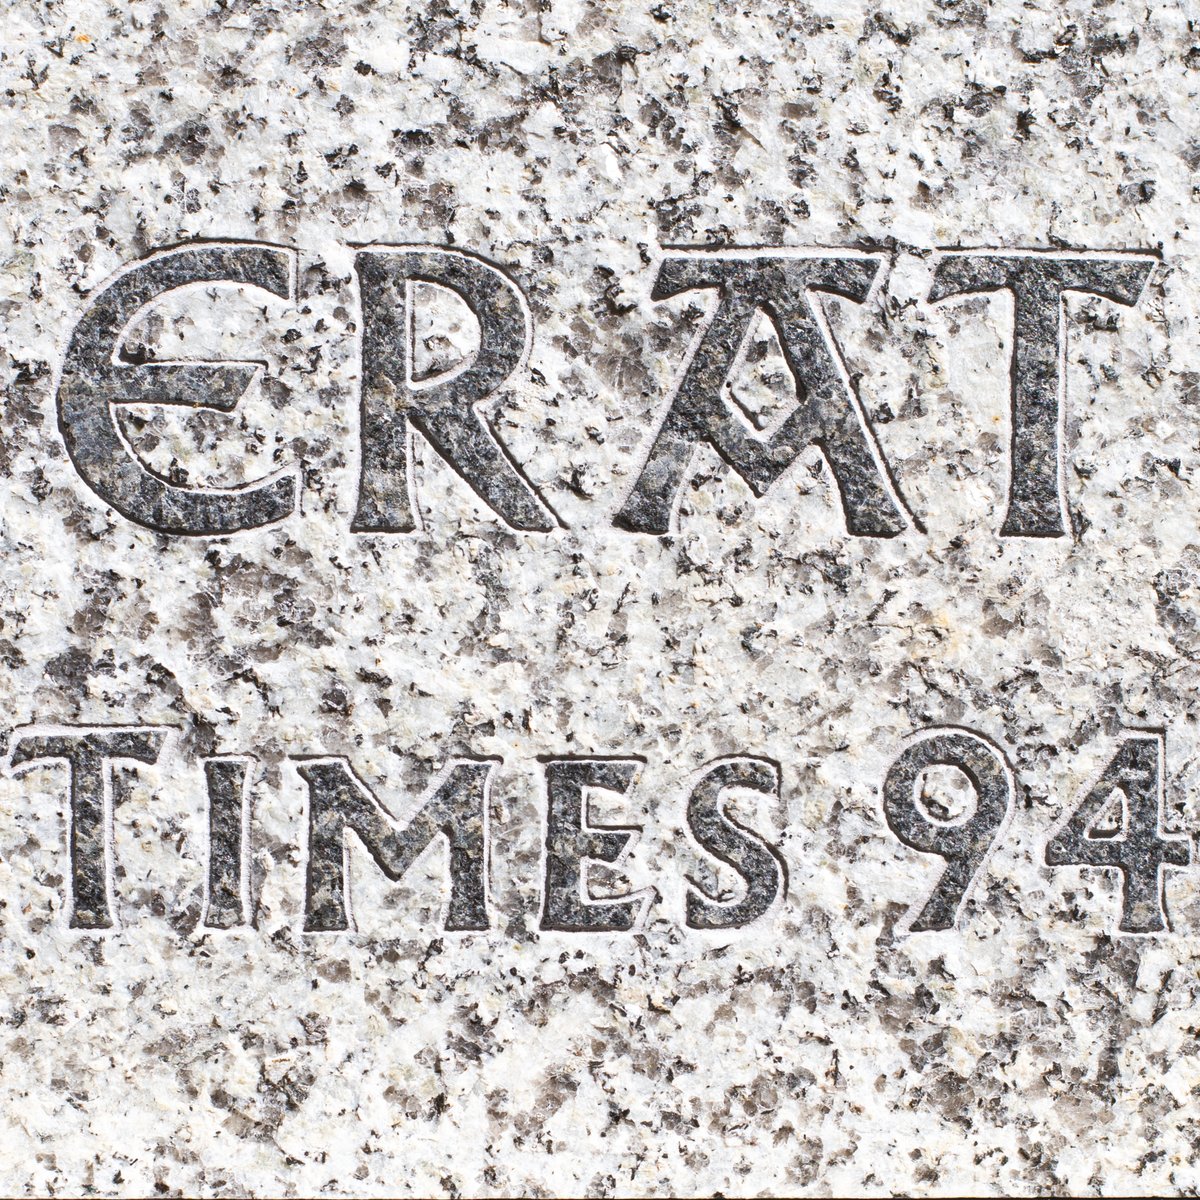
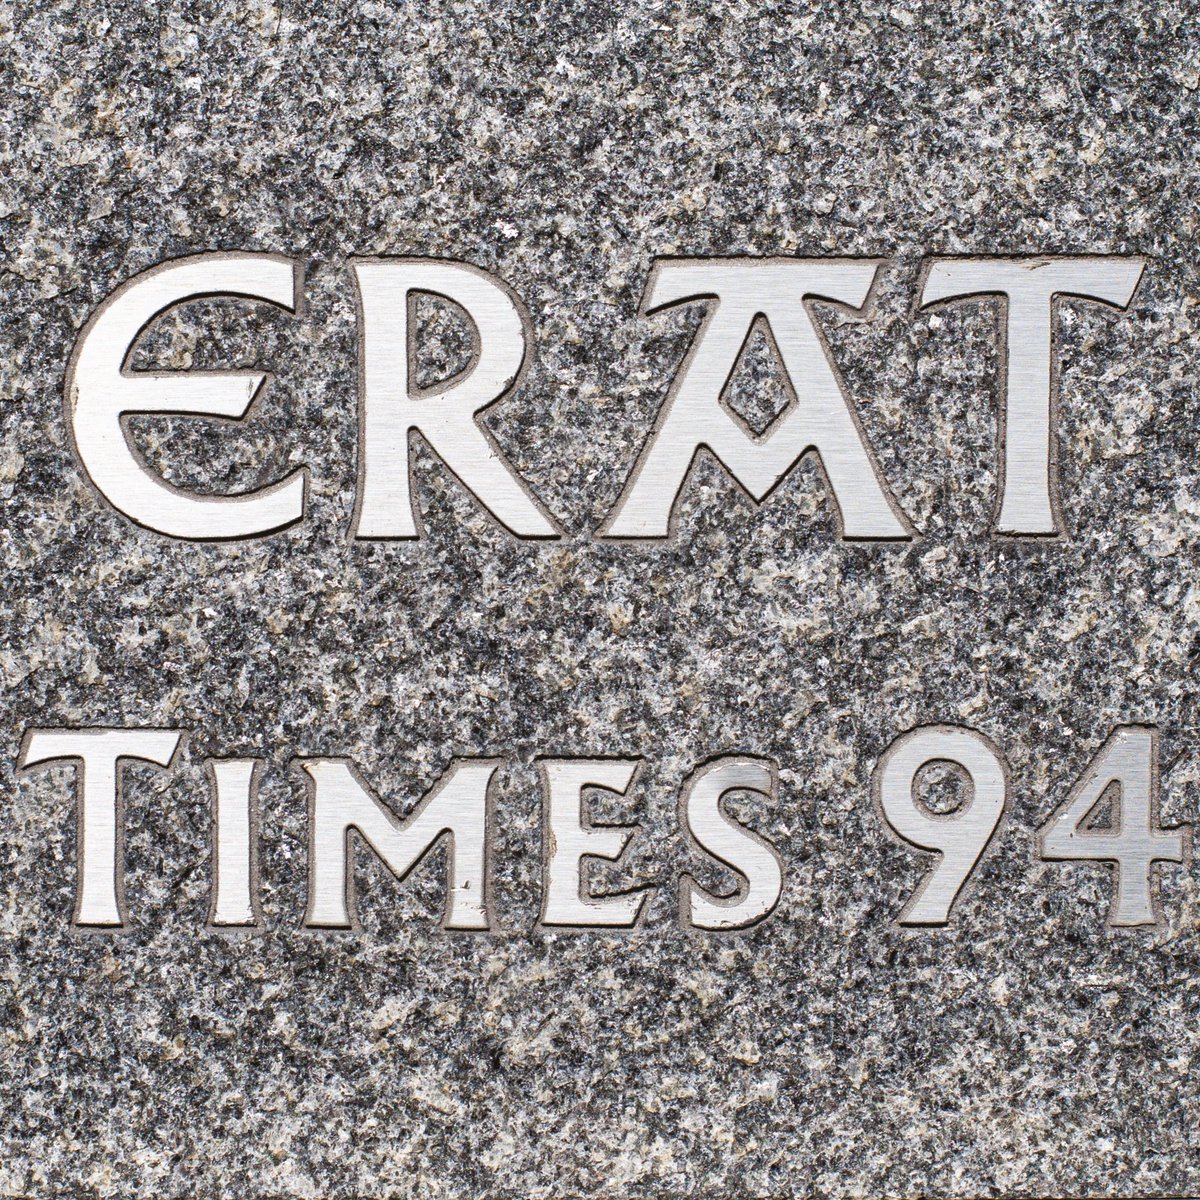
Work in progress; a scale presentation, a site test and some type tests in stone. This environmental graphics project replicates tombstones in a medieval church nave. Due to be completed in 2026. #publicrealm #placemaking #informationdesign #environmentalgraphics #Typography


A client was drowning in a 10-page escalation policy. Staff were confused, delays piled up. I redesigned it into a visual flowchart — clear steps, timelines, roles. Now? Faster resolutions ⚡, confident staff , and a guide everyone actually uses. #InformationDesign #UXDesign


IIIDawards 2026: 6th Edition!! Submissions open! 👀 👇🏾 #informationdesign iiidaward.net
🔥 Up next: Angela Morelli 🎤 Designer at InfoDesignLab, she creates the data visualizations for the IPCC climate change reports. 🌍📊 📅 31 October 2025 📍 Hilversum 🎟️ Tickets available here: lnkd.in/eCwTMvWe 🔗 #infocon2025 #informationdesign #conference #speakers


Berlin in Numbers, Berlin-Information Brochure, 1973 designreviewed.com/artefacts/berl… #germandesign #statistics #informationdesign
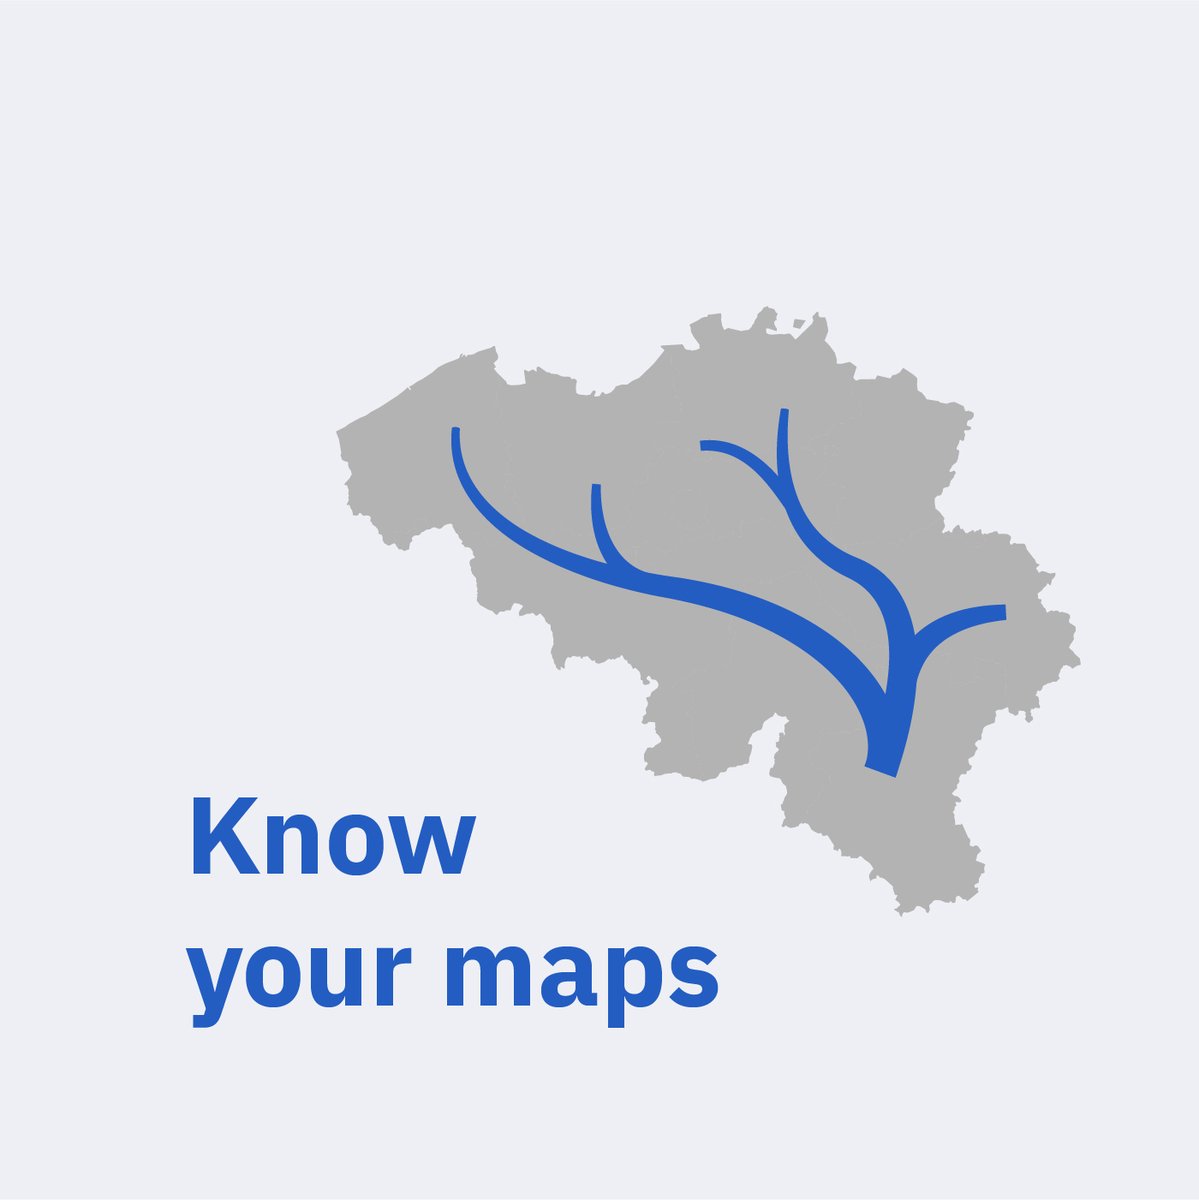
🗺️ Not all maps are the same! Here are 8 useful map types you could consider. (1/19) #informationdesign #dataviz #maps
November is pancreatic cancer awareness month and the sex at risk of pancreatic cancer are males between the ages of 60 - 69. This data visualisation shows the top 15 African countries with highest reported deaths from pancreatic cancer. #dataviz #informationdesign
Up next is Sjoerd Mouissie Data Journalism & Visualizations at NOS Fresh from the elections, Sjoerd will show how data visualizations make complex news clear and engaging. 📰 📅 Oct 31, 2025 📍 Gooiland Theater, Hilversum 🎟 informationdesigncon.eu #IDC25 #informationdesign
SPOILER ALERT I'm a Love Is Blind @LoveisBlindShow fan and I had some spare time, so why not? See full size here: denizcemonduygu.com/portfolio/love… #LoveIsBlind #LoveIsBlindReunion #informationdesign #datavisualization

We’ve been tinkering with numbers📊 colours 🎨 shapes 💠and words 🖊️ in our lab. This new year, join us as we unveil a new chapter in #InformationDesign 👀Stay tuned!

Happy birthday Will Burtin. The graphic designer, educator & exhibit designer, famous for adeptly explaining science concepts through design, was born today in 1908. #graphicdesign #informationdesign bit.ly/20Cttg3

Join us for an extraordinary information session themed “Beyond Pie Charts and Bar Graphs” led by Human Computer Interaction research Scholar, Mr. Suvodeep Misra from IIT Guwahati! 📊✨ #datavisualization #informationdesign #MITID #inspiration #innovations #MITADT #university

Happy birthday Ladislav Sutnar. The award-winning graphic designer, famous for his pioneering information design work as well as numerous books including Controlled Visual Flow & Visual Design in Action, was born today in 1897. #informationdesign #graphicdesign
Happy birthday Erwin Poell. The prolific graphic, type & book designer, famous for postage stamp & book designs as well as information design for scientific journals, was born today in 1930. #informationdesign
Happy birthday Edward R. Tufte. The influential & award-winning statistician, political scientist, author & educator, known as a primary authority on information design & data visualization, was born today in 1942. #informationdesign edwardtufte.com
New paper for which I did information design. Congrats to Işık Arel, Ayşe Ay, @ahugumrah, @matist_ozge. #scientificillustration #informationdesign
Another great collaborative work with @matist_ozge. pubs.acs.org/doi/10.1021/ac… The mighty C-dots can help the growth of crops. Is there a practical, cost-efficient, and sustainable method to devise a controlled release system to use in agricultural scales? Let's find out 👀

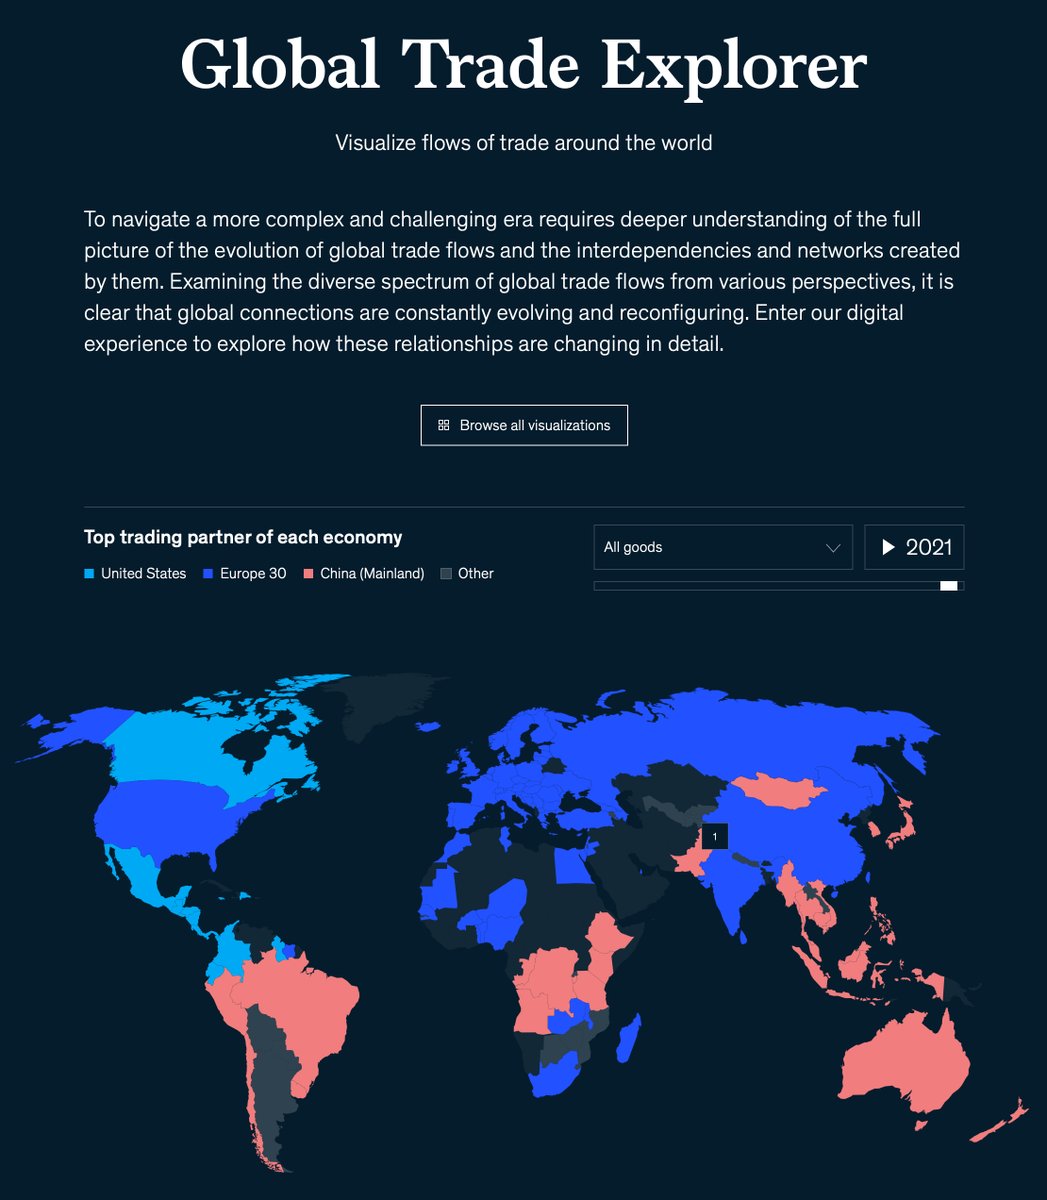
Who is the main trading partner for your industry or region? Find out on Global Trade Explorer, an immersive digital experience from the McKinsey Global Institute @McKinsey_MGI tinyurl.com/n83c5a9m #dataviz #informationdesign #trade

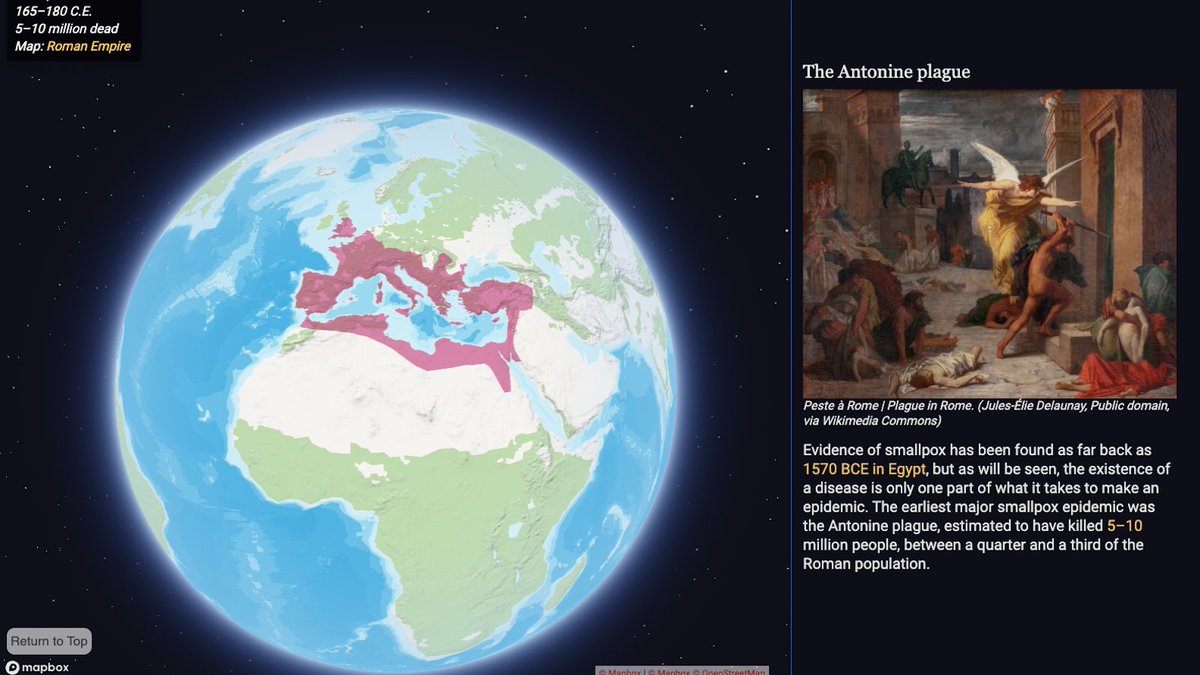
Interactive maps transform communication and education. Check how @BulletinAtomic uses a Mapbox GL JS storytelling map to tell readers about epidemics from ancient Rome to Covid-19: buff.ly/3D3qZDX #history #datastorytelling #informationdesign
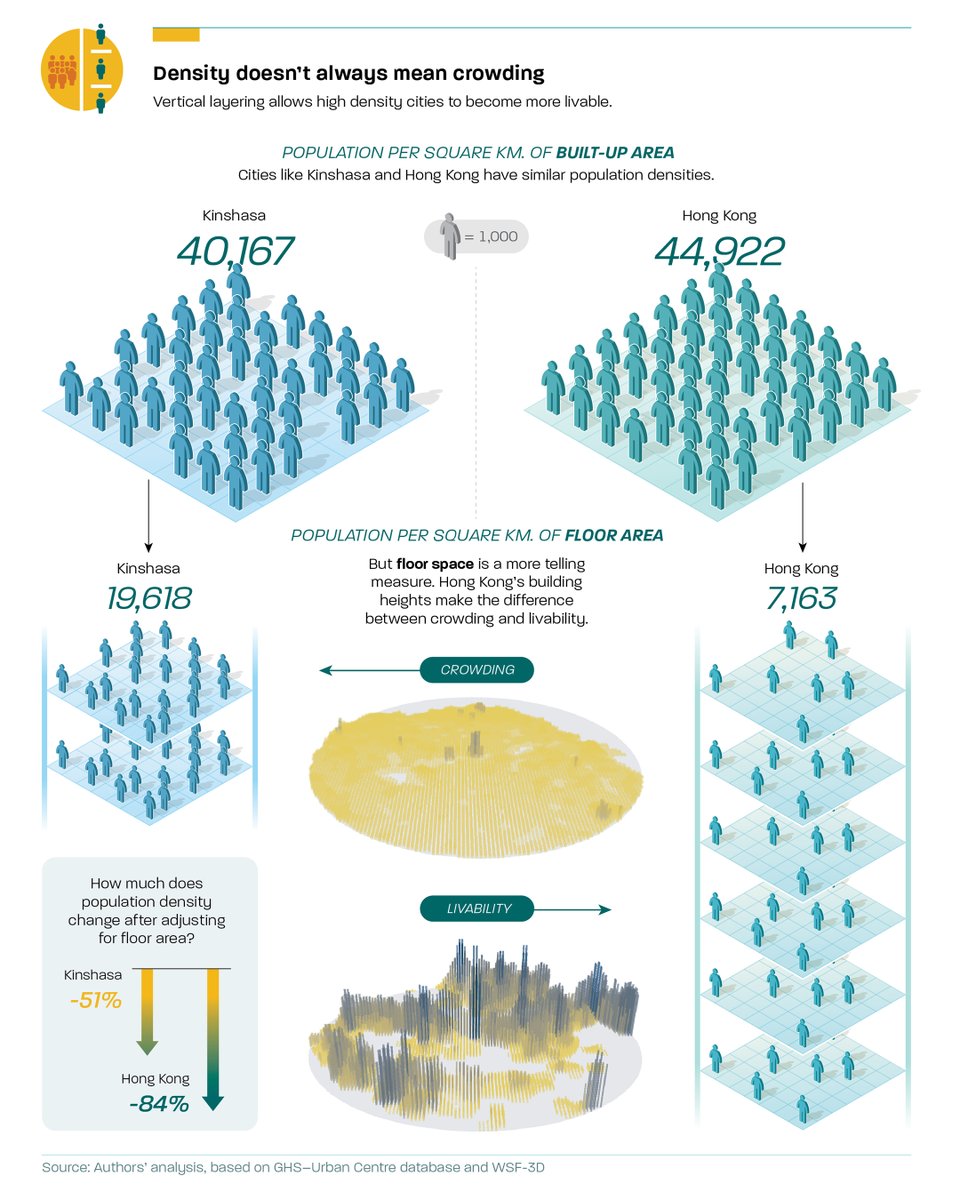
Urban form has implications for livability since density can mean different things – crowding or comfort – depending on floor space per inhabitant. Part of a series of graphics we did for a World Bank report (From Pancakes to Pyramids) #infographics #informationdesign #dataviz
A list of Romanian inventors from the 19th and 20th centuries. #datavisualization #informationdesign #datadesign
Thanks @DarjanHil for sending a copy of the book "Visualizing Complexity – Modular Information Design Handbook". The book is a tremendous effort. Well done 👏👏👏 #dataviz #datavisualization #informationdesign #visualizingcomplexity #design #infographics #UX #designsystem
Information Design, Inc. is organized as one of the Most Promising IBM Solutions Providers by CIOReview. Read More: bit.ly/3pLLS2R #ibm #ibmmq #informationdesign #infrastructure #marketing #technology #design

The World - A global overview with a British narrative. Hero/lead illustration for Cambridge English For Schools. @_debutart #informationdesign #informationillustration #illustratedmaps #mapillustration


Information Design Unbound took 6 years to develop. Writing, designing, and illustrating the book ourselves was a ton of work! Here's a glimpse into our own #informationdesign process: infodesignunbound.com/process/


Something went wrong.
Something went wrong.
United States Trends
- 1. Araujo 189K posts
- 2. Jalen Johnson 2,090 posts
- 3. Hazel 9,705 posts
- 4. Chelsea 659K posts
- 5. Barca 264K posts
- 6. Wizards 6,649 posts
- 7. Seton Hall 2,189 posts
- 8. Godzilla 27K posts
- 9. Estevao 273K posts
- 10. Barcelona 471K posts
- 11. Bishop Boswell N/A
- 12. Yamal 208K posts
- 13. Eric Morris 3,456 posts
- 14. Ferran 79.5K posts
- 15. Witkoff 69.2K posts
- 16. Leftover 6,922 posts
- 17. Oklahoma State 5,087 posts
- 18. House Party 7,296 posts
- 19. Skippy 5,622 posts
- 20. National Treasure 8,212 posts