#learndataanalysis arama sonuçları

GM My Data Analyst Top tools every beginner Data Analyst should know: ✅ Excel – for basics & quick analysis ✅ SQL – to talk to databases ✅ Python – for automation & advanced analysis ✅ Power BI/Tableau – for dashboards #LearnDataAnalysis


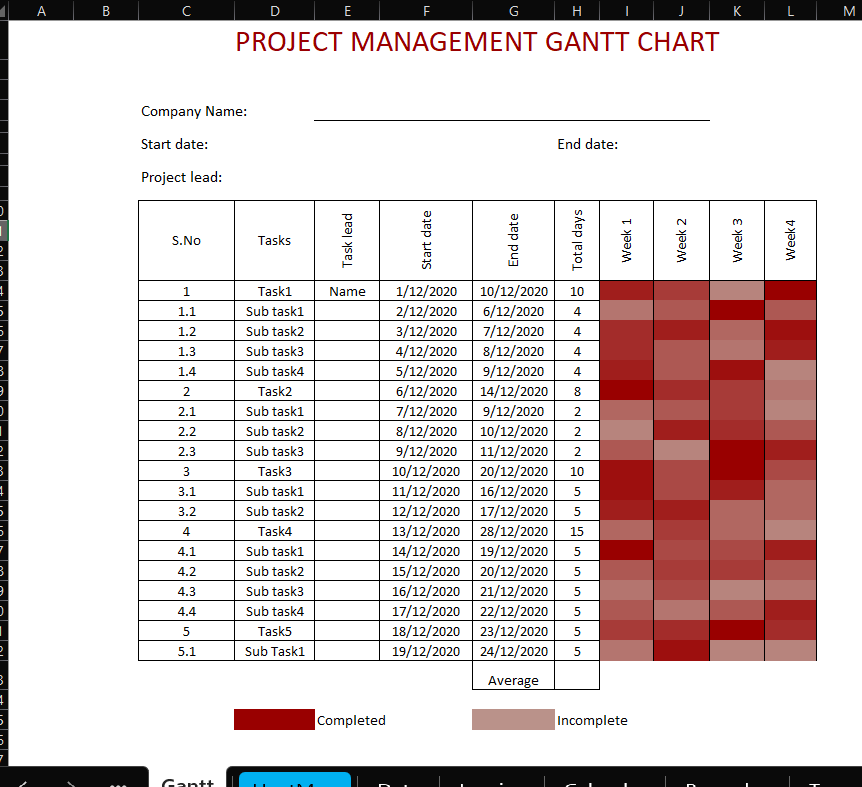
Built an Excel dashboard to track sales, top products, and shopping trends—even added a Gantt chart to keep projects on track. Turns out, data tells the best stories #learndataanalysis #Excel


If you’ve been thinking about learning Data Analysis, this is your reminder to take that step. Take the bold step today! Begin your Data Analysis journey with ECR Academy. ecracademy.com . . . . . . #learndata #learndataanalysis #learntech

Learning data analysis was tough. Excel formulas weren’t “formularing” But I kept going. Now I work with data confidently and even teach others. Learning tech is hard at first, but consistency wins. #UpskillYourself #BuildWithExcel #LearnDataAnalysis


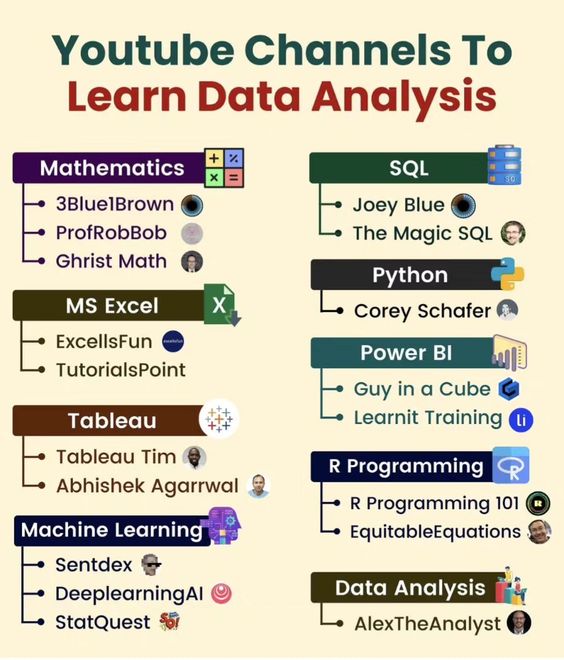
Youtube Channels to Learn Data Analysis #DataAnalysis #LearnDataAnalysis #YouTubeLearning #DataAnalytics #DataScience #BusinessIntelligence #BigData #MachineLearning #TechLearning #YouTube

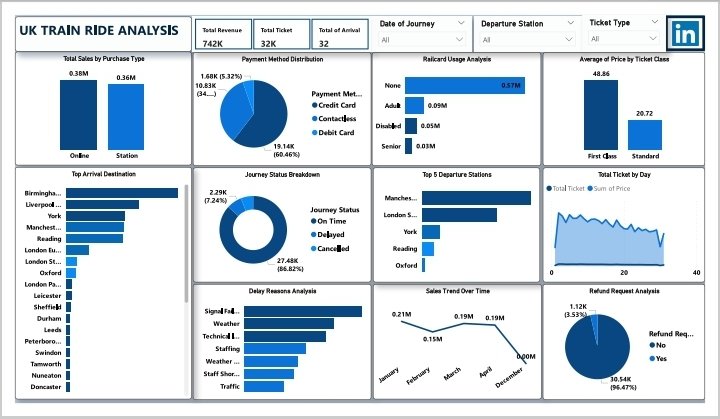
UK Train Ride Insights Revenue: £742K | Tickets: 32K | Stations: 32 Top Cities: Birmingham, Liverpool, York Payments: 60.6% Debit, 32.2% Contactless Sales: £380K Online | 1st Class Avg: £48.86 Punctuality: 86.6% On-Time | Delays: Signal & Weather #LearnDataAnalysis #FutureReady


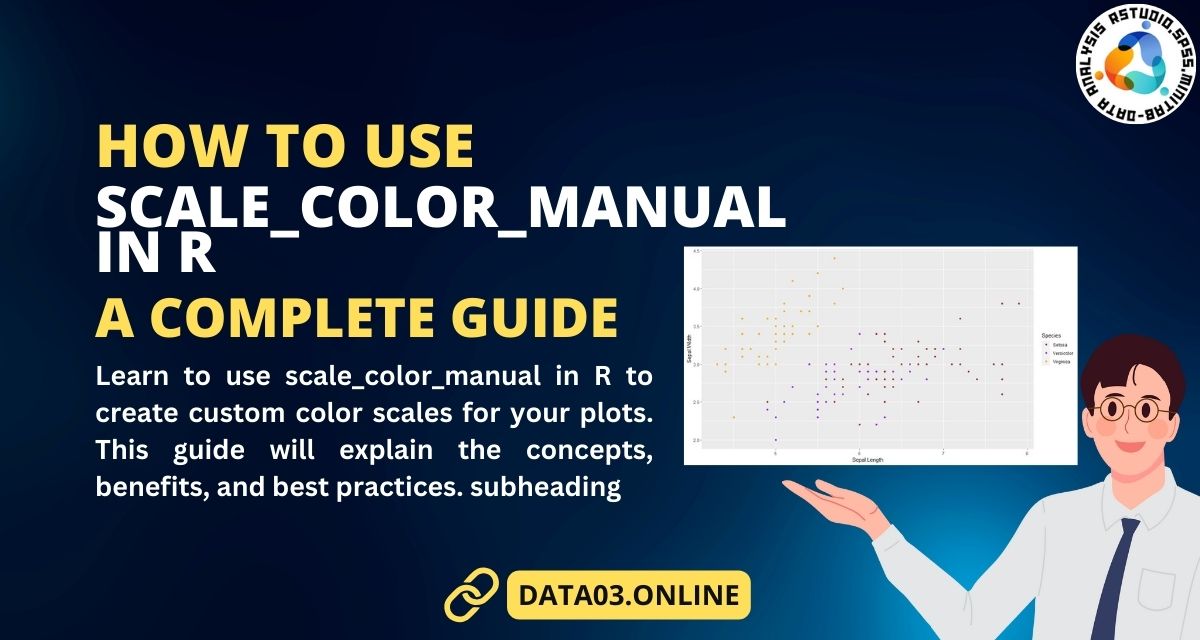
How to Use scale_color_manual in R | A Complete Guide #dataanalysis #learndataanalysis #rstudio #dataanalyst
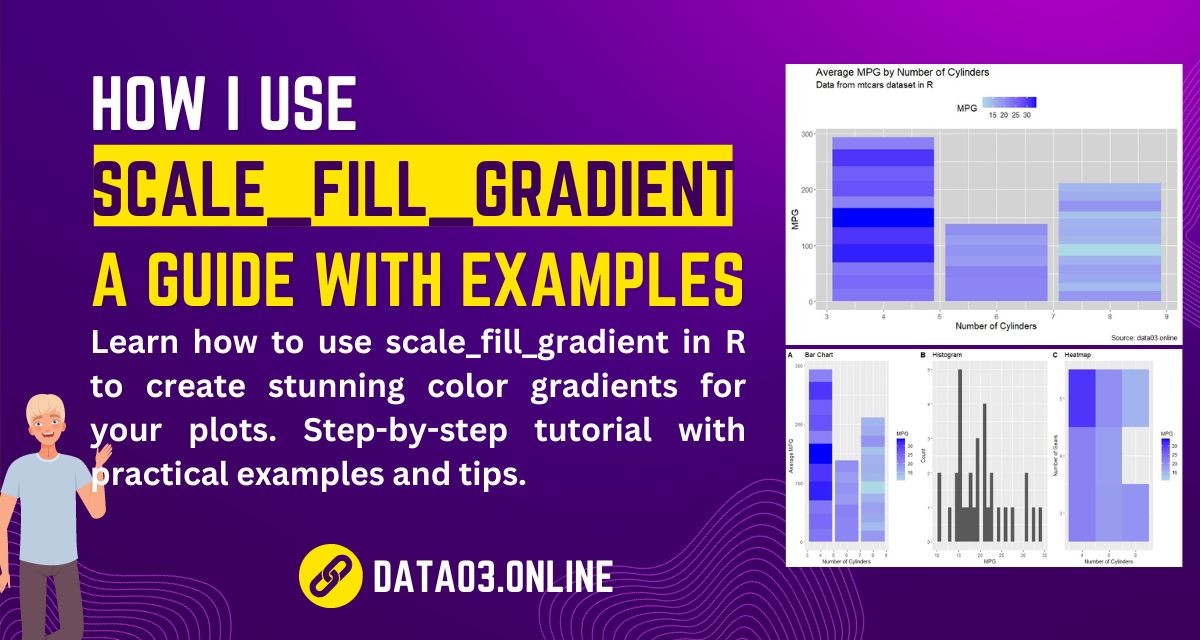
How I Use scale_fill_gradient in R: A Guide with Examples #dataanalysis #learndataanalysis #rstudio #dataanalyst
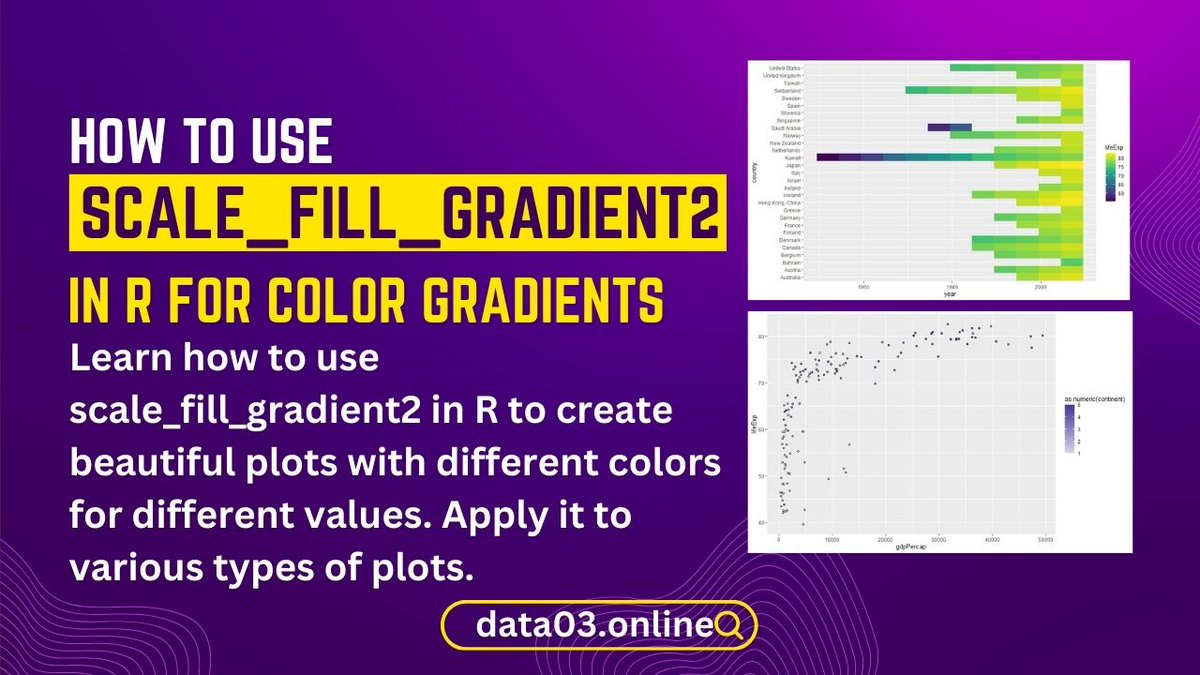
How to Use scale_fill_gradient2 in R for Color Gradients #dataanalysis #learndataanalysis #rstudio #dataanalyst
Secrets of R Contingency Tables Revealed: A PhD’s Experience #dataanalysis #learndataanalysis #rstudio #dataanalyst

How to Use ggplot Shapes in R to Create Stunning Scatter Plots #dataanalysis #learndataanalysis #rstudio #dataanalyst


Ready to become a data analyst in Just 3 Months with this Roadmap. #DataAnalyst #CareerChange #LearnDataAnalysis #TechSkills #DataAnalystJourney #sql #ExcelTips #TechEducation #Technology #Tableau #pythonprogramming
If you’ve been thinking about learning Data Analysis, this is your reminder to take that step. Take the bold step today! Begin your Data Analysis journey with ECR Academy. ecracademy.com . . . . . . #learndata #learndataanalysis #learntech

If you’ve been looking for the right time to start, this is it. Learn the skills that pay. Start earning from what you know #LearnToEarn #LearnDataAnalytics #LearnDataAnalysis

You don’t need a tech background to start data analysis. All you need is: Curiosity Consistency Practice Start small, stay consistent, and your growth will surprise you. #LearnDataAnalysis #CareerGrowth
GM My Data Analyst Top tools every beginner Data Analyst should know: ✅ Excel – for basics & quick analysis ✅ SQL – to talk to databases ✅ Python – for automation & advanced analysis ✅ Power BI/Tableau – for dashboards #LearnDataAnalysis
Ready to become a data analyst in Just 3 Months with this Roadmap. #DataAnalyst #CareerChange #LearnDataAnalysis #TechSkills #DataAnalystJourney #sql #ExcelTips #TechEducation #Technology #Tableau #pythonprogramming

Learn Data Analysis from Scratch - A Step-by-Step Guide theacademicpapers.co.uk/blog/2023/02/0… #LearnDataAnalysis #fromScratchStepStepGuide

Data is the key to unlocking new opportunities. 👊 Happy new Week #LearnDataAnalysis #Excel

Week 2: Statistics for Data Analysis 📊 Mean, median, mode Variance & standard deviation Probability basics Data distributions (normal, skewed) ✅ Practice: Summarize a dataset with descriptive stats #DataScience #LearnDataAnalysis

Join our growing data community at CoLab, where learning doesn’t happen alone. We build strong communities around tech skills, and Excel Fridays is one of your gateways into data. Be part of something impactful. Start here. #ExcelFridays #CoLabCommunity #LearnDataAnalysis

Learning data analysis was tough. Excel formulas weren’t “formularing” But I kept going. Now I work with data confidently and even teach others. Learning tech is hard at first, but consistency wins. #UpskillYourself #BuildWithExcel #LearnDataAnalysis

Meet one of our amazing Data Analysis students who turned curiosity into confidence and skills into opportunities! Her journey is proof that with the right training, you too can thrive in tech! #Testimonial #Birotojob #LearnDataAnalysis #TechCareer #StudentSuccess
Tech isn’t just changing the world — it’s rewriting how we live, work, and connect. Don’t just be a spectator. Learn it. Build with it #LearnDataAnalysis #datafam
Something went wrong.
Something went wrong.
United States Trends
- 1. #UFC323 127K posts
- 2. Merab 46.7K posts
- 3. Indiana 106K posts
- 4. Roach 29.6K posts
- 5. Petr Yan 27.7K posts
- 6. Duke 61.6K posts
- 7. Ohio State 64.5K posts
- 8. Mendoza 42.1K posts
- 9. Pantoja 35.7K posts
- 10. Bama 87.5K posts
- 11. Benin 29.1K posts
- 12. Joshua Van 11.2K posts
- 13. Walt 8,258 posts
- 14. #SB19_ACON2025 130K posts
- 15. Heisman 19.5K posts
- 16. TOP CALL 8,935 posts
- 17. Curt Cignetti 11.9K posts
- 18. Good Sunday 48.7K posts
- 19. Manny Diaz 3,001 posts
- 20. Vtubers 5,537 posts