#exceldashboard search results

From raw data to an interactive story! I just built my first Excel dashboard, it’s amazing how much insight you can uncover with the right visuals and structure. Step by step, growing my data analysis skills! 📈 #DataAnalyticsJourney #ExcelDashboard #LearningByDoing…


Still a learner #ExcelDashboard


September dump but let’s make it dashboard/report edition. 📊🔥 Shall we?👀 Quote yours…let’s go✨ PS: Saw this morning that this report also made it to Top 5 for Onyx challenge 😊💃 • Top 5 & 2nd runner up - ZoomChart mini challenge • Top 5 - Onyx challenge 👏👏


what's up #datafam, just designed my first #ExcelDashboard by analyzing cookie sales data using PivotTables, GETPIVOTDATA & interactive charts. It took a week, but I learned so much about data visualization & storytelling! Who else enjoys building dashboards?


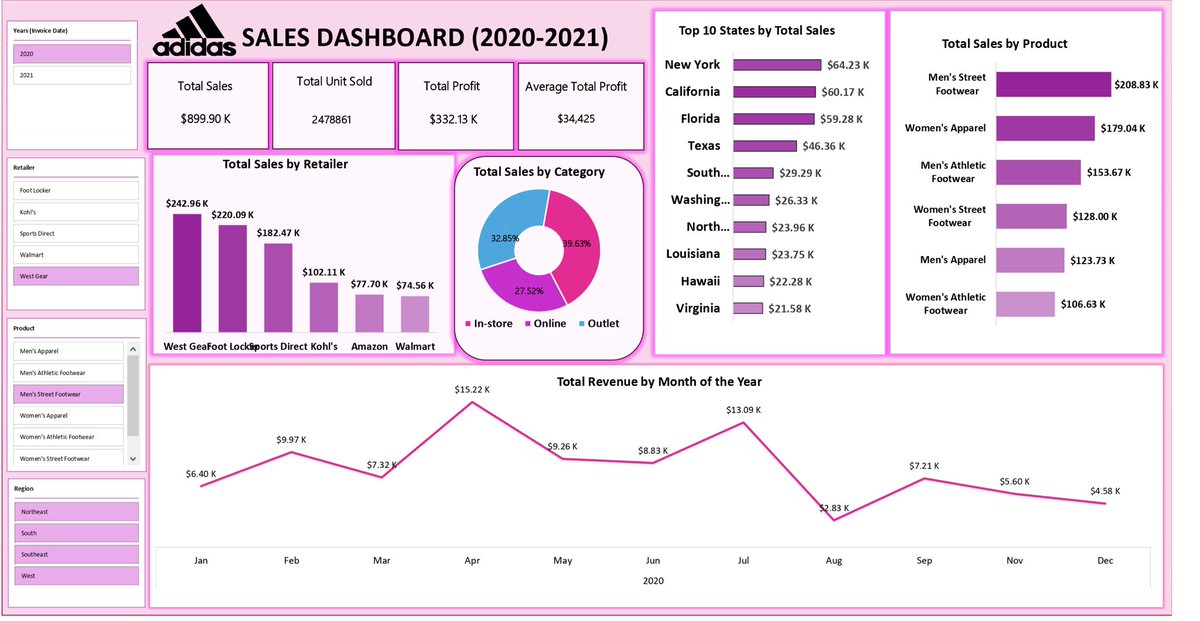
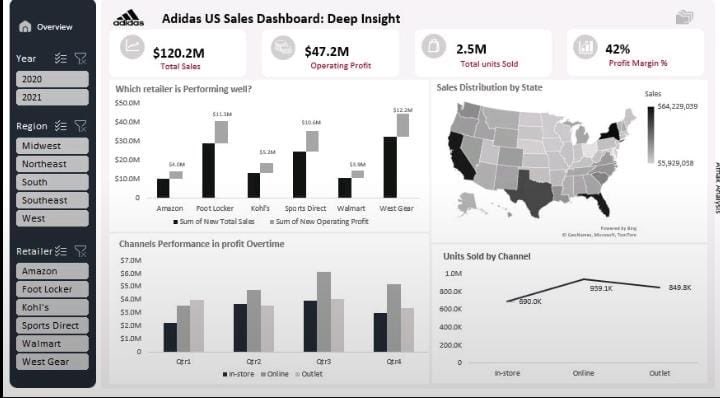
Just dropped my latest: Adidas Sales Analytics Dashboard 👟📊 Built fully in Excel, this project tracks: ✅ $899M in Sales ✅ Regional & Product Trends ✅ YoY Growth (2020 vs 2021) ✅ In-store vs Online vs Outlet Why do you think that is? Let’s talk 👇🏽 #ExcelDashboard #Viz


Sharing my data analytics projects for the first time since I started learning 2 months ago. Exploring different datasets and discovering insights. I registered for EXCEL WITH DIKKY @ThisIsDikky and the class was so amazing that I even got more than expected. #Exceldashboard


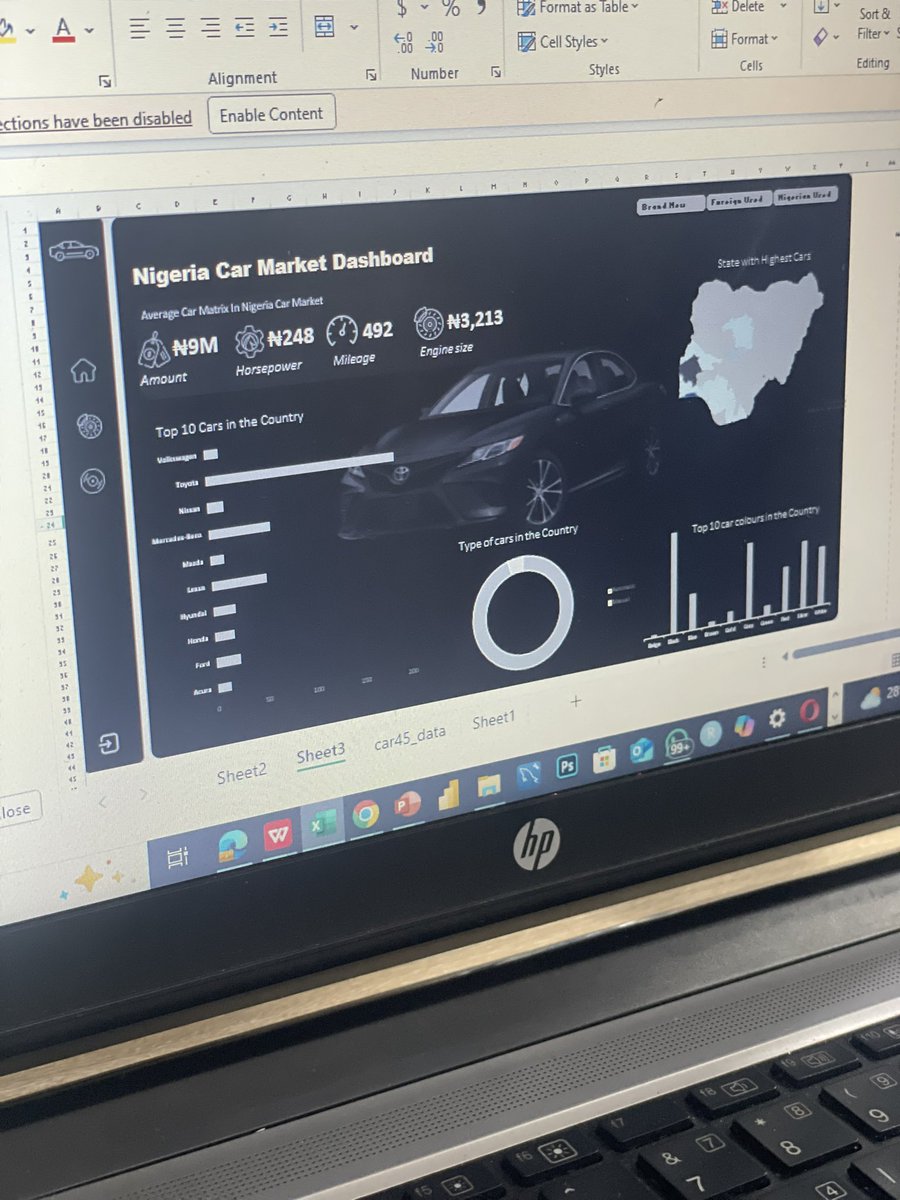

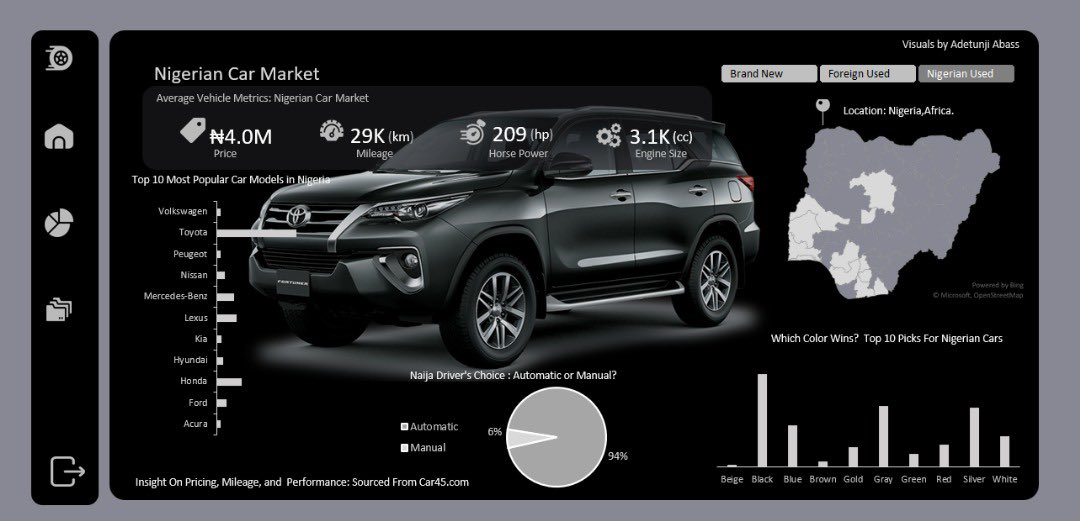
I came across @ObohX Excel car45 dataset and i decided to recreate.. Learnt new things Thank you boss @ObohX #datafam #ExcelDashboard

Loaded data with Power Query, analyzed and summarized with Pivot Tables, added dynamic titles & filters. Enjoy your weekend! 🫶❤️ #ExcelDashboard #DataStorytelling #Datavisualization #Analytics #Excel #growth


📊 Just created an interactive dashboard using Excel! 🚀 Crafted a user-friendly dashboard that's both informative and easy to navigate. 📈💼 @Adewaleanalyst Feel free to explore and let me know what you think! 🙌 #ExcelDashboard #DataVisualization #analyticscorperworkshop2.0


Started my data journey with Excel, and this Adidas Sales Dashboard (2020–2021) was my first big win 🎯 Built with slicers for retailers, products & regions, it showed me how powerful storytelling through data can be. #DataAnalytics #ExcelDashboard #datafam
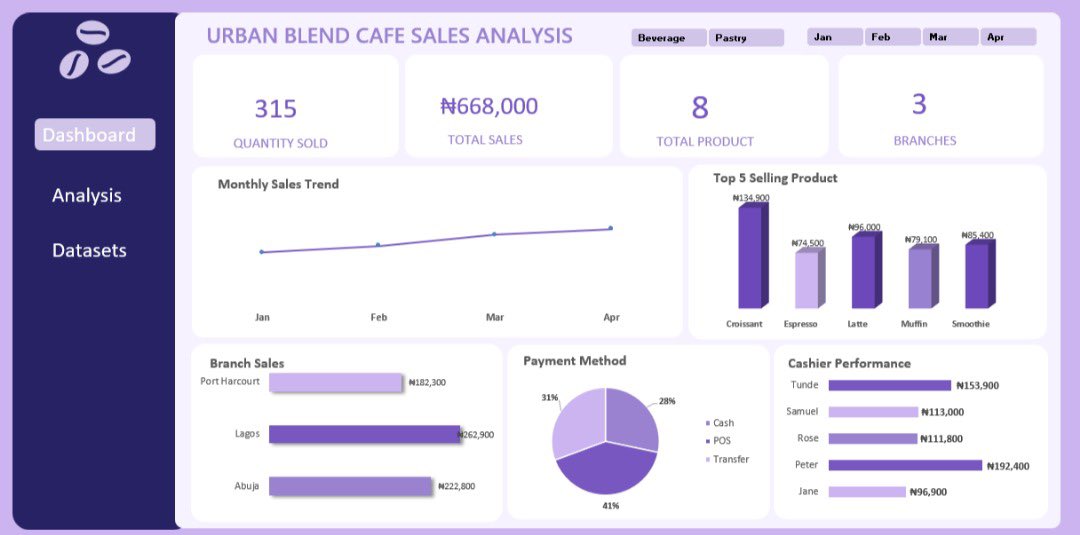
Excel 101 week 3 class: Built a Sales Performance Dashboard for Urban Blend Café.. Turning the messy data into clear, actionable insights that support better business decisions. @ObohX #DataAnalysis #ExcelDashboard #SalesAnalytics #UrbanBlendCafe

2023 was a defining year for Oreo. My Excel dashboard analyzes market reach, top SKU, customer trend, and seasonal spikes that shaped Oreo’s performance Powerful insights from simple, structured data. #SalesInsights #ExcelDashboard #DataAnalytics #DataDriven #AnalyticsCommunity
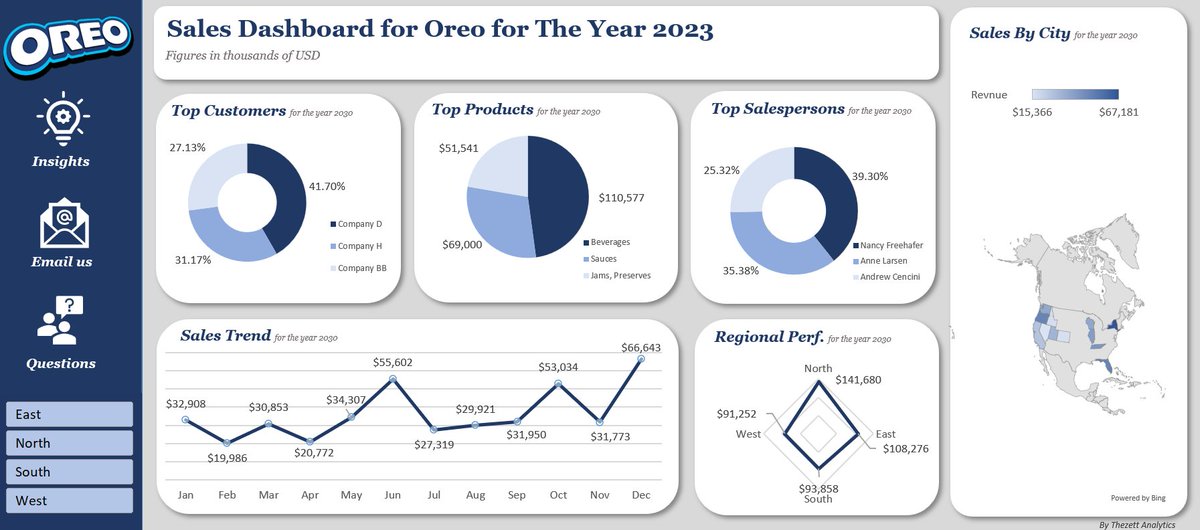

Built this interactive Excel dashboard from a guided class by @ObohX and learnt exciting concepts like: • Dynamic text via named cell refs • Custom number format (K/M) • Clean slicer styling (gradient match) • Modern design Thank you @ObohX #ExcelDashboard


لما تجمع Pivot مع Slicers، الإكسل يصير لوحة تفاعلية تشوف من خلالها كل شيء بوضوح 😍 هذا بالضبط اللي سويته في الداشبورد حقي . #ExcelDashboard #ExcelTips #DataAnalysis #PivotTable #Slicers #ExcelSkills #تحليل_البيانات

Took time to retrace my steps — now I’m back with my first Excel dashboard! 📊 Slow progress, but real progress. Built using slicers, charts, and a sales dataset. Proud of this progress. 🚀 #DataAnalysis #ExcelDashboard #Excel #AnalyticsJourney #LearningInPublic #Progres

Lightweight Excel dashboard for clear CRM metric tracking ✅ Monitor leads sales and conversions in one clean view ✅ Fast insights ✅ Simple visuals ✅ Perfect for daily sales control #ExcelDashboard #CRMAnalytics #SalesTracking #DataVisualization

✅ Keep it clean Avoid clutter, heavy colors, or unnecessary charts. 🎯 Great dashboards make people say: “I get it.” Not: “Where do I start?” #30DaysOfDataStories #ExcelDashboard #DataStorytelling #DashboardDesign #LearnInPublic
Use PowerPoint to create isometric shapes 3D objects and mask layers for interactive Excel dashboards. Make project management visuals clean modern and easy to read. #ExcelDashboard #PowerPointDesign #DataVisualization #ProjectManagement

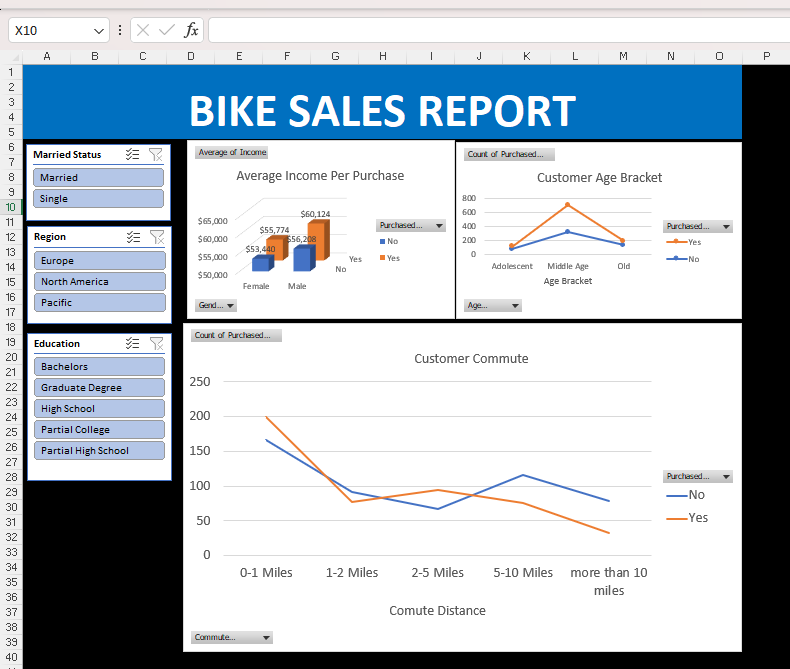
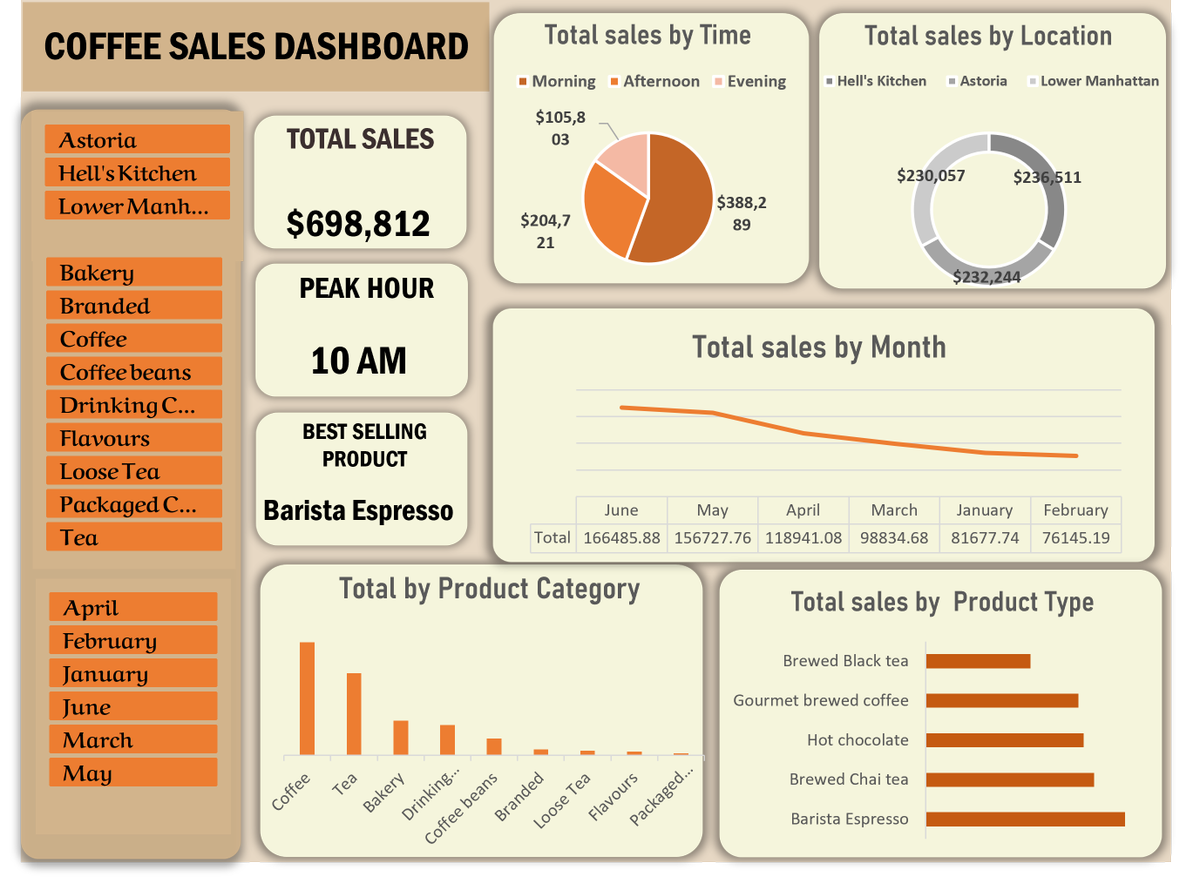
I’m excited to share my latest Excel Data Analysis project an interactive Coffee Sales Dashboard designed to uncover sales patterns, customer behavior, and performance trends across months, products, and regions. #DataAnalysis #ExcelDashboard #DataVisualization #ExcelSkills
2023 was a defining year for Oreo. My Excel dashboard analyzes market reach, top SKU, customer trend, and seasonal spikes that shaped Oreo’s performance Powerful insights from simple, structured data. #SalesInsights #ExcelDashboard #DataAnalytics #DataDriven #AnalyticsCommunity
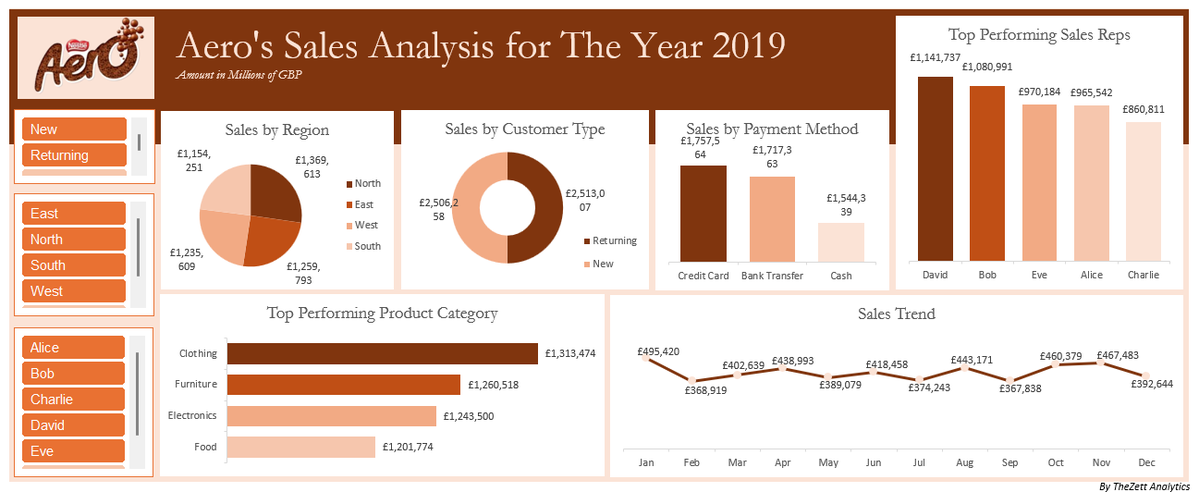
AERO’s 2019 performance. Using Excel, I built a sales dashboard that reveals revenue trends, customer patterns, top-performing regions, and product level insights that shaped the company’s growth trajectory #DataAnalytics #ExcelDashboard #SalesAnalysis #DataViz
Modern Excel call center dashboard with clean visuals and clear KPI tracking. Easy way to monitor agent productivity and daily performance insights. #ExcelDashboard #CallCenterAnalytics #DataViz #ExcelTips
World map chart in Excel for clear global logistics insights. Clean visuals easy KPI tracking and a workflow that connects with a process mapping template excel for better supply chain analysis. #ExcelDashboard #LogisticsDashboard #DataViz #SupplyChain
An interactive BI dashboard in Excel with clean visuals and clear KPI tracking. Built with practical tools for modern business reporting and fast insights. #ExcelDashboard #BIDashboard #ExcelTips #DataViz
لما تجمع Pivot مع Slicers، الإكسل يصير لوحة تفاعلية تشوف من خلالها كل شيء بوضوح 😍 هذا بالضبط اللي سويته في الداشبورد حقي . #ExcelDashboard #ExcelTips #DataAnalysis #PivotTable #Slicers #ExcelSkills #تحليل_البيانات
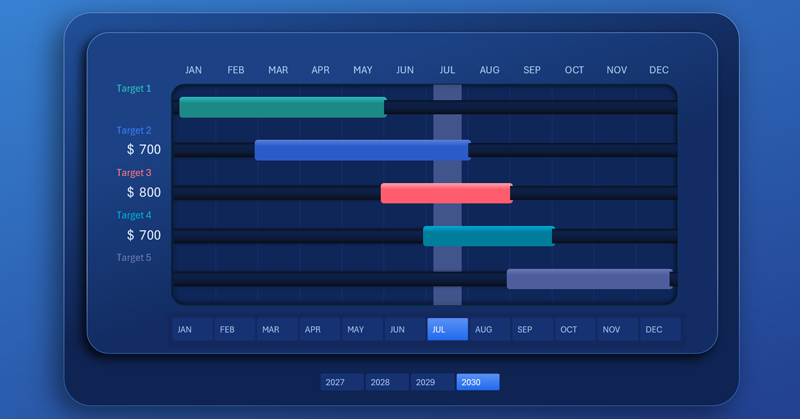
A clean and simple interactive Gantt chart in Excel for clear task timelines and progress tracking. Easy to use visual and perfect for goal focused planning. #GanttChart #ExcelDashboard #ProjectManagement #DataViz exceltable.com/data-charts/be…
A butterfly chart in Excel is a powerful way to compare two KPI groups side by side. Clean design fast insights dashboard ready. Great for sales HR and finance reporting. #ExcelDashboard #KPIdashboard #ExcelTips #DataViz
Excel offers clean ways to visualize data and build interactive dashboards powered by PivotTables. Dynamic charts, slicers, and smart formatting help highlight trends and keep KPIs clear. #ExcelDashboard #DataVisualization #PivotTables #Analytics

Hi #datafam , it’s been a while. I hit some productivity hurdles recently,NEPA wasn’t giving me grace at all😅 Yet I pushed through, and I’m proud to announce that I completed my Adidas sales analysis for the November @easytech365 Challenge, just in time. #exceldashboard


The dashboard will include visuals showing: Brand performance Price segmentation Horsepower & torque distribution Fuel efficiency Engine category breakdown Value-for-money ranking All done inside Excel only. #ExcelDashboard #AutomotiveData
Excel 101 week 3 class: Built a Sales Performance Dashboard for Urban Blend Café.. Turning the messy data into clear, actionable insights that support better business decisions. @ObohX #DataAnalysis #ExcelDashboard #SalesAnalytics #UrbanBlendCafe


From raw data to an interactive story! I just built my first Excel dashboard, it’s amazing how much insight you can uncover with the right visuals and structure. Step by step, growing my data analysis skills! 📈 #DataAnalyticsJourney #ExcelDashboard #LearningByDoing…
Still a learner #ExcelDashboard
September dump but let’s make it dashboard/report edition. 📊🔥 Shall we?👀 Quote yours…let’s go✨ PS: Saw this morning that this report also made it to Top 5 for Onyx challenge 😊💃 • Top 5 & 2nd runner up - ZoomChart mini challenge • Top 5 - Onyx challenge 👏👏
what's up #datafam, just designed my first #ExcelDashboard by analyzing cookie sales data using PivotTables, GETPIVOTDATA & interactive charts. It took a week, but I learned so much about data visualization & storytelling! Who else enjoys building dashboards?
I came across @ObohX Excel car45 dataset and i decided to recreate.. Learnt new things Thank you boss @ObohX #datafam #ExcelDashboard
Just dropped my latest: Adidas Sales Analytics Dashboard 👟📊 Built fully in Excel, this project tracks: ✅ $899M in Sales ✅ Regional & Product Trends ✅ YoY Growth (2020 vs 2021) ✅ In-store vs Online vs Outlet Why do you think that is? Let’s talk 👇🏽 #ExcelDashboard #Viz
📊 Just created an interactive dashboard using Excel! 🚀 Crafted a user-friendly dashboard that's both informative and easy to navigate. 📈💼 @Adewaleanalyst Feel free to explore and let me know what you think! 🙌 #ExcelDashboard #DataVisualization #analyticscorperworkshop2.0

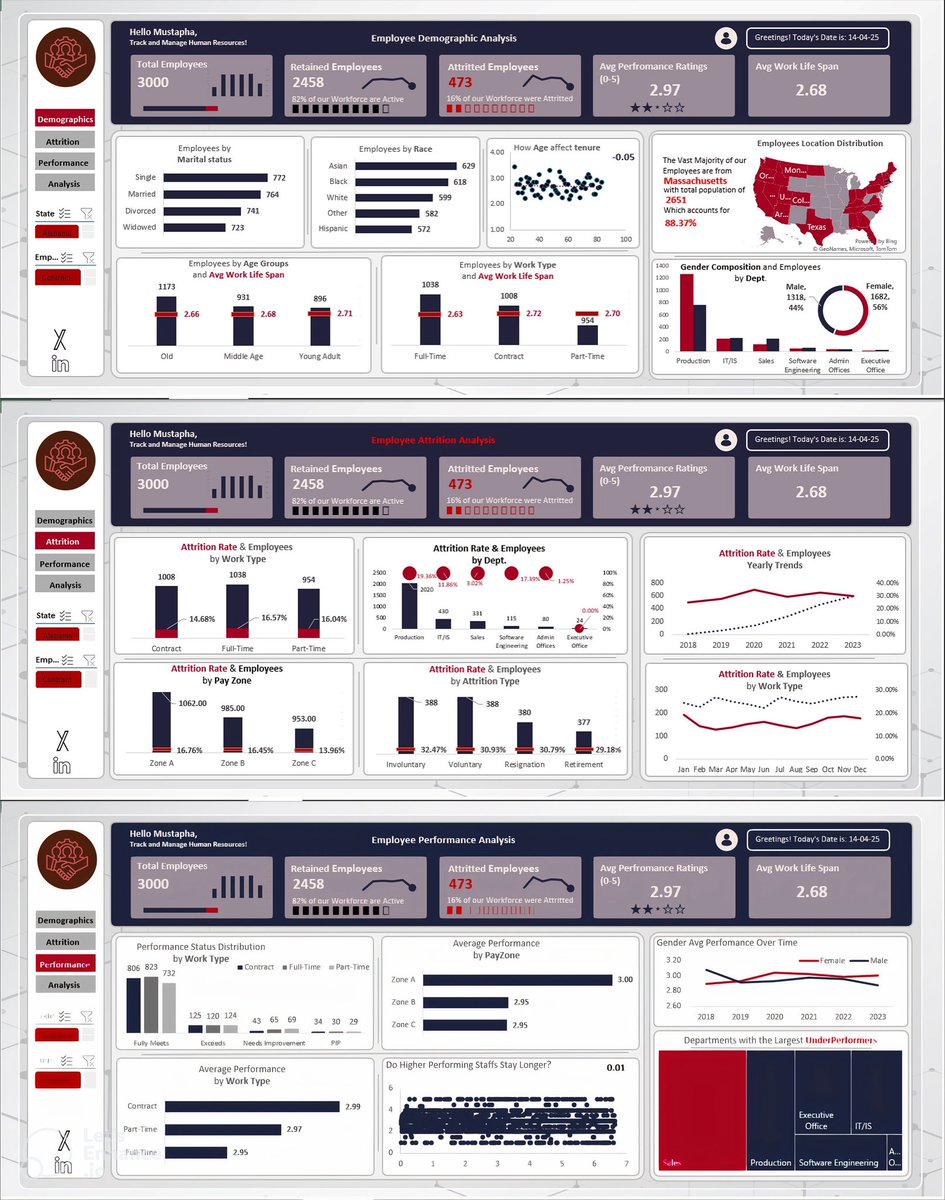
Just completed an HR Analytics project with @iam_daniiell using @msexcel ! Built a dashboard showing: 📊 Demographics 📉 Attrition 📈 Performance metrics From cleaning data to pulling insights — I’m leveling up in HR analytics! #ExcelDashboard #HRAnalytics #datafam #DataAnalysis
Sharing my data analytics projects for the first time since I started learning 2 months ago. Exploring different datasets and discovering insights. I registered for EXCEL WITH DIKKY @ThisIsDikky and the class was so amazing that I even got more than expected. #Exceldashboard
Loaded data with Power Query, analyzed and summarized with Pivot Tables, added dynamic titles & filters. Enjoy your weekend! 🫶❤️ #ExcelDashboard #DataStorytelling #Datavisualization #Analytics #Excel #growth

Sales down since 2020? Here’s how I analyzed the decline with a Global Electronics Sales Dashboard. 📊 Data Normalization & Modeling → EDA → Dashboard → Insights Imagine being a business owner facing a decline in sales since 2020... #DataAnalytics #exceldashboard #Datafam

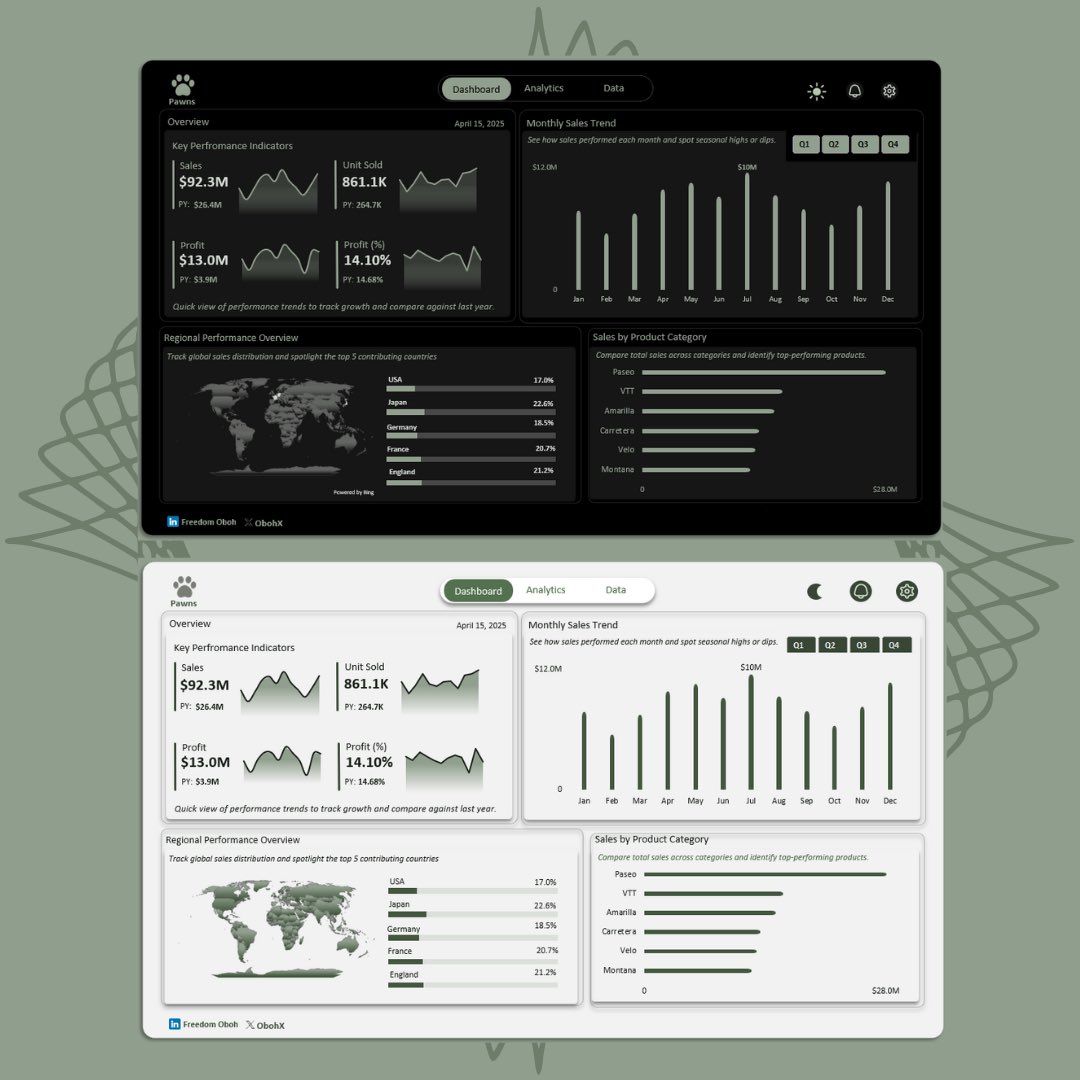
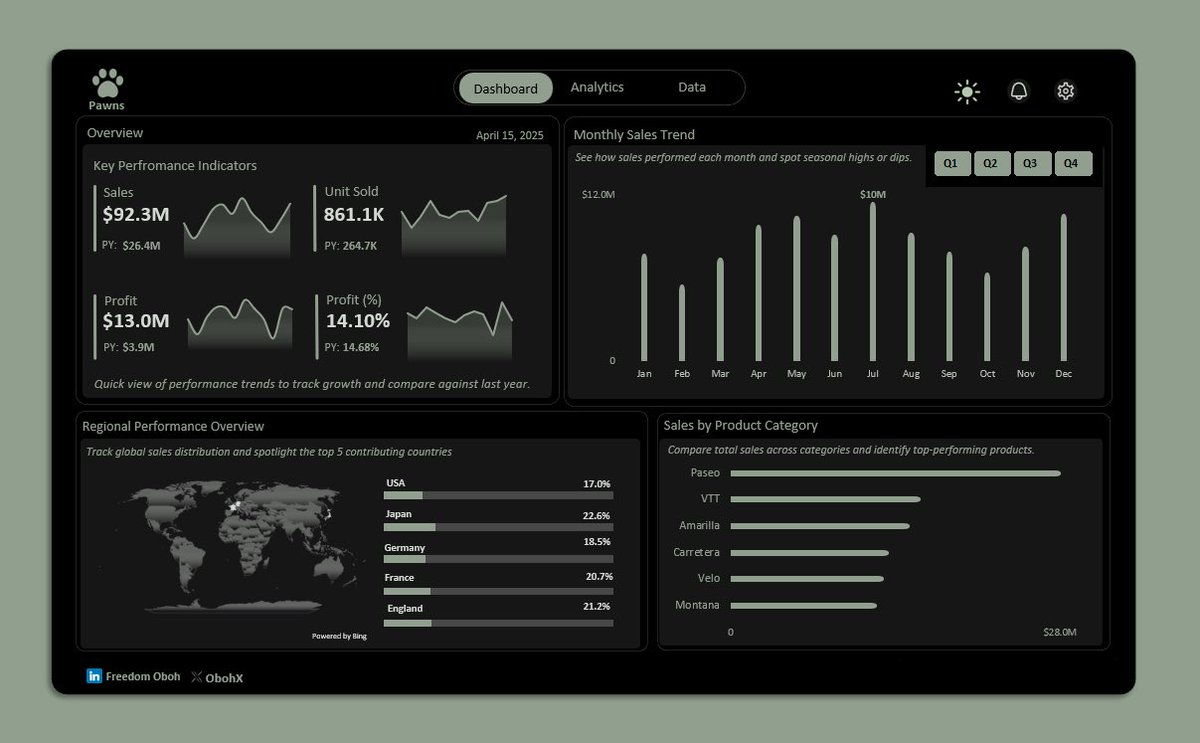
Hey #Datafam ! 🤟 Another @msexcel dashboard, now with both light & dark mode 🌗 Clean design, clear storytelling, from KPIs and monthly trends to product performance and regional breakdowns. Every piece was built with intention. #ExcelDashboard #DataStorytelling #Excel


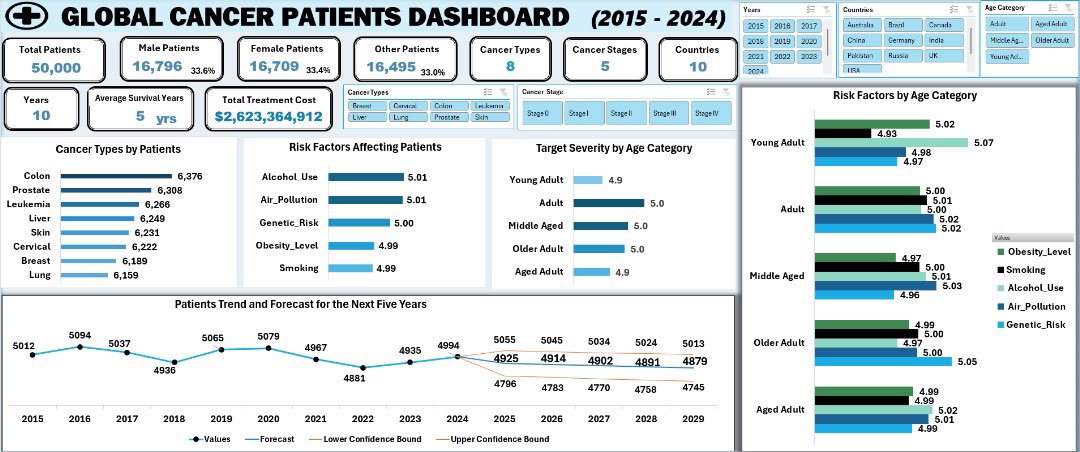
🧠 Global Cancer at a Glance! Just wrapped up a data-driven project exploring global cancer trends 🌍📊 Built an interactive Excel Dashboard and visualized insights in a PowerPoint presentation. Data speaks. Let’s listen. #DataAnalytics #ExcelDashboard #GlobalHealth

My first #exceldashboard as I take the plunge and transition into tech. Honestly? It’s hard and frustrating some days, but I wouldn’t have it any other way. Excited and scared…but mostly excited! Thank you @thenaijacarguy you’re an honest and patient teacher #DataAnalytics

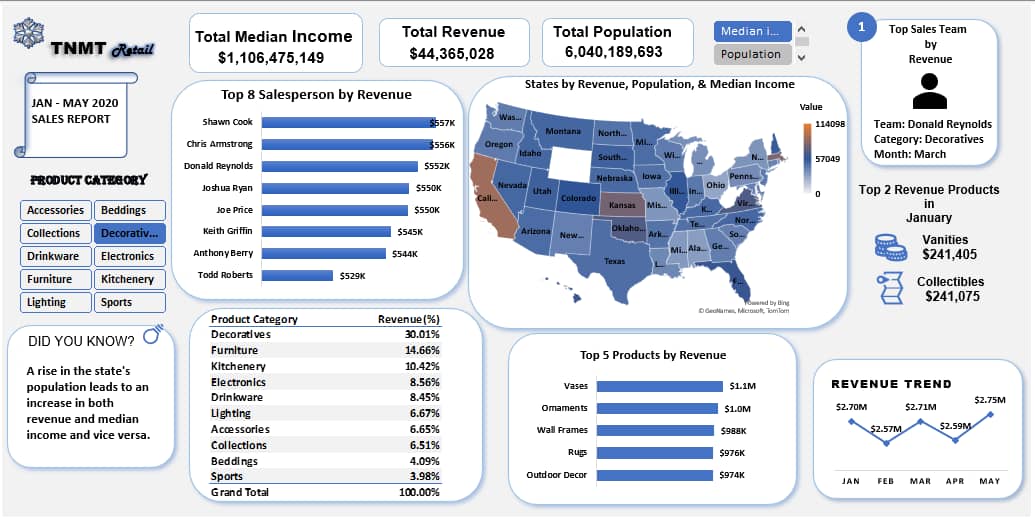
1st Microsoft Excel Project This is my submission for the Binance Data Science Excel Capstone Project. The dataset contains TNMT retail sales from January to May 2020 across their different store locations. #Utiva #Binance #exceldashboard #DataAnalytics

Day 13/30- Built a simple RFM dashboard to segment e-commerce customers by spending and frequency. Amazing how simple formulas can unlock business value. 🚀 #ExcelDashboard #EcommerceAnalytics #DataVisualization

Day 12 - Customer Lifetime Value Calculator Calculated Customer Lifetime Value using Excel. Understanding long-term customer revenue helps businesses plan smarter retention strategies. #ExcelForBusiness #CLV #CustomerInsights

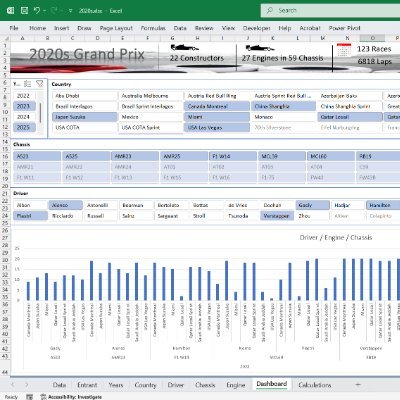
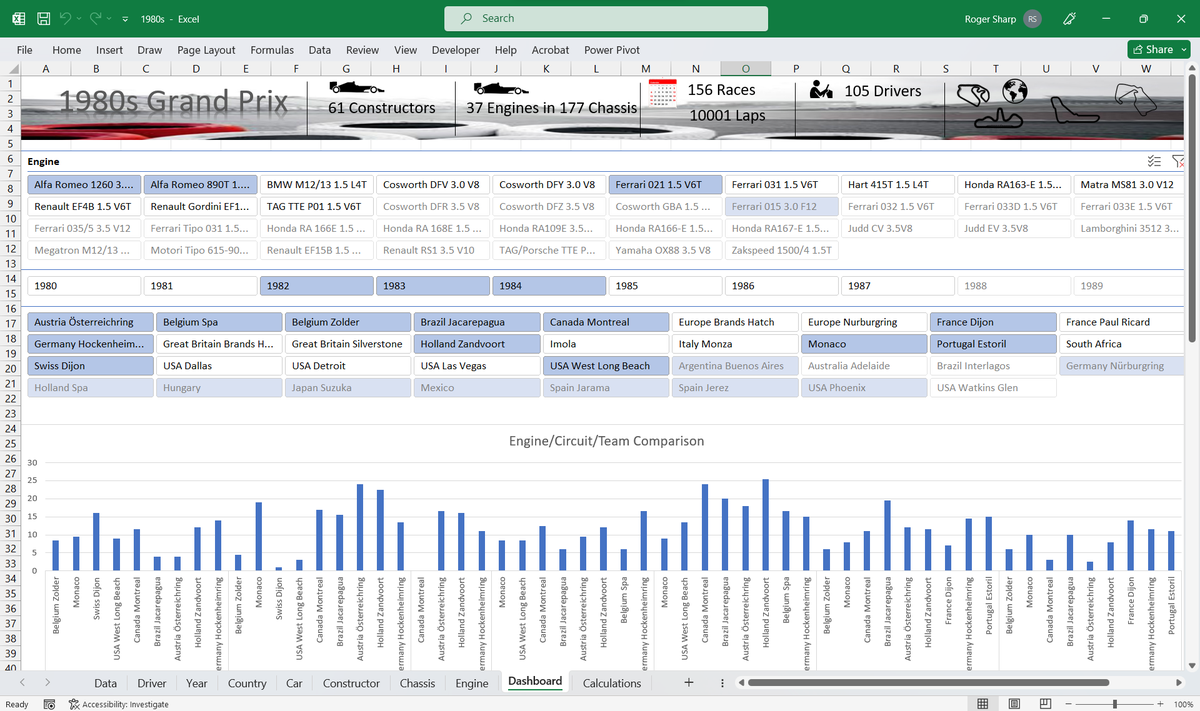
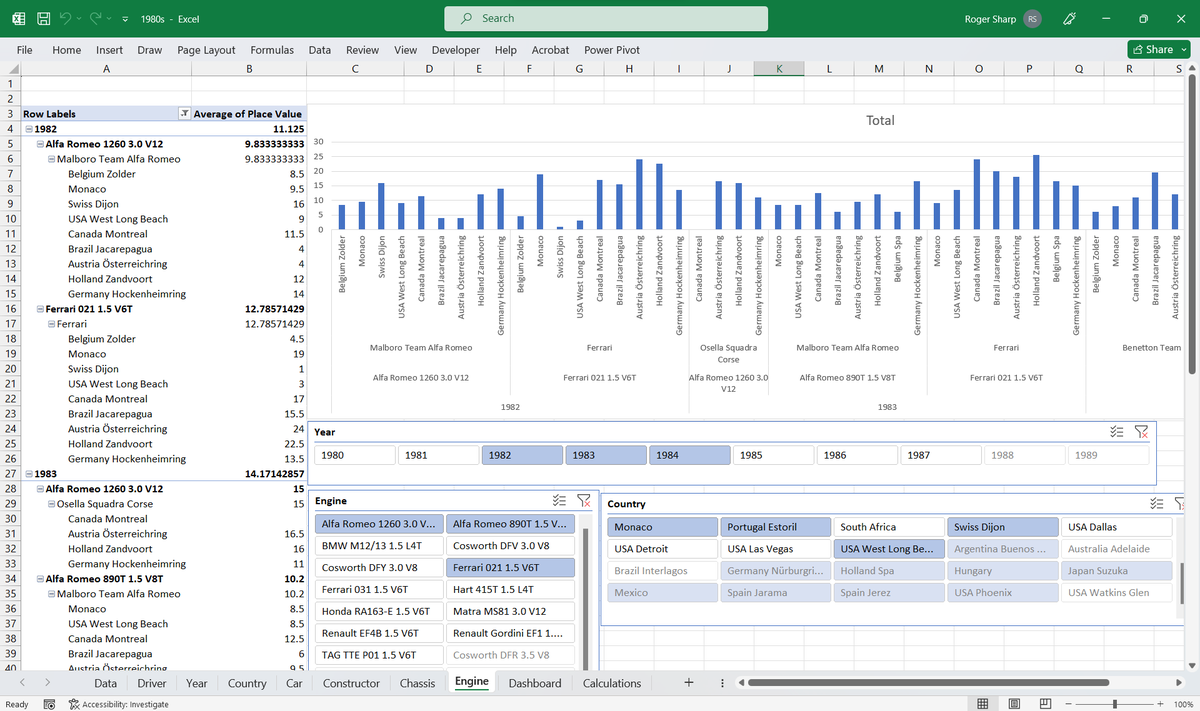
Excel Dashboard for #F1 Enthusiasts #Formula1 #ExcelDashboard #RetroGP #RetroF1 #HistoricF1 ebay.co.uk/itm/3142746208…


Something went wrong.
Something went wrong.
United States Trends
- 1. Thanksgiving 720K posts
- 2. #StrangerThings5 288K posts
- 3. BYERS 67.6K posts
- 4. robin 102K posts
- 5. Afghan 320K posts
- 6. Dustin 67.6K posts
- 7. Holly 69.2K posts
- 8. Reed Sheppard 6,824 posts
- 9. Vecna 66.8K posts
- 10. Jonathan 75.3K posts
- 11. #DareYouToDeath 53.8K posts
- 12. Podz 5,164 posts
- 13. hopper 17.1K posts
- 14. mike wheeler 10.5K posts
- 15. derek 21.2K posts
- 16. Nancy 70.2K posts
- 17. Lucas 85.4K posts
- 18. noah schnapp 9,342 posts
- 19. Joyce 34.9K posts
- 20. Erica 19.3K posts