#pythonfordataanalysis 검색 결과


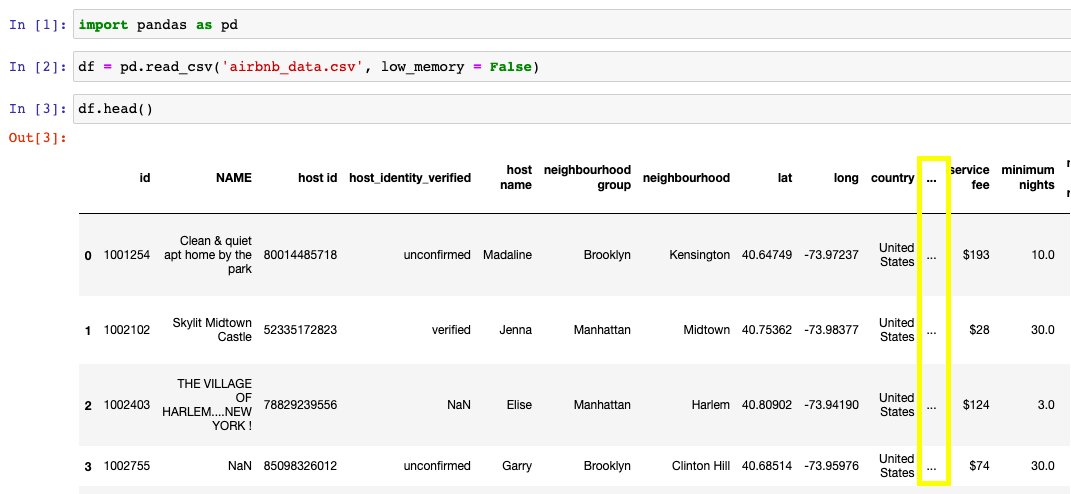
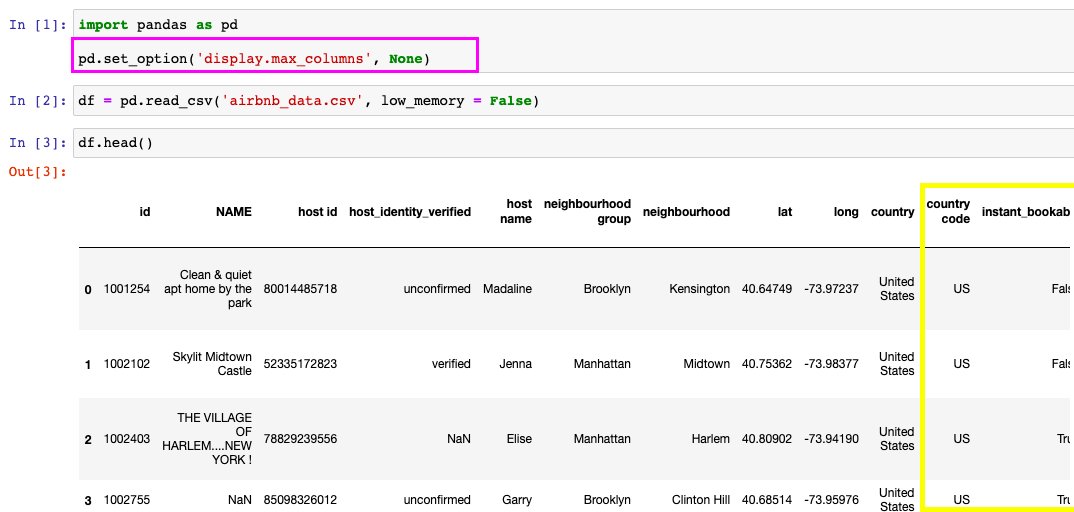
Hey Pythonistas! So, you've just loaded your dataset into a Pandas DataFrame, but some of your columns are hidden. How do we fix that? Simply add this line of code pd.set_option('display.max_columns', None) Tadaaaa... Fixed! #pythonfordataanalysis

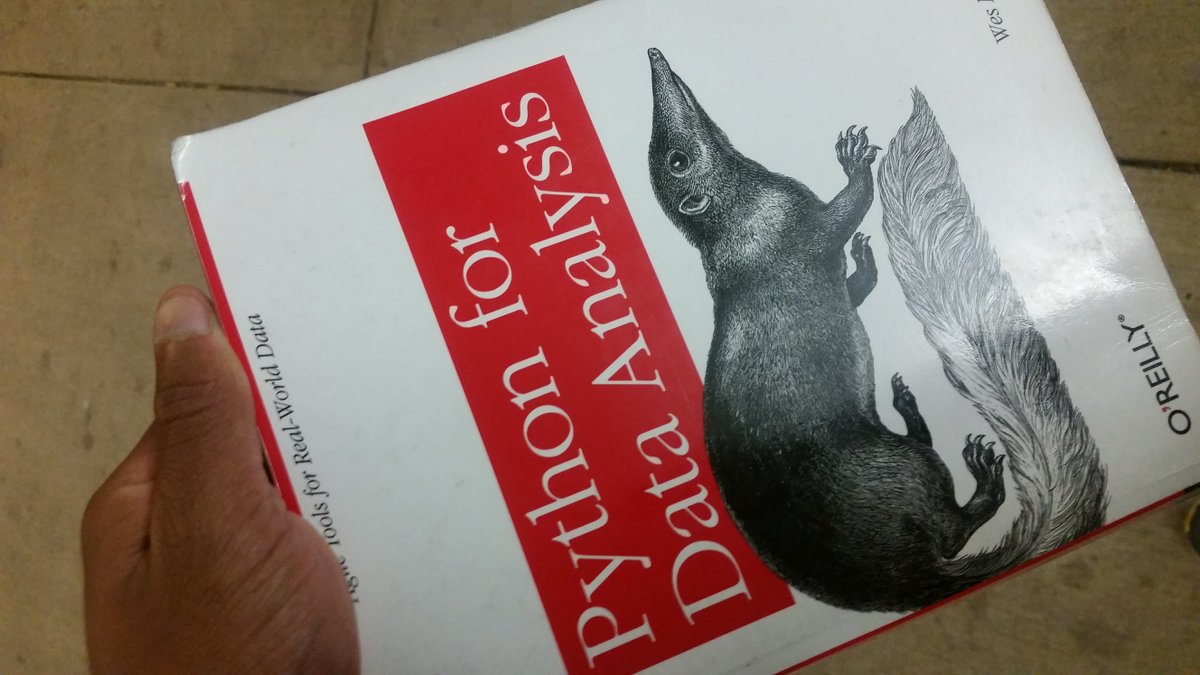
Reading #pythonfordataanalysis by @wesmckinn and realize I need to get rid of "for loops" and use #numpy more.

Day 14 of #100DaysOfCode Read about reindexing in pandas; Started with reading and writing text data, but encountered challenge as the code: !type example/ex1.csv returned error instead of sets of data. Please does anyone have solution to.the above? #pythonfordataanalysis


A sneak peek into my project "#PythonForDataAnalysis" I'll be working with VSC editor and I'll host the project on GitHub

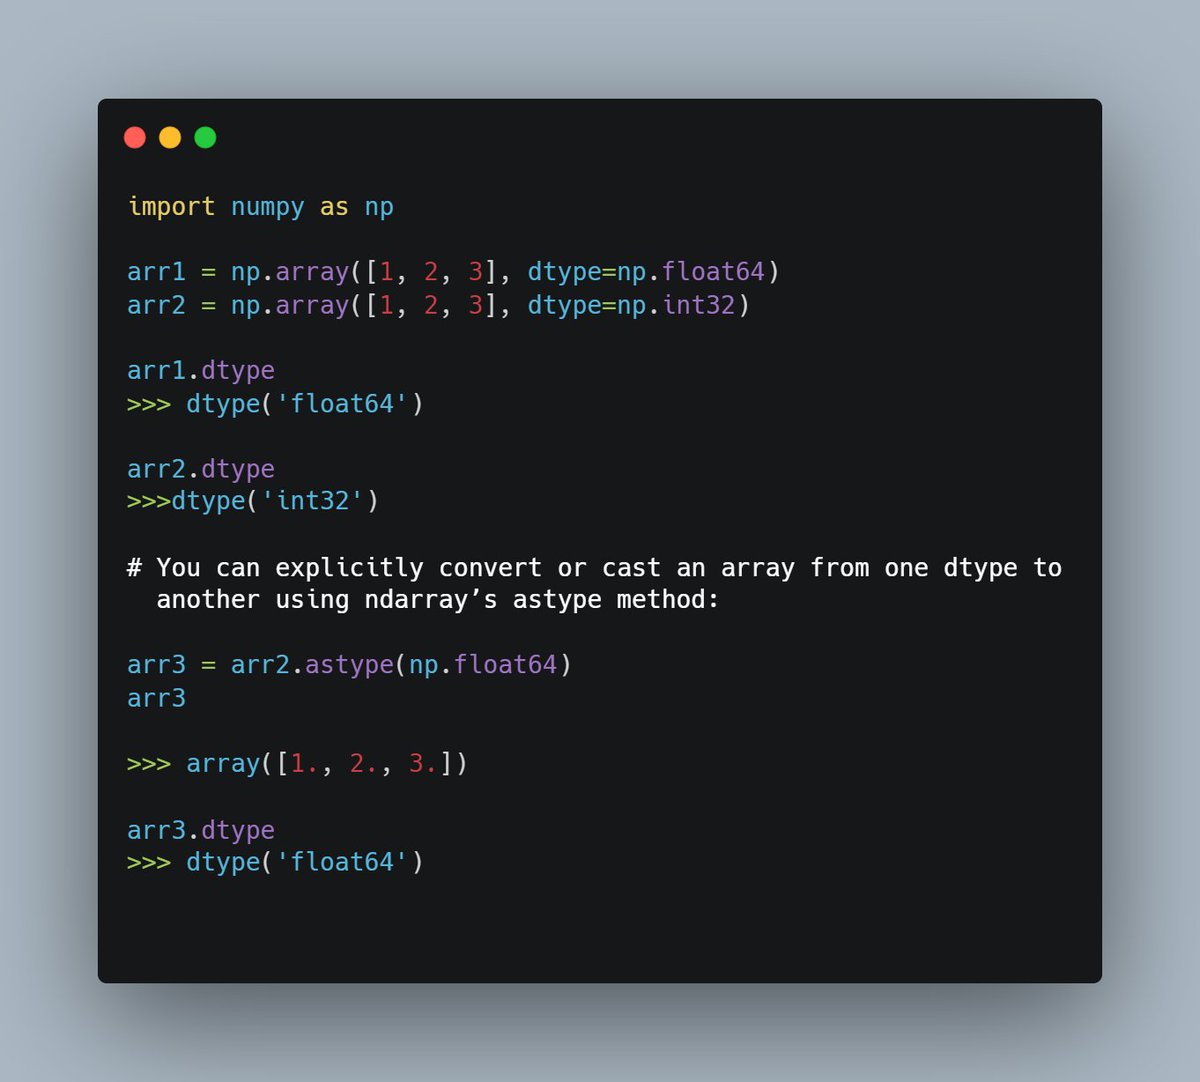
Data Types for ndarrays in Numpy #Python: The data type or dtype is a special object containing the information (or metadata,data about data) the ndarray needs to interpret a chunk of memory as a particular type of data: #PythonForDataAnalysis

Just thought to let you guys know I've started learning Python and I hope it doesn't bite me sha 😜😜😜 Pythonista in the making. #pythonista #python #pythonfordataanalysis #DataAnalytics #datafam #DataFestAfrica2023

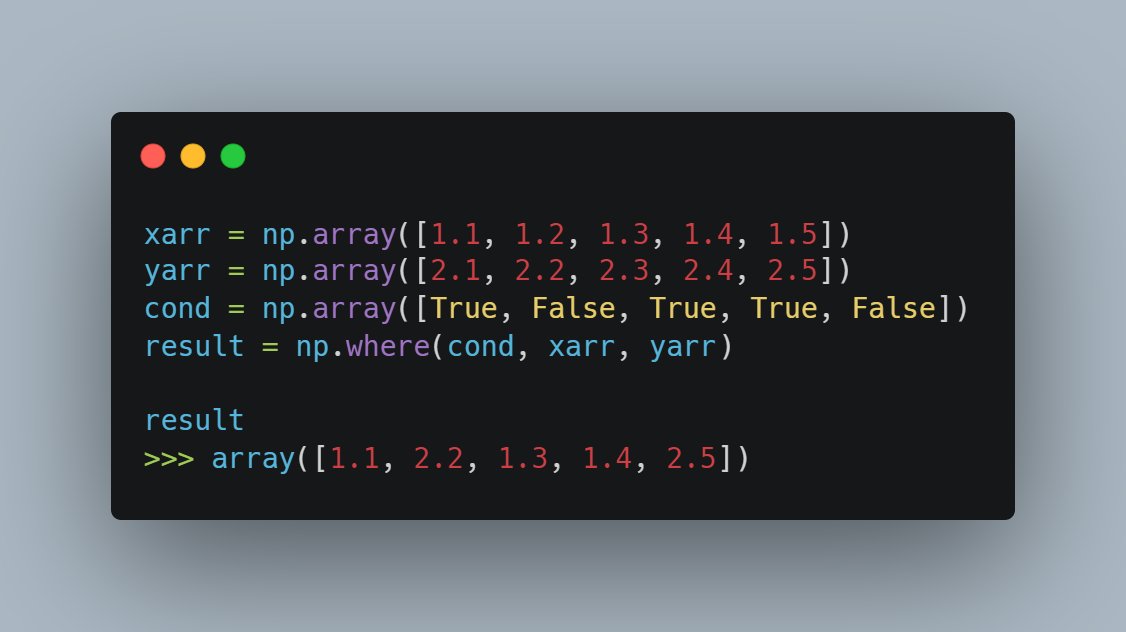
Expressing Conditional Logic as Array Operations in Numpy #Python: The numpy.where function is a vectorized version of the ternary expression x if condition else y. Suppose we had a boolean array and two arrays of values: #PythonForDataAnalysis

2️⃣. NumPy: for mathematical operations and statistics. 3️⃣. Matplotlib: bring your data to life with stunning visualizations. #DataAnalysis #PythonForDataAnalysis #PandasLibrary #AnalyticsTools #DataSkills #DataAnalyticsJourney

Python changed my life! 🚀 As a data analyst, it streamlined my workflow, opened doors to new opportunities, and helped me uncover insights that drove business growth. 🤓 Learning Python can level up your career too! #PythonForDataAnalysis #DataScience"


It wasn’t enough for you to name the software Python you still have to put it inside another software called Anaconda. No wonder the software is tough but I shall wage war against this beast and I shall win. #HappNewMonth #pythonfordataanalysis #DataAnalytics

Second session with @genesystechhub and this time we dove into the world of Python for Data Analysis What we covered 👇 Facilitated by @KevinObote6 and Paul Ndirangu. #PythonForDataAnalysis #GenesisTechHub #DataAnalyticsJourney #JupyterNotebook #Pandas #PythonBeginners


100% off Udemy course coupon Data Analytics Masters - From Basics To Advanced Master Data Analysis: Learn Python, EDA, Stats, MS Excel, SQL, korshub.com/courses/data-a… #DataAnalyticsMaster #PythonForDataAnalysis #BusinessIntelligence #PredictiveAnalytics #korshub
korshub.com
100% off coupon for Data Analytics Masters 2025 - From Basics To Advanced October 2025 | Korshub
Master Data Analysis: Learn Python, EDA, Stats, Excel, SQL, Power BI/Tableau, Fabric, Predictive Analytics & ETL Basics

Does a Data Analyst really need Python skills? Below is what we have to say to that! What do you think? Share your thoughts with us in the comment section... #PythonForDataAnalysis #DataAnalytics #Learnwithwida Walk with us.... 1/3


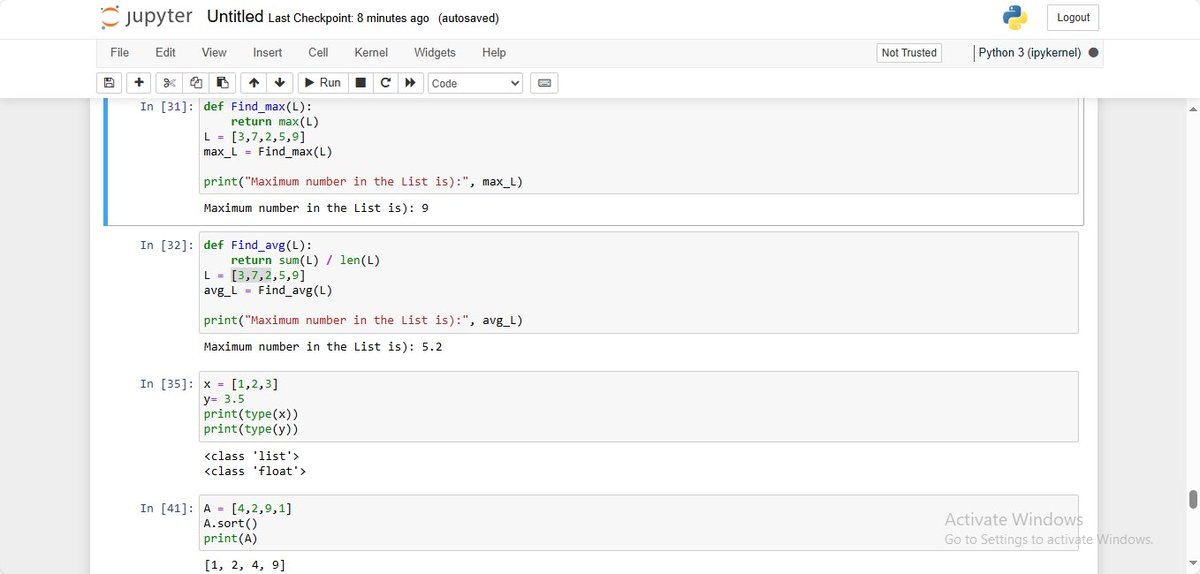
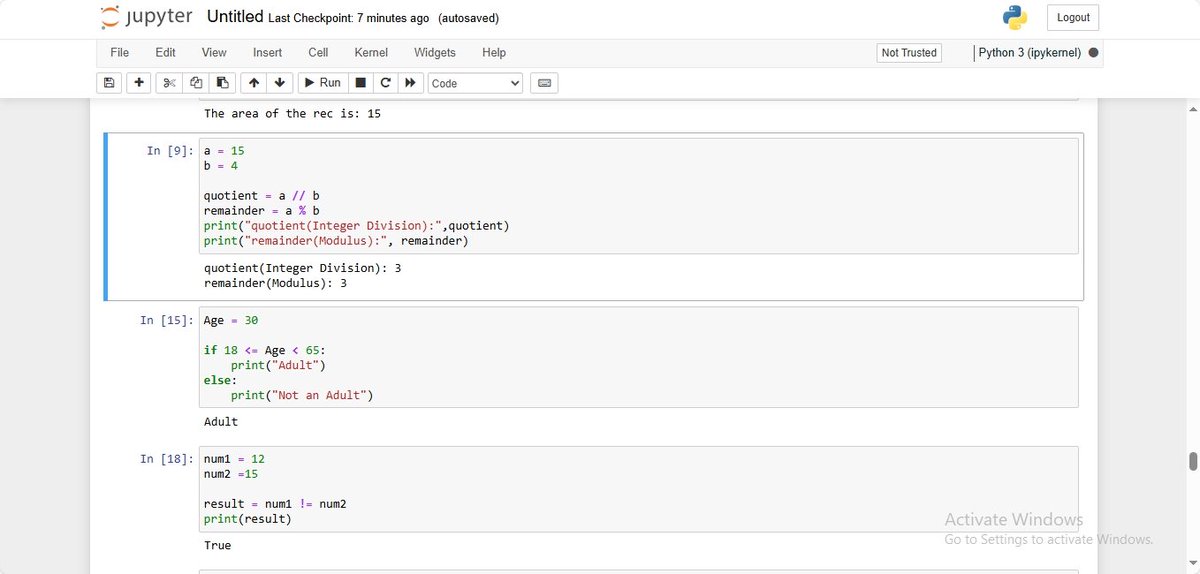
I started my python journey with @TDataImmersed community a few days ago and I’ve learnt the basics; variables, operations and operators as well as functions #data #pythonfordataanalysis


🚀 Ready to Kickstart Your Career in Data Analytics? #DataAnalytics #DataVisualization #PythonForDataAnalysis #Tableau #SQL #PowerBI #CareerGrowth #LearnAndGrow #TechCareers #SkillDevelopment #ITCareers #KVCH

A sneak peek into my project "#PythonForDataAnalysis" I'll be working with VSC editor and I'll host the project on GitHub
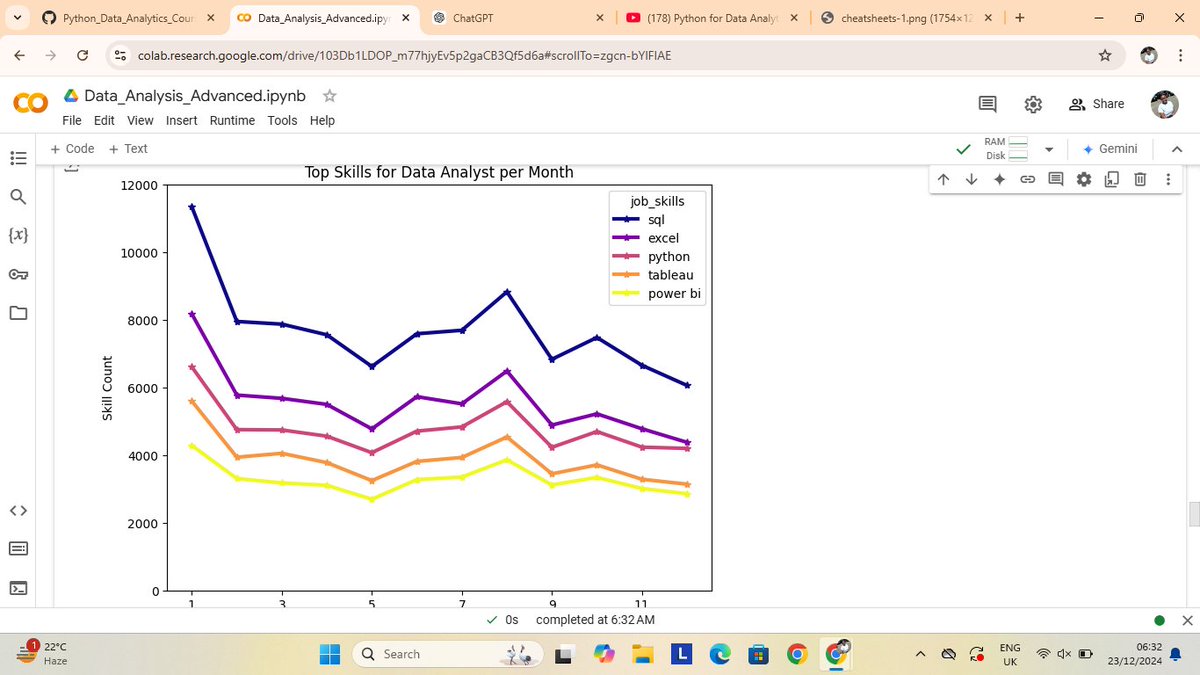
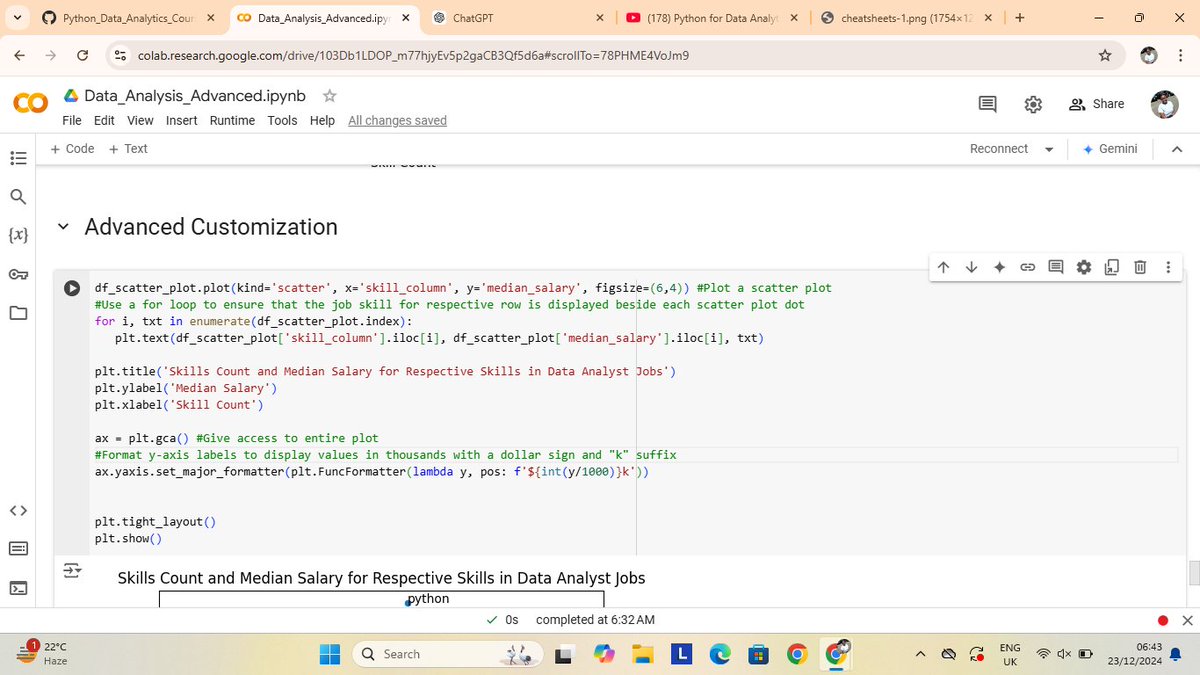
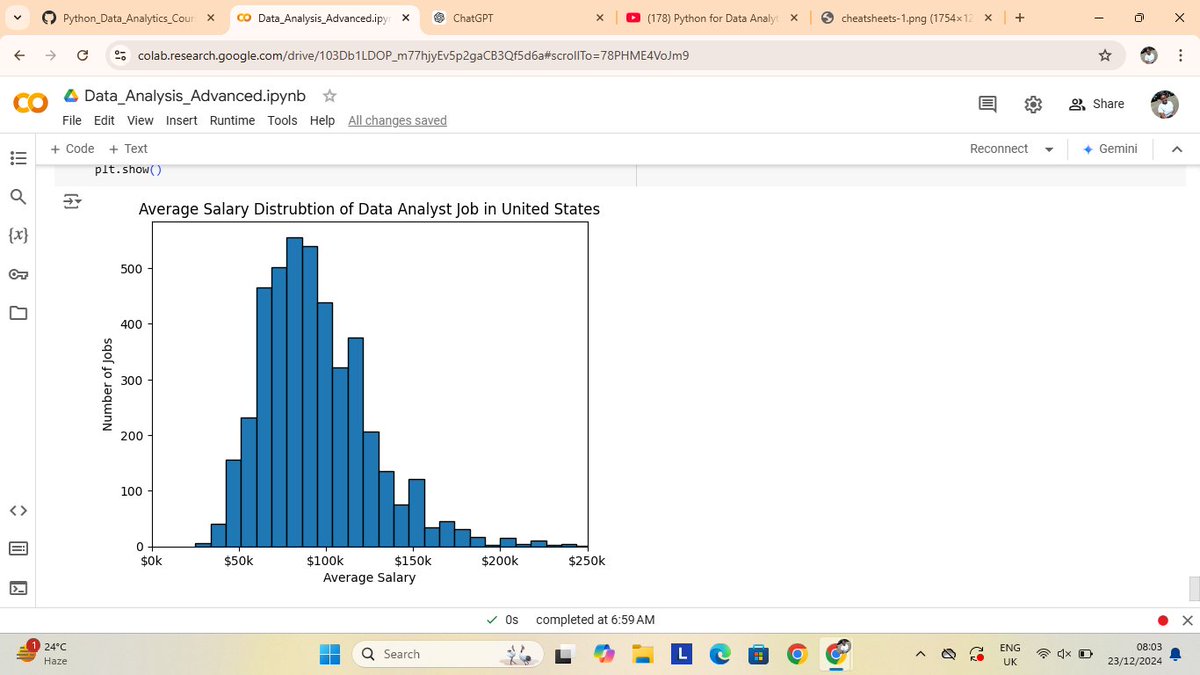
Still in the advanced session of learning #PythonForDataAnalysis I've understand how to customize chart in other to enhance it's reading, I've also learnt how to plot scatter plot and histogram and their overall significance in data analysis #DataAnalysis #Matplotlib

Something went wrong.
Something went wrong.
United States Trends
- 1. Seahawks 27.6K posts
- 2. Seahawks 27.6K posts
- 3. #TNFonPrime 2,307 posts
- 4. Kennedy Center 89.8K posts
- 5. Hunger Games 52.1K posts
- 6. Puka 27.5K posts
- 7. Kenneth Walker N/A
- 8. Salem 23K posts
- 9. Hornets 5,082 posts
- 10. Greg Biffle 98.5K posts
- 11. Zach Charbonnet N/A
- 12. Arnold 8,299 posts
- 13. Brandon Miller 2,178 posts
- 14. Marshawn Lynch N/A
- 15. #LARvsSEA N/A
- 16. Trae 15.1K posts
- 17. Lamelo 2,686 posts
- 18. Rocket Power N/A
- 19. #TSTheEndOfAnEra 5,478 posts
- 20. #NCAAWVB 1,496 posts